Magnetic resonance imaging (MRI) has become an important diagnostic imaging modality in clinical imaging. The main advantage of MRI over other medical imaging technologies [such as computed tomography (CT), ultrasound or positron emission tomography (PET)] lies in its flexibility. It allows one to tailor the imaging study to the anatomic part of interest and to the disease process being studied.
MRI is based on the interaction between an applied magnetic field and a nucleus with a nuclear magnetic moment or ‘spin’. Several nuclei, including 1H, 31P, 13C, 15N and 19F have nuclear magnetic moments and are most suitable for detection by magnetic resonance. Protons (1H) are the most abundant nuclei in living organisms and they have the best MRI sensitivity. For this reason protons are the most frequently studied nuclei.
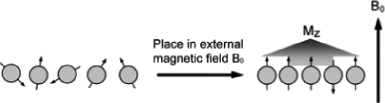
Nuclear (proton) spins are like small magnets. When placed in an external magnetic field (B0) a large number of proton spins will be aligned parallel to B0, with a somewhat smaller number oriented antiparallel Reference Pipe(1). This orientation yields a net nuclear magnetisation and a net magnetisation vector Mz parallel to B0 (Fig. 1). When tilted away from the magnetic field, the spins precess about the axis of B0 (commonly taken as the z-axis) at a frequency proportional to the magnitude of the external magnetic field. This frequency is known as the Larmor frequency (W0) and is given by W0 = γB0, where W0 is the Larmor frequency in MHz, γ is the gyromagnetic ratio; a constant having a characteristic value, for protons γ = 42.58 MHz/T.

Fig. 1 Randomly aligned protons align themselves parallel to the external magnetic field.
B0 is the external magnetic field strength (T).
When a time-dependent magnetic field (B1) is applied perpendicular to B0, by using an Radiofrequency (RF) pulse at the Larmor frequency, the energy supply creates excitation which flips the magnetisation vector Mz from the z-axis towards the xy-plane (Fig. 2).
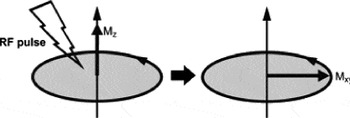
Fig. 2 Net magnetisation Mz flips in to xy-plane following application of a 90° RF pulse.
We call it transverse magnetisation. When the RF pulse is switched off, two independent processes now reduce the magnitude of the transverse magnetisation and thus of the magnetic resonance (MR) signal causing a return to the stable state (equilibrium) present before excitation. These two processes are spin–lattice interaction (also called T1 relaxation) and spin–spin interaction (also called T2 relaxation). T1 and T2 relaxation times are used to describe how long it takes for most of the spins to return to their equilibrium states.
T1 relaxation characterises the return of the M vector along the longitudinal axis. Therefore it is also called longitudinal relaxation. It is a result of interaction between protons (acting through their spinning properties) and the whole environment. It is characteristic of the efficiency of the environment for absorbing the energy of the excited protons during relaxation Reference Sigal(2). The return to the stable state corresponds to an exponential increase (Fig. 3). T1 relaxation time is defined as the time taken by the spins to reach up to 63% of the equilibrium value. T1 increases with an increase in the magnetic field strength (B0).

Fig. 3 Return of the M vector along the longitudinal axis because of T1 relaxation.
T2 relaxation characterizes the disappearance of the M vector in the transverse plane perpendicular to B0. For that reason T2 is also called transverse relaxation time. Immediately after the delivery of RF energy, the protons have the same direction: they are said to be in-phase. As each proton is a tiny magnet, it creates a micromagnetic field more or less disturbing the neighbouring protons, thus going out of phase: there is a loss of phase coherence (dephasing) Reference Sigal(2). The loss of signal corresponding to the effect of T2 can be plotted in a graph as shown in Fig. 4. T2 relaxation time is defined as the time taken by the magnetisation to decay to 37% of its initial value. T2 remains relatively unchanged with increasing magnetic field strength (B0).

Fig. 4 Loss of phase coherence because of T2 relaxation.
Time-independent inhomogeneities within the external magnetic field B0 elicit an additional dephasing. The actual signal therefore will not decay with T2 time but with a shorter time constant known as T2*Reference Weishaupt(3).
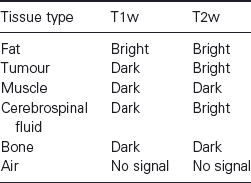
T1, T2, T2* relaxation times and spin density properties contribute to the image contrast in MRI. They are different for different tissue types. Spin density, also known as proton density, is simply a representation of the number of hydrogen protons (spins) in a given volume of tissue. Using pulse sequences the MR signal can be measured at various times during the relaxation process which can vary the image contrast. Images showing T1 contrast are called T1-weighted images (T1w) and images showing T2 contrast are called T2-weighted images (T2w). Table 1 shows contrast for different relaxation times and tissue types Reference Weishaupt(3).
Table 1 Signal strength of various tissues within T1w and T2w images

Tissues having short T1 appear bright in T1-weighted images because they recover faster and thus emit more signals, whereas tissues having long T1 appear dark in T1-weighted images because they relax less rapidly and consequently emit fewer signals. Tissues having short T2 are dark in T2-weighted images and tissues having a long T2 are bright in T2-weighted images.