- AC
alternating current
- Alt
altitude
- Comp
compressor
- ed
energy density
- DC
direct current
- DOH
degree of hybridization
- GT
gas turbine
- HP
high pressure
- hy-el se
hybrid-electric serial
- hy-el pa
hybrid-electric parallel
- IP
intermediate pressure
- LP
low pressure
- Ma
Mach number
- mtow
maximum takeoff weight
- OEI
one engine inoperative
- OEW
operating empty weight
- PAX
passengers
- pd
power density
- TSFC
thrust specific fuel consumption
- tu-el dir
turbo-electric direct
- tu-el pc
turbo-electric power controlled
- Turb
turbine
-
 ${\eta }_{pol}$
polytropic efficiency
-
$\Pi $
pressure ratio
-
${\dot{m}}_{fuel}$
fuel mass flow


1.0 INTRODUCTION
To reach the European Commission’s Flightpath 2050 emission goals of 75% reduction of CO
 ${}_{2 }$
emissions(1), distinct improvements in propulsion systems are necessary. The refining and improvement of conventional turbofan engines is limited and hence cannot be the only option. Therefore, researchers and the industry(Reference Hepperle2,Reference Trimble3) increasingly are focusing on alternative propulsion systems. One possibility is the integration of electric components. Some small aircrafts in the field of general aviation are already equipped with electric drive systems(Reference Martini4). In higher power classes, electric components are not yet a part in propulsion systems.
${}_{2 }$
emissions(1), distinct improvements in propulsion systems are necessary. The refining and improvement of conventional turbofan engines is limited and hence cannot be the only option. Therefore, researchers and the industry(Reference Hepperle2,Reference Trimble3) increasingly are focusing on alternative propulsion systems. One possibility is the integration of electric components. Some small aircrafts in the field of general aviation are already equipped with electric drive systems(Reference Martini4). In higher power classes, electric components are not yet a part in propulsion systems.
This study regards alternative engine configurations by applying electric components to a commercial aircraft. The investigations focus on potential reductions of the environmental impact of a regional aircraft and define influences on the gas turbine (GT) cycle and the aircraft. Based on present (2017) technology assumptions alternative propulsion systems are designed such as turbo-electric, hybrid-electric and pure electric propulsion systems. These are represented in performance models using DLR’s in-house simulation tool GTlab(Reference Becker5). Finally, the concepts are compared to a reference case based on flight mission simulation by means of the GTlab Flight tool. Besides fuel consumption, emissions and primary energy demands are also discussed.
2.0 METHODOLOGY AND APPLICATION
2.1 Approach
Developing alternative propulsion systems like turbo-electric and hybrid-electric engines implies an increase of complexity compared to the conventional GT cycle. The increase in number of components results in an enhanced total weight and thrust requirements. The complex system of parameters influencing the aircraft’s mission performance is thereby brought out of balance and is required to be redesigned from scratch. All engine components must be matched with one another and the aircraft in total, so that the entire system can operate efficiently.
The design of the propulsion systems is based on the individual components technology. Table 1 presents the assumptions for power or energy densities and efficiencies.
Table 1 Technology assumptions at present state (2017) for design of alternative propulsion systems

The assumptions correspond to state-of-the-art technology levels and are based on a literature review and expert surveys. According to van der Geerst(Reference van der Geest6) the power density depends on the surface speed or rotational frequency of the electric motor. In each concept, the power density will be adapted to the appropriate level of rotational speed. The electric motor’s power densities in this study are related to Martini(Reference Martini4) and Compact Dynamics GmbH(7).
The battery is chosen as a high energy cell. Therefore, its power density is limited to approximately 0.7 kW/kg(Reference Wagner8). The power density of power electronics is based on the manufacturer’s data. The presented magnitude is confirmed by Erickson et al.(Reference Erickson, Maksimovic and Afridi9) and Casady(Reference Casady10). Data for the DC-DC converter is taken from Matlok(Reference Matlok11).
2.2 Case of application
This study uses the ATR 72 aircraft as a reference case to determine the potential for electrification. Hence, the propulsion system configurations are designed to meet the requirements for this regional aircraft, which is propelled by two PW127 turboprop engines. Table 2 presents a selection of characteristic aircraft properties for the ATR 72 aircraft model. Typical flight missions for regional aircrafts are around 200 - 300 nautic miles (370 – 556 km). This is much shorter than the maximum range (r), see Table 2.
Table 2 Characteristic properties of ATR 72 aircraft(14)

2.3 Reference case
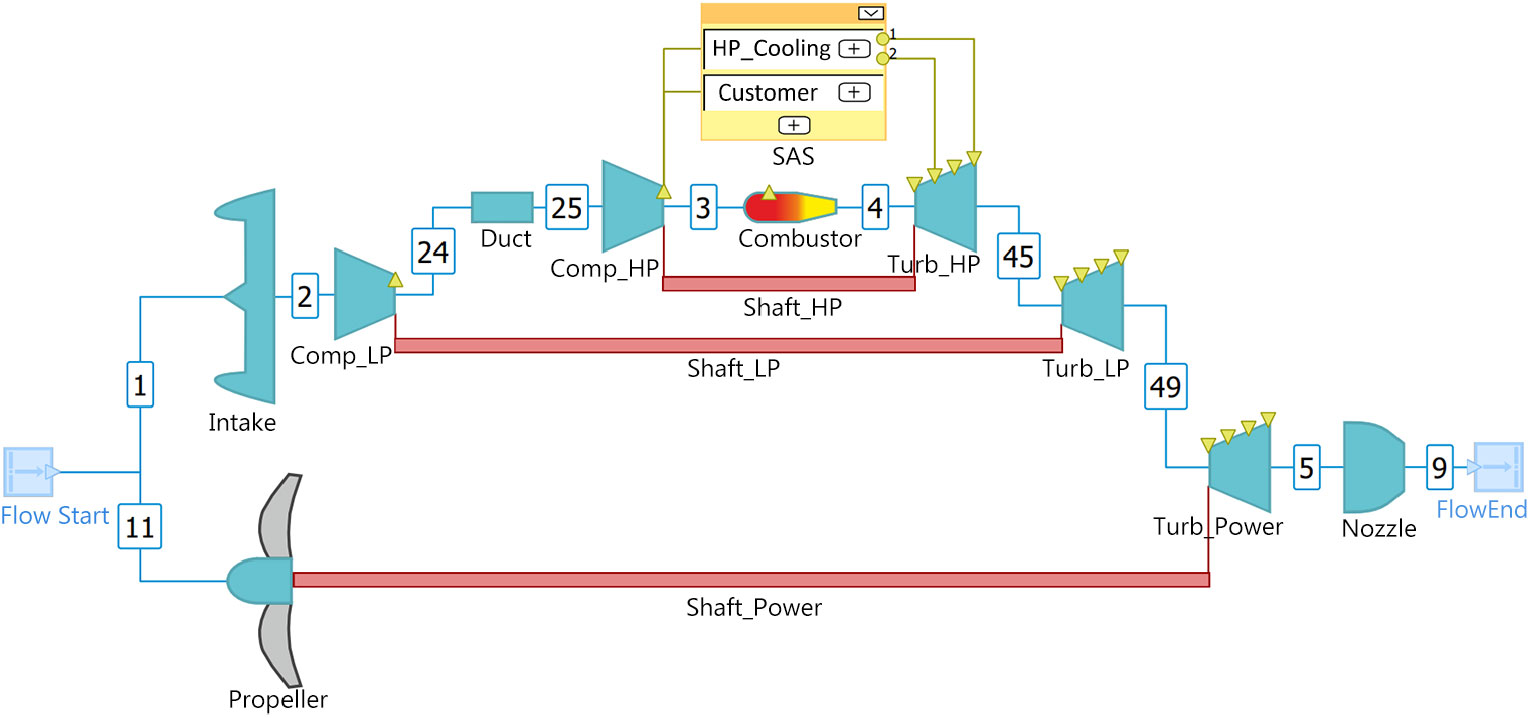
The different configurations are assessed in comparison to the reference case, which is described in this section. According to the PW127 engine, a DLR127 model is set up within the GTlab performance synthesis tool. This engine operates with three spools, two compressors, a combustion chamber, three turbines, and a secondary air system. Thrust is generated by a propeller. The core engine is used for power generation providing just a small fraction of thrust. The propeller is linked through a gearbox to the power turbine. The layout and station numbering of the model is presented in Fig. 1.

Figure 1. Schematic of the thermodynamic model of DLR127 engine.
For the modeling of the thermodynamic cycle, data from literature(Reference Daly and Gunston12,Reference Hosking, Kenny, McCormick, Moustapha, Sampath and Smailys13) , data sheets(14,15) and the emissions database(16) are taken into account. Data could be found for power, rotational frequencies, temperature limits, fuel flow rates, and pressure ratios. For engine modeling, the cruise operating point is chosen as the design point. A selection of performance parameters of the design point is shown in Table 3.
Table 3 Parameters of engine components in design point
For all off-design points, the compliance of calculated values to temperature limits and plausibility of all other engine data is verified.
3.0 ELECTRICAL PROPULSION SYSTEM CONFIGURATIONS
The alternative propulsion systems are designed in the functional context of the ATR 72. For that purpose, the properties of the components are matched to each other and the masses of propulsion systems are calculated as the sum of all components. The requirements for the propulsion systems are derived from the reference engine.
Most alternative propulsion systems use a GT, which principally corresponds to the turbo unit of the reference engine to ensure the same technology levels for all configurations. However, to fulfill the different power requirements of the configurations, it is scaled by the mass flow. The principal arrangements of all alternative propulsion systems are shown in Fig. 2.

Figure 2. Principal arrangements of components in alternative propulsion systems.
3.1 Turbo-electric
In the turbo-electric concept, mechanical energy from the GT is converted into electric energy by the generator. Since larger GTs generally work more efficiently than smaller ones, a single GT for both propelling units is conceivable. The disadvantage, in this case, is the loss of redundancy for the case of one engine inoperative (OEI). Relying purely on electric propulsion as a backup system would require large batteries. With current technology, the weight of such a battery system would by far outweigh the efficiency gain of a single, larger gas turbine. Thus, it is not regarded here. In this study, two variations of turbo-electric propulsion systems are investigated.
Turbo-electric power controlled (tu-el pc)
Figure 2(a) shows the principal setup. Between generator and motor, two power electronics are arranged. The first one converts the voltage to a high DC level (1000V), thereby reducing conduction losses in the wires. The second one creates the voltage and frequency of AC (580V), which is necessary to drive the motor. The component’s properties are chosen in such a way that a gearbox is not necessary for this concept. Applying the component efficiency values from Table 3, the efficiency of the electric system yields
 $$\begin{equation}
{\eta }_{{\rm el-sys}}={\eta }_{{\rm mot}}*{\eta }_{PE}*{\eta }_{{\rm cond}}*{\eta }_{{\rm PE}}*{\eta }_{{\rm gen}}=0.8562
\label{eqn1}
\end{equation}$$
$$\begin{equation}
{\eta }_{{\rm el-sys}}={\eta }_{{\rm mot}}*{\eta }_{PE}*{\eta }_{{\rm cond}}*{\eta }_{{\rm PE}}*{\eta }_{{\rm gen}}=0.8562
\label{eqn1}
\end{equation}$$
Due to the number of additional components, the resulting engine is quite heavy. It is more than 1000 kg heavier compared to the reference engine.
Turbo-electric direct (tu-el dir)
Without power electronics, the generated electricity is conducted without any conversion to the motor (see Fig. 2(b)). That causes a direct link of both rotational speeds. Because of the different rotational speeds of propeller and power turbine, there has to be an adaption. This can be reached by a gearbox, a frequency converter, different numbers of poles in motor and generator or any combination of these aspects. Due to skin- and proximity-effects direct conduction with the power turbines frequency is not possible without further changes to the electrical system, e.g. voltage. In order to limit complexity, a gearbox is chosen to be placed in front of the generator. For this purpose, the gearbox from the reference engine is assumed to be suitable. That setup results in an electric efficiency of
 $$\begin{equation}
{\eta }_{el-sys}={\eta }_{mot}*{\eta }_{cond}*{\eta }_{gen} =0.8994
\label{eqn2}
\end{equation}$$
$$\begin{equation}
{\eta }_{el-sys}={\eta }_{mot}*{\eta }_{cond}*{\eta }_{gen} =0.8994
\label{eqn2}
\end{equation}$$
Although at first glance this configuration seems to be simpler, it finally causes a similar additional weight like the tu-el dir concept. Reasons are the heavy wires as there is no conversion to higher voltages and the necessity of the gearbox.
3.2 Hybrid-electric
The hybrid-electric concepts use energy from two carriers. Besides the GT, a battery supplies additional energy. During the different flight phases, the energy carriers can be balanced in a way that the total system can optimally perform. For the configuration of the battery, energy density and power density are the major limitations. The electric support is contributed during takeoff and climb. That leads to a smaller GT, as the operating points relevant for sizing of the GT are electrically supported. Two different types of hybrid-electric propulsion systems are investigated.
Hybrid-electric parallel (hy-el pa)
In the hybrid-electric parallel setup, the electric motor is assembled on the power shaft of the reference engine. The setup is presented in Fig. 2(c). The components are located close to each other. Therefore, the available design space and temperature limitations might be critical constraints for that arrangement. The electric motor should not get any extra heat from the GT unit. Thus, it seems reasonable to place the motor in front of the compressors or at the gearbox. The electric efficiency for the hy-el pa concept is
 $$\begin{equation} {\eta }_{el-sys}={\eta }_{mot}*{\eta }_{PE}*{\eta }_{cond}*{\eta }_{bat}=0.9152
\label{eqn3} \end{equation}$$
$$\begin{equation} {\eta }_{el-sys}={\eta }_{mot}*{\eta }_{PE}*{\eta }_{cond}*{\eta }_{bat}=0.9152
\label{eqn3} \end{equation}$$
The smaller scaled GT causes the engine to operate with higher temperatures in cruise conditions. This behaviour is also reproduced by the thermodynamic model. Generating energy during descent is also an option to get enough energy reserves for a potential go around scenario. In the flight-idle state, the gas turbine must maintain a certain rotational speed to ensure quick acceleration in case of an emergency. With the fan or propeller windmilling, this residual power is available for generating electricity. The battery is designed for the energy, which is required for takeoff and climb. The scaling of the GT is realised by the selection of the engine design point. It is chosen with lower thrust and power, resulting in a smaller mass flow rate. That corresponds to the smaller scaled engine. Parameters like component efficiencies, pressure ratios or fuel to air ratio are kept unchanged to obtain comparability. However, the power coefficient of the propeller has to be adapted, because of the reduced power requirement at the design point. This must be considered during the propeller design of propulsion systems in that functional context. The amount of additional power from the battery can be chosen freely. For the case of application which is treated here, it is limited by the MTOW of the aircraft. In this study, two variants of a parallel hybrid-electric concept are proposed. In both versions, the power density is close to today’s power density limit of 0.7 kW/kg.
Hy-el pa 10 supplies 10% of the takeoff power electrically from the battery. This power stays constant during takeoff and climb. The relatively small share of electric power leads to a moderate battery weight. So the additional weight per propulsion unit is around 300 kg (see Table 4).
Table 4 Mass effects of alternative propulsion systems per propulsion unit

Hy-el pa 40 has a larger battery and supports 40% of the takeoff power. The support also stops after the climb segment. The battery becomes so heavy, that the limitations of MTOW are reached with this configuration.
In a hybrid-electric serial propulsion system, the GT and the electric propulsion are decoupled. Figure 2(d) shows that the arrangement is similar to the tu-el pc concept. In the hy-el se concept, the generator does not provide all the power. During takeoff and climb the power requirement is partly contributed by the battery. Due to MTOW restrictions, this cannot exceed about 10% of the takeoff power. The electric system efficiency during pure generator operation is the same as tu-el pc concept,
 ${\eta }_{el-sys}=0.8562.$
If additional power is provided by the battery, a mixed value will result as the total electric efficiency. This value will be slightly higher and depend upon the power ratio of the battery and the gas turbine. Since the system consists of many components, it is complex and heavy resulting in major disadvantages comparable to turbo-electric concepts.
${\eta }_{el-sys}=0.8562.$
If additional power is provided by the battery, a mixed value will result as the total electric efficiency. This value will be slightly higher and depend upon the power ratio of the battery and the gas turbine. Since the system consists of many components, it is complex and heavy resulting in major disadvantages comparable to turbo-electric concepts.
3.3 Pure electric (p-e)
The principal setup of the pure electric concept is quite simple. It is presented in Fig. 2(e). The battery supplies electric power, which drives the motor. In between, power electronics are necessary. Hence the electric system efficiency is analog to hy-el pa concept
 $$\begin{equation}
{\eta }_{el-sys}={\eta }_{mot}*{\eta }_{PE}*{\eta }_{cond}*{\eta }_{bat}=0.9152
\label{eqn4}
\end{equation}$$
$$\begin{equation}
{\eta }_{el-sys}={\eta }_{mot}*{\eta }_{PE}*{\eta }_{cond}*{\eta }_{bat}=0.9152
\label{eqn4}
\end{equation}$$
Regarding the component masses, the electric motor including all necessary peripheries is heavier than the reference engine (see Table 4). The battery weight can be seen as the limiting parameter for this configuration, which is not feasible assuming today’s technology levels. To enable an all-electric flight for the considered flight length, the energy density of the battery has to be approximately 800 Wh/kg. That is four times more than the assumed specification for today’s batteries. Therein, safety reserves are still not considered yet. At the same time, the battery’s power density has to be improved by at least the same factor.
3.4 Mass breakdown results
For all concepts, the masses of propulsion units are calculated which are shown in Table 4 (effect per propulsion unit). The component masses are based on technology assumptions shown in Table 1. Fuel savings are still roughly approximated here. Results from the flight mission calculations could be used in the next design cycle.
3.5 Performance results
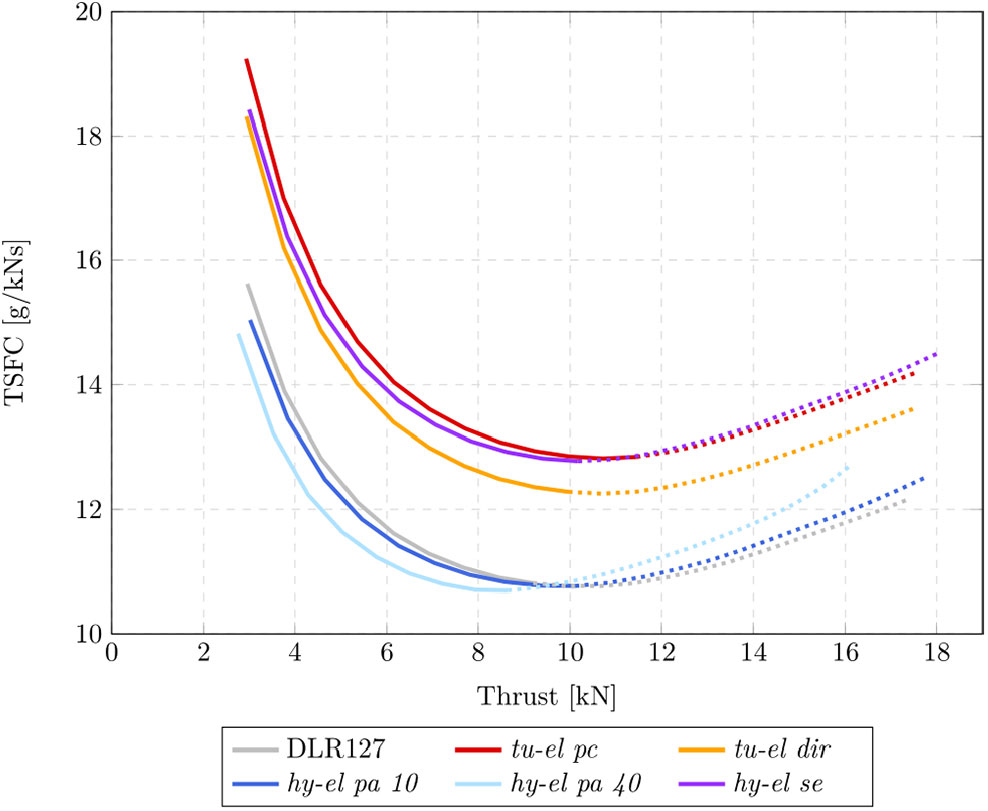
As the performance characteristics of the different propulsion systems have a significant impact on the mission fuel consumption, the different behaviours are illustrated in Fig. 3. The curves do not include energy taken from batteries in hybrid-electric propulsion systems.

Figure 3. Thrust specific fuel consumption versus thrust of GT in different propulsion systems; dotted lines symbolise that one temperature limit is exceeded (T4 or T49).
The plots confirm that turbo-electric configurations work inefficiently because of multiple converting mechanisms. The similarity between tu-el pc and hy-el se can easily be seen. Tu-el dir causes fewer losses, as there are no power electronics. Hy-el pa configurations are mostly similar to the reference engine’s behaviour. Due to the smaller scaled GT, the TSFC-optimum stays on the same level but moves to a smaller thrust. The dotted lines indicate the region where GT temperature exceeds the limits. The closer the operating point approaches to the temperature limit, the more efficiently the process works. The temperature level in the scaled GTs is higher than in the reference. That indicates the necessity of an adaption of GT cycle for that application, e.g. optimization of the cooling system.
4.0 FLIGHT MISSION RESULTS
4.1 Flight mission simulation
To determine the fuel consumption on aircraft level the engine data is coupled with an aircraft model via GTlab Flight. Therein, the aircraft is assumed as a point mass model and defined by a characteristic mass. Drag polars are based on BADA data. Engine performance data are calculated for the entire flight envelope and different thrust settings are stored within a performance data table. During flight missions, altitude, thrust, lift, drag and weight are calculated for each step. The corresponding fuel flow is interpolated from the engine performance data table. For the flight mission simulations in this study, a constant trajectory is used for all alternative propulsion systems. The flight profile corresponds to the ATR72 data in the Eurocontrol Aircraft Reference Database. This implies that the assumed flight velocities and rates of climb are kept constant and the required power is calculated for each step. This is a simplification, which is assumed to be not significant in the comparison of relative results for the first instance. The aircraft itself is kept untouched. As there are significant differences in the weight of the propulsion systems, it is necessary to reduce the payload in order to enable constant transport capacities through all concepts for the compared flight mission. The resulting payload is 4,974 kg in comparison to the maximum payload of the ATR 72 which is 7,000 kg. Thus, the reference and hy-el pa 10 configurations transport less payload than practically feasible.
Despite significant differences in the total weights of alternative propulsion units, all concepts are to be integrated into the ATR 72. Due to the same payload, the takeoff weights of the concepts changed according to the weight modifications of the propulsion systems and the required mission fuel burn. All this has to be respected in the design process leading to an iterative procedure. Based on the data presented in Table 4, the pure electric propulsion system clearly exceeds the MTOW restrictions of ATR 72. The resulting takeoff weights for the residual concepts under consideration are 21,500 kg for hy-el se, 21,100 kg for hy-el pa 40, 21,010 kg for tu-el dir, 20,960 kg for tu-el pc, 19,160 kg for hy-el pa 10 and 18,500 kg for the reference.
4.2 Fuel consumption
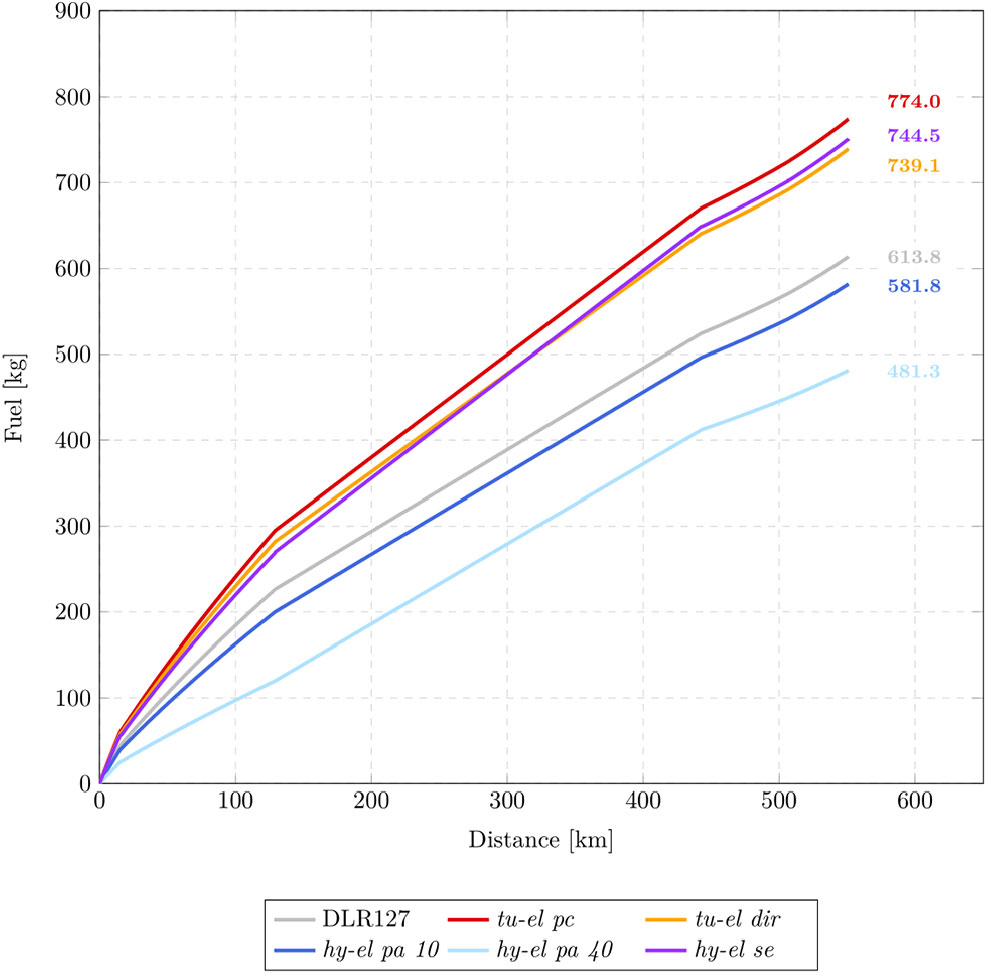
Figure 4 presents the resulting fuel consumption on the flight missions with all propulsion systems. As expected, tu-el pc, tu-el dir, and hy-el se concepts cause increased fuel consumption on the flight mission. The difference between power controlled and direct turbo-electric variants can be seen. Additional conversion implies increased losses and fuel consumption. Hy-el pa configurations show the potential to save fuel compared to the reference engine. During the climb the GT is supported by the electric motor. Despite the additional weight of the battery, this saving can be kept over the whole mission. The partially parallel curves in the cruise segment point out that behaviour. The saving is 5.21% for hy-el pa 10 and 21.6% for hy-el pa 40.

Figure 4. Fuel consumption with alternative propulsion systems and reference engine at 300 nm mission; electric energy from batteries is not presented.
To analyze the effect of smaller-scaled GTs, Fig. 5 shows the fuel mass flow rates of the alternative propulsion systems during the compared mission. In the climb segment, the mass flow rates of hy-el pa configurations are clearly reduced. In the case of the hy-el pa 40, it is even lower than the level of cruise segment. Here, a design with a constant level of fuel mass flow or load in the climb and cruise segments seems to be reasonable.
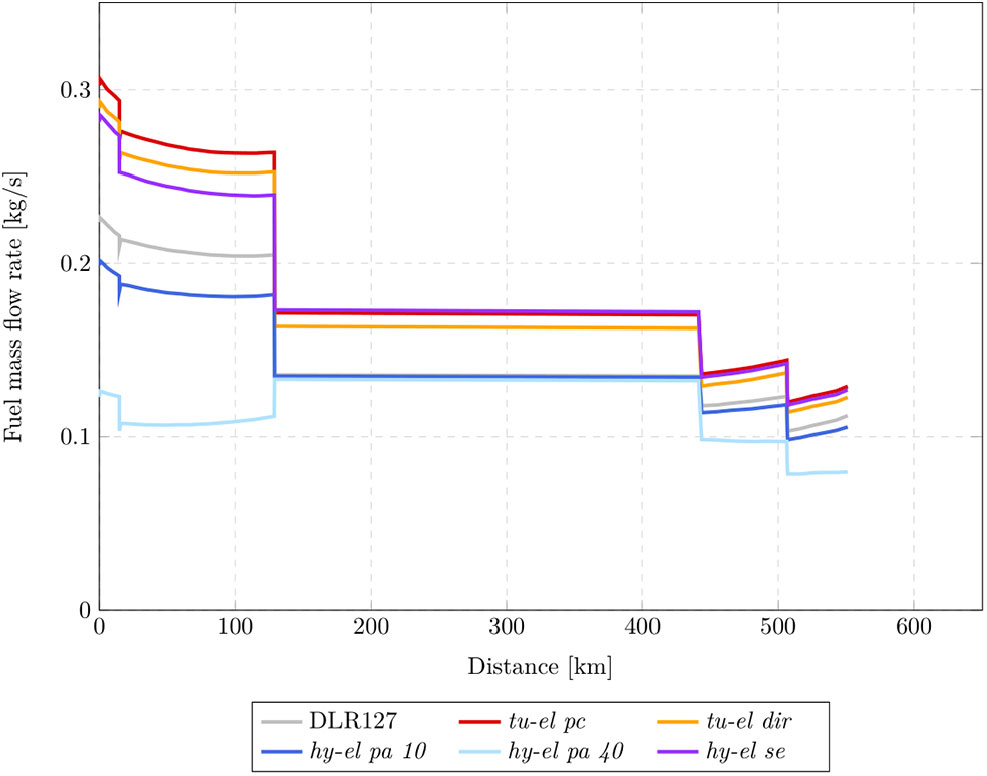
Figure 5. Fuel mass flow rate of different propulsion systems during flight mission.
During the cruise, the hy-el pa concepts and the reference configuration are on the same level. For this it is crucial that hy-el pa has a smaller scaled GT. It works at an operating point with lower TSFC which is compensated by higher thrust requirements because of the battery weight.
The lower fuel mass flow rates during descent can be explained by enhanced efficiency at lower load.
4.3 Energy consumption
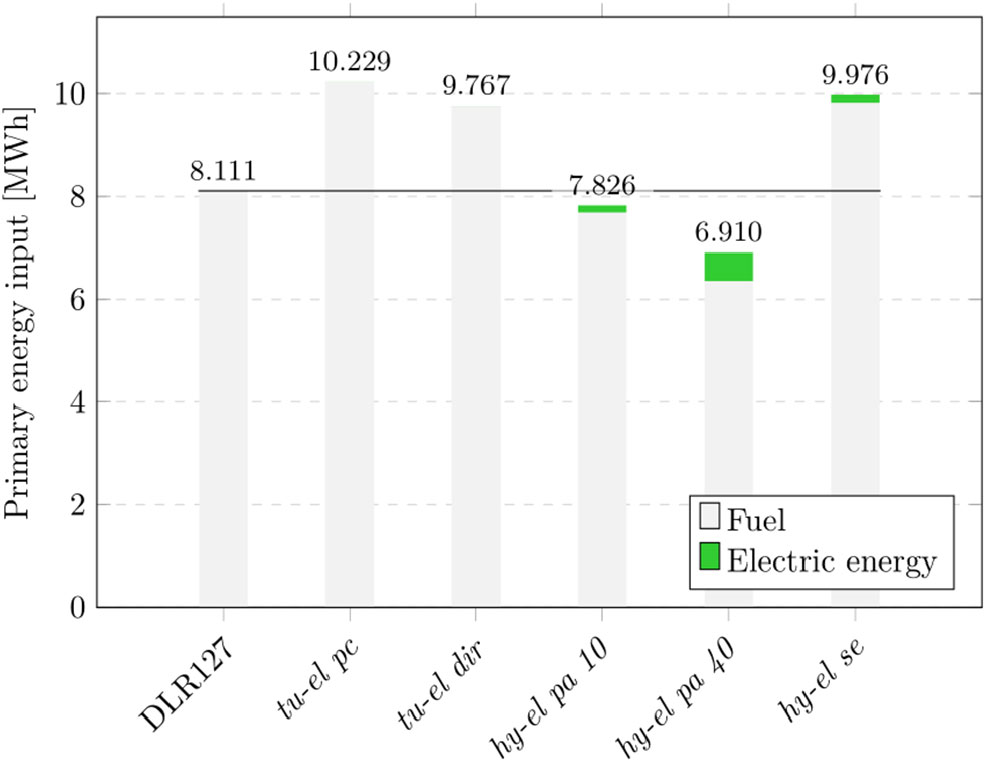
The electric energy obtained from the batteries has not been considered so far. To discuss the total amount of energy necessary to cover the flight mission, the sum of electric energy and fuel-bound energy is shown in Fig. 6.
A fuel heating value for jet fuel of 43.25 MJ/kg(17) is assumed. The shares for fuel and electric energy are each multiplied by a primary energy factor, to consider the efforts to generate and transport energy. The specific energy input for electricity is 2.13(18), which is more than the primary energy factor of kerosene with 1.1(Reference Novelli19). Thus, the share of electricity at the total energy demand increases. The optimisation of primary energy demands with the help of hy-el pa propulsion systems is correspondingly lower. The main influence of the share of electricity is the energy mix in the production of electricity.

Figure 6. Primary energy inputs for compared mission covered by alternative propulsion systems.
4.4 Emissions
For a holistic view, the behaviour of emissions is shown besides fuel consumption and energy demands. The direct CO
 ${}_{2}$
emissions from the combustion of Jet-A1 are 3.156 kg/kg(Reference Sutkus20). The equivalent CO
${}_{2}$
emissions from the combustion of Jet-A1 are 3.156 kg/kg(Reference Sutkus20). The equivalent CO
 ${}_{2}$
emissions are 0.6055 kg/kg(Reference Wolters, Becker and Schaefer21). Based on Germany’s average energy mix in 2015, electricity causes 534 g/kWh of CO
${}_{2}$
emissions are 0.6055 kg/kg(Reference Wolters, Becker and Schaefer21). Based on Germany’s average energy mix in 2015, electricity causes 534 g/kWh of CO
 ${}_{2}$
emissions(Reference Icha and Kuhs22). Figure 7 presents the calculated emissions split into direct and indirect. The potential for saving emissions is in the field of direct emissions. These are proportional to the fuel consumption described in section 4.2. In terms of indirect emissions, there is just a negligible change for hy-el pa 10 and for hy-el pa 40, there is a slight increase. In general, indirect emissions are advantageous as they arise mostly at power plants which are stationary. This offers possibilities of filtering and treating the emitted gases and particles. Generally, the share of life cycle equivalent emissions caused by electricity can be reduced by an increased amount of regenerative energy in the electricity mix.
${}_{2}$
emissions(Reference Icha and Kuhs22). Figure 7 presents the calculated emissions split into direct and indirect. The potential for saving emissions is in the field of direct emissions. These are proportional to the fuel consumption described in section 4.2. In terms of indirect emissions, there is just a negligible change for hy-el pa 10 and for hy-el pa 40, there is a slight increase. In general, indirect emissions are advantageous as they arise mostly at power plants which are stationary. This offers possibilities of filtering and treating the emitted gases and particles. Generally, the share of life cycle equivalent emissions caused by electricity can be reduced by an increased amount of regenerative energy in the electricity mix.
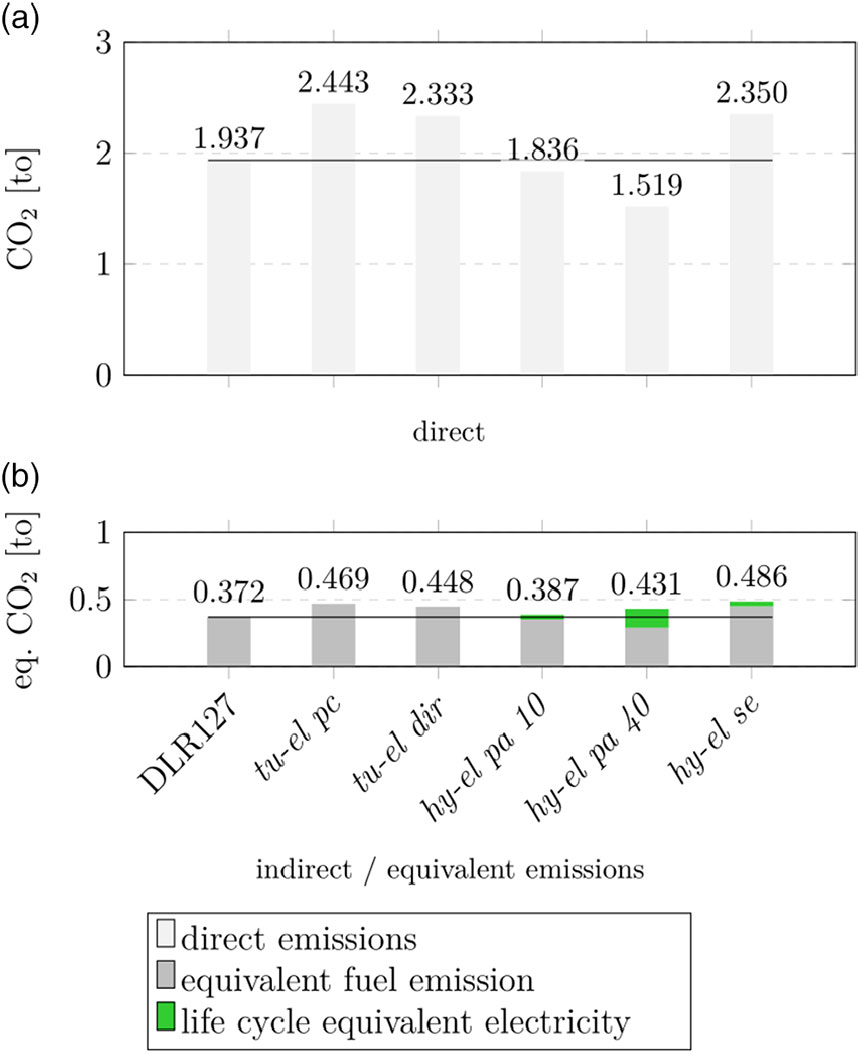
Figure 7. Direct and equivalent emissions for the compared flight mission covered by alternative propulsion systems.
5.0 DISCUSSION
5.1 Weight analysis
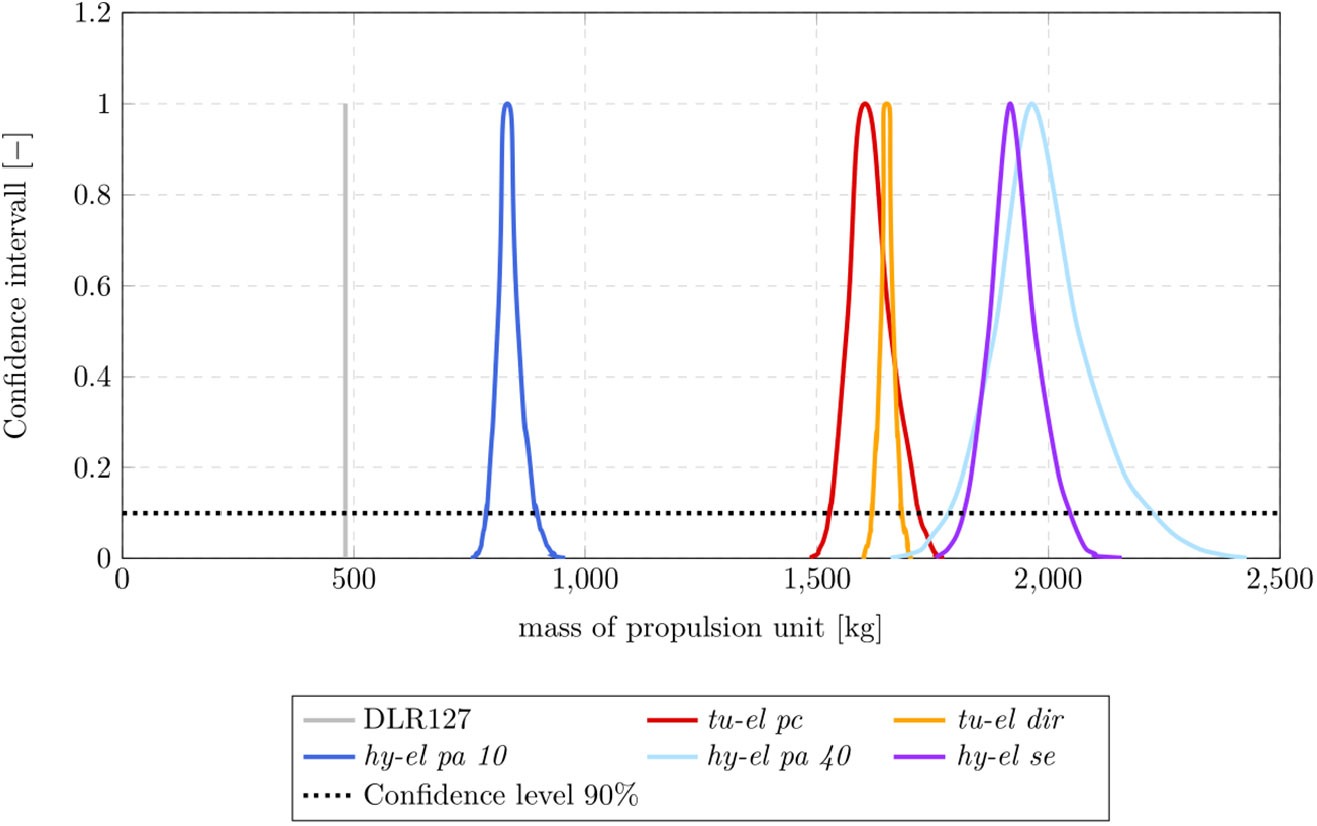
Some parameters in the design process are bound by uncertainties. Their influence on total system weight is examined in this section with the help of the GTlab Stochastics Tool. A distribution function in the form of a rectangle, triangle or Gaussian curve is applied to all parameters to calculate the resulting masses for all engine concepts. The results are presented in Fig. 8.

Figure 8. Uncertainties of propulsion unit weights of different propulsion systems.
The mass of the reference engine is represented by a line (without uncertainties). The alternative system weights clearly exceed the reference value. The peaks of the plots do not exactly correspond to the masses in Table 4. The biggest deviation is 5% for hy-el pa 40. The reason is that not all uncertainties are symmetrically distributed around the assumptions. The dashed line hints the confidence level, which the true total mass will have with a 90% probability. The resulting areas are of different sizes. However, the total masses are not significantly influenced. The main causes of uncertainty are battery and power electronics. A sensitivity analysis shows that their influence increases with an increase in the weight.
5.2 Improvement of the electric setup
For hy-el pa propulsion systems, potentials for fuel savings have been identified, while two variants supporting 10% and 40% of takeoff power during climb have been examined. For a more detailed analysis of the impact of the degree of hybridisation (DOH), different DOHs are considered. The DOH is defined here as the share of power provided electrically during takeoff and climb. Figure 9 illustrates the mission fuel consumption for different DOHs. The result for DOH = 0.5 does not fulfill the MTOW requirements of ATR 72 with the payload presented in section 4 because of the battery size. The scaling of GTs implied by variation of DOH is done by reducing the respective design point according to the extra electric power.

Figure 9. Fuel consumption of hybrid-electric serial propulsion systems varying DOH on 300 nm mission.
Figure 9 shows that mission fuel consumption decreases almost linearly with rising DOH. With the definition of DOH applied here, values above 0.5 are not useful as the cruise load of the gas turbine would become larger than the climb load. With a further rising share of electric energy, the cruise segment also needs to be supported electrically. Besides MTOW restrictions, the peak cycle temperature is another limiting parameter. Figure 10 presents the temperature behaviour depending on DOH.
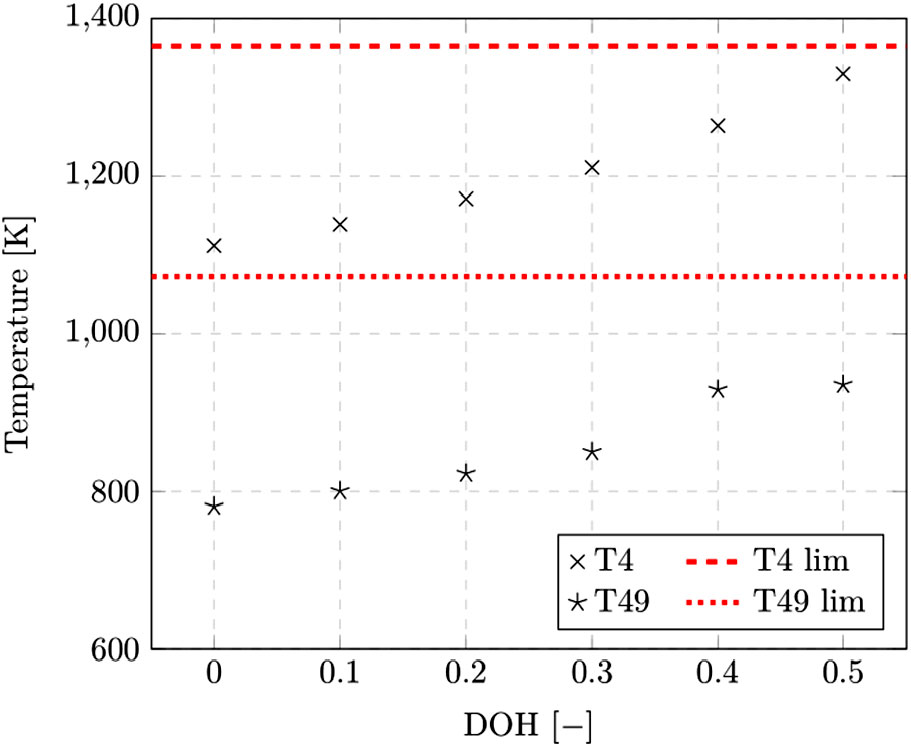
Figure 10. Temperatures T4 and T49 during cruise (Alt = 6000m, Ma = 0.447) in propulsion systems with varying DOH.
A rising DOH implying smaller GTs causes higher temperatures. Temperature limits are provided by EASA(15) for T4. Large DOHs move close to the temperature limits in cruise conditions. Warmer environmental conditions and larger loads probably will exceed the limits, which prevents their feasibility. The maximum feasible DOH for this example is 0.4.
5.3 Energy per payload
The reduced payload represents a restriction for the comparison described in this study. If the ATR 72 is regarded with its maximum payload, it will be considerably harder to reach reductions in fuel consumption. Considering the quotient of primary energy per payload none of the alternative propulsion systems installed in ATR 72 reaches the level of the reference engine with maximum payload. So, it can be concluded that new architectures for electrically supported aircrafts are necessary, respecting that extra weight of the electric components will be added.
5.4 Enhanced technology level by 2025
To assess the results in terms of the technology assumptions, an enhanced technology level was considered, extrapolating the values to 2025. Therefore, the electric motor power density is increased to about 7.5 – 12 kW/kg with an efficiency of about 0.97. Battery energy density may be enhanced to about 300 Wh/kg, the power density of power electronics could reach 20 kW/kg and DC-DC converters are assumed to reach power densities of about 80 kW/kg.
These technology levels are applied to the electric configurations and assessed on the flight mission. The fuel consumption results indicate that the tu-el pc (
 $-$
7,4%), tu-el dir (
$-$
7,4%), tu-el dir (
 $-$
4,6%) and hy-el se (
$-$
4,6%) and hy-el se (
 $-$
7,4%) configurations are improved significantly. However, the hy-el pa 10 (
$-$
7,4%) configurations are improved significantly. However, the hy-el pa 10 (
 $-$
0,4%) and hy-el pa 40 (
$-$
0,4%) and hy-el pa 40 (
 $-$
3%) systems show lower fuel consumption benefits. Hereby, the lighter battery system may increase the payload capability and hence enhance the energy per payload ratio.
$-$
3%) systems show lower fuel consumption benefits. Hereby, the lighter battery system may increase the payload capability and hence enhance the energy per payload ratio.
6.0 CONCLUSION AND OUTLOOK
The currently known electric aircrafts are – mostly because of the energy storage – clearly limited to short distances and low power requirements. The analysis of propulsion system weights shows that, with the current state of the art technology, the electrification of commercial aircrafts is an option with turbo-electric or hybrid-electric propulsion systems. These have been simulated on a flight mission basis using the example of an ATR 72 aircraft. The turbo-electric aircraft (in both concepts – power controlled and directly driven) generate massive extra weights and loss of total efficiency due to multiple converting mechanisms. The same applies for the hybrid-electric serial propulsion system which is largely similar. Further development of these configurations becomes viable when superconducting technology is getting feasible. However, the possibility for the electrical power distribution may enhance the configurational capabilities of the system, which may lead to potential gains then.
Pure electric propulsion systems need a massive improvement in energy and power density of batteries. The regional flight mission regarded in this study (with reduced payload) requires at least a further development by a factor of 4 for both.
Parallel hybrid-electric propulsion systems have the potential to reduce fuel consumption on flight missions. Savings are realised by a changed gas turbine design in combination with an electric motor driven by a battery. Peak loads are covered by the electric system and may lead to increased gas turbine temperatures. With the increasing size of the electric system, up to 21% savings in fuel consumption are feasible. Direct emissions in CO
 ${}_{2 }$
emissions behave proportionally to fuel savings. Indirect emissions remain on a similar level like the reference case. Their share could be reduced by an increased amount of regenerative energy at the electricity mix.
${}_{2 }$
emissions behave proportionally to fuel savings. Indirect emissions remain on a similar level like the reference case. Their share could be reduced by an increased amount of regenerative energy at the electricity mix.
For a regional aircraft, the potential to save fuel and emissions has been demonstrated. Although the general trends remain unaffected by this, the actually detectable potentials also depend on the selected performance requirements in the individual segments of the flight mission. A moderate extrapolation of the technology level may enhance the fuel consumption benefits and underline the general trends. However, due to the weight penalties, electric propulsion systems require a modification of the aircraft architecture. The restriction to short ranges may be overcome through advanced batteries in the future.