


Introduction
Hindus and Muslims are the two major religious groups in India, accounting for 79.80% and 14.23% of the population, respectively (Office of the Registrar General and Census Commissioner, 2015). The fertility differential between these two religious groups is a sensitive and highly politicized issue (Jeffery & Jeffery, Reference Jeffery and Jeffery2000, Reference Jeffery and Jeffery2002, Reference Jeffery and Jeffery2005). While a higher level of fertility among Muslims has been fairly well known since the days of pre-independence India (Davis, Reference Davis1946; Visaria, Reference Visaria1974), the extent of this excess fertility, and its causes and changes over time, have been the subject of debate. For instance, some researchers have argued that the gap in fertility is small, but that it has usually been exaggerated by Hindu fundamentalists (Jeffery & Jeffery, Reference Jeffery and Jeffery2000, Reference Jeffery and Jeffery2002, Reference Jeffery and Jeffery2005; Bhagat & Praharaj, Reference Bhagat and Praharaj2005). Others have argued that if the current fertility rates among Hindus and Muslims in the Indian subcontinent continue, Muslims will outnumber Hindus by the year 2071 (Joshi et al., Reference Joshi, Srinivas and Bajaj2003).
Higher Muslim fertility has been attributed to their lower socioeconomic status (Weeks, Reference Weeks1988; Basu, Reference Basu1996; Mistry, Reference Mistry1999; Jeffery & Jeffery, Reference Jeffery and Jeffery2002), the lower socioeconomic status together with their minority status, insecurity caused by the constant threats from Hindu fundamentalists, a higher unmet need for family planning methods (Jeffery & Jeffery, Reference Jeffery and Jeffery2000, Reference Jeffery and Jeffery2002, Reference Jeffery and Jeffery2005; Bhagat & Praharaj, Reference Bhagat and Praharaj2005), a higher natural fertility rate among Muslims as a result of cultural practices affecting Hindu fertility and a delayed onset of fertility decline among Muslims due to their lower socioeconomic status (James & Nair, Reference James and Nair2005) and less widespread daughter aversion among Muslims (Borooah & Iyer, Reference Borooah and Iyer2005). Bhat (Reference Bhat2005) and Reddy (Reference Reddy2003) strongly criticized some of these explanations and hypotheses for not having sufficient empirical support and for studiously avoiding the role of religious attitudes and values as an explanation for the gap in fertility between Hindus and Muslims. They have further argued that a more pronatalist ideology, the influence of religious texts or the speeches of religious leaders favouring more children and opposing family planning methods among Muslims, also need to be considered, alongside other possible factors. In summary, to date there has been little consensus on the magnitude of the gap in fertility between Hindus and Muslims, and the causes of the higher fertility rate among Muslims (Reddy, Reference Reddy2003; Bhagat & Praharaj, Reference Bhagat and Praharaj2005; Bhat, Reference Bhat2005; Bhat & Zavier, Reference Bhat and Zavier2005; Borooah & Iyer, Reference Borooah and Iyer2005; Dharmalingam et al., Reference Dharmalingam, Navaneetham and Morgan2005; James & Nair, Reference James and Nair2005; Jeffery & Jeffery, Reference Jeffery and Jeffery2000, Reference Jeffery and Jeffery2005; Krishnaji & James, Reference Krishnaji and James2005).
Earlier studies on Hindu–Muslim fertility differentials have not led to a systematic understanding of this fertility gap. Common limitations include: 1) a lack of a regular data source on fertility levels for Hindus and Muslims; 2) problems in the available survey data and the instruments used to measure fertility; and 3) not taking a causal analysis approach when measuring the gap in fertility, and in interpreting the causes of the higher level of fertility among Muslims.
The Sample Registration System (SRS) (the main demographic data source for India, which provides fertility and mortality indicators on an annual basis) does not publish fertility levels by socioeconomic characteristics, i.e. religion; it just publishes fertility level by place of residence (rural and urban) and level of education of women for India as a whole and for its bigger states. As a result, demographers have to rely on occasionally conducted sample surveys to study fertility trends among Hindus and Muslims. Since the early 1990s, with the availability of detailed unit-level data in the form of the National Family Health Surveys (NFHSs), researchers have increasingly investigated fertility levels, trends and causes of higher fertility among Muslims (Reddy, Reference Reddy2003; Bhagat & Praharaj, Reference Bhagat and Praharaj2005; Bhat, Reference Bhat2005; Bhat & Zavier, Reference Bhat and Zavier2005; Borooah & Iyer, Reference Borooah and Iyer2005; Dharmalingam et al., Reference Dharmalingam, Navaneetham and Morgan2005; James & Nair, Reference James and Nair2005; Krishnaji & James, Reference Krishnaji and James2005).
However, existing knowledge on fertility levels, trends and differentials among Hindus and Muslims is dominated by a period approach to fertility change using the Total Fertility Rate (TFR) to measure fertility (quoted in Jeffery & Jeffery, Reference Jeffery and Jeffery2002). While TFR is the most pragmatic and widely used period fertility indicator (Ní Bhrolcháin, Reference Ní Bhrolcháin1992), it is sensitive to changes in the timing of childbearing in women (Bongaarts & Feeney, Reference Bongaarts and Feeney1998) and it is likely to give biased estimates. In the case of India, for example, there is clear evidence that the timing of childbearing in women is in transition as a result of increased use of sterilization over the past few decades (Pasupuleti et al., Reference Pasupuleti, Pathak and Chattopadhyay2012). Additionally, period fertility measures based on the NFHSs are problematic because of the misreporting of the date of birth of children (Spoorenberg, Reference Spoorenberg2010). It has been confirmed that NFHS interviewers have deliberately shifted the date of birth of a significant number of children born during the three years preceding the NFHSs (Retherford & Mishra, Reference Retherford and Mishra2001; Bhat, Reference Bhat1995) in order to reduce their workload by avoiding a block of subsequent questions related to the pre- and postnatal care received by mothers and the care received by children born after this cut-off date (Spoorenberg, Reference Spoorenberg2010). Retherford and Mishra (Reference Retherford and Mishra2001) concluded that the TFR for the three-year period preceding the survey cannot be computed accurately for India, resulting in considerable underestimation of total fertility. This may also result in biased estimates if the period fertility indicator is used to measure Hindu and Muslim fertility levels and the gap between them. For instance, let the actual period fertility levels (TFRs) for Hindus and Muslims be 2.6 and 3.3 respectively. The gap between them is then 0.7. Let us assume that 10% of all births among Hindus and Muslims were misplaced (shifted backwards in time to avoid asking additional questions) by interviewers. The observed gap in fertility between Muslims and Hindus would then be 3.3×0.9−2.6×0.9=0.7×0.9=0.63. This implies that displacement of births may result in an underestimation of the actual gap in fertility between Hindus and Muslims if the period approach is used.
While many earlier studies have estimated the gap in fertility between Hindus and Muslims (Bhagat & Praharaj, Reference Bhagat and Praharaj2005; Bhat & Zavier, Reference Bhat and Zavier2005; Borooah & Iyer, Reference Borooah and Iyer2005; Krishnaji & James, Reference Krishnaji and James2005), these might have produced biased estimates since they did not account for the possible mediating roles of various factors (such as women’s education level and work force participation status) in the relation between religion and fertility. For instance, the degree of importance given to women’s education and work force participation status may vary from one religion to another, and these in turn may influence fertility levels and other factors (such as women’s autonomy, standard of living, exposure to media, age at first marriage, age and educational differences between spouses and child mortality), which also influence fertility. An earlier study also argued that Muslims are more patriarchal than other religions to the extent that their demographic behaviour could be influenced by this (Caldwell, Reference Caldwell1986). Therefore, not taking these possibilities into account, and controlling various socioeconomic and demographic factors as if they are confounders, may produce biased estimates.
These limitations, together with the fact that cohort fertility indicators such as the Cohort Total Fertility Rate (CTFR) do not suffer from tempo effects or from the adjustment (shifting) of date of birth of children, have motivated this study to adopt a cohort approach. Apart from that, fertility decisions and outcomes are, in part, a cohort phenomenon for at least two important reasons. First, reproductive intentions, experiences and other related characteristics, such as contraceptive use and abortions, are subject to social influences that primarily occur within a cohort (Brooks & Bolzendahl, Reference Brooks and Bolzendahl2004; Stoker & Jennings, Reference Stoker and Jennings2008; Cowan, Reference Cowan2013). Second, individual fertility behaviour is influenced by other members of the cohort through shared socializing experiences within cohorts. Therefore, a detailed cohort fertility study, which refers to the actual fertility experience of women born in various calendar years or women ending their reproductive period in various calendar years, not only gives the true picture of fertility change but also captures changes in social and demographic behaviours better than do period rates (Ryder, Reference Ryder1965).
The present study is the first of its kind to focus on cohort fertility patterns among Hindus and Muslims in India. The study also investigates changes in the timing of childbearing over cohorts and explores the role of socioeconomic and demographic factors in the fertility gap between Hindu and Muslim women by adopting a causal analysis approach. Cohorts of women who became/will become 50 in the calendar years from 1993 to 2025 were considered for the study. These were the women who were born between 1943 and 1975, and who reached/will reach the age of 50 (if they are still alive) between 1993 and 2025. These women could be considered those who have ended, or will end, their reproductive period in the calendar years 1993 to 2025, assuming that giving birth after the age of 50 is rare. To facilitate the comparison of fertility trends and characteristics between Hindus and Muslims, the study makes use of the six-parameter special form of the Gompertz model proposed by Pasupuleti and Pathak (Reference Pasupuleti and Pathak2010a).
Conceptual framework
Religion can directly and/or indirectly influence fertility through various factors or ‘mediators’ (also called ‘path variables’ or ‘intermediate variables’). Some factors, known as confounders, which are not in the causal pathway, but could amplify or deplete the effect of religion on fertility due to their association with both religion and fertility. Figure 1 shows the conceptual framework and roles of various socioeconomic and demographic factors in the relationship between religion (being Hindu/being Muslim) and fertility. Causally, religion may have no influence on the calendar year in which a woman ends her reproductive period, caste, place of residence or region of residence. Nonetheless, these factors could be associated with both religion and fertility. For instance, Muslims live more in urban areas than Hindus. Hence, the factors shown in Box 1 of Fig. 1 may play the role of confounders in the relation between religion and fertility, so these will be referred to as ‘socio-demographic confounders’ in this study. Religion, however, may causally influence the position of women directly or indirectly by affecting the ideals of its followers in issues related to women’s education and employment. In turn, these factors may influence fertility and other characteristics, including women’s autonomy, standard of living, son preference, exposure to media, age and educational differences with spouse, and the number of child deaths experienced, which in turn influence fertility. Religion may even directly influence some of the above-mentioned factors, including son preference and exposure to media (these complex relations are not shown in Fig. 1). Hence, religion may directly or indirectly influence the various socioeconomic and demographic factors shown Box 2. The factors in Box 2, in turn, may influence fertility, thereby acting as mediators in the relation between religion and fertility, and are hence referred to as ‘socioeconomic and demographic mediators’ from here on.

Fig. 1 Conceptual framework of the study. Single-headed arrows denote causal relationships and show the direction of causality. The dashed line denotes a non-causal association. The variables in Box 1 are confounders in the relation between religion and fertility. Those in Boxes 2 and 3 are the mediators in the relation between religion and fertility. The effect of religion on fertility that is acting through variables in Boxes 2 and 3 is an indirect effect.
Religion may also influence pronatalist ideology or ideal number of children among its followers and hence part of the religious differentials in fertility might be due to differences in ideal number of children among women. This implies that ‘ideal number of children’ is a mediator in the relation between religion and fertility. The socioeconomic and demographic mediators in Box 2 could also influence ideal number of children, which in turn could influence fertility. This means that ideal number of children can also act as a mediator in the relation between socioeconomic and demographic mediators and fertility.
Data and Methods
Data
Data were from the three nationally representative National Family Health Surveys (NFHSs) conducted in India since the early 1990s. The first (NFHS-1) was conducted during 1992–1993, with a sample of 89,777 ever-married women aged 13–49 years. The second and third surveys (NFHS-2 and NFHS-3) were conducted during 1998–1999 and 2005–2006, with a sample of 90,303 ever-married women aged 15–49 years and 124,385 women aged 15–49 years, respectively. In all three surveys data were collected using a multi-stage cluster sampling approach. Further details about data collection and survey design are described elsewhere (IIPS, 1995; IIPS & ORC Macro, 2000; IIPS & Macro International, 2007). In all three surveys, a detailed maternity history was collected from each respondent woman, alongside demographic, socioeconomic and health-related information.
Based on the age of respondent women in the three NFHS surveys, their year of birth and the year in which they ended/will end their reproductive period (i.e. become 50) could be found. Using this information, cohorts of women who ended/will end their reproductive period in the calendar years from 1993 to 2025 could be identified, as shown in Table 1. In many cases, two to three different age group women from different NFHSs represent the same cohort of women who ended their reproductive period in a particular calendar year. As an example, women in NFHS-1 aged 31 years on 1st January 1992, women in NFHS-2 aged 37 years on 1st January 1998 and women in NFHS-3 aged 44 years on 1st January 2005 refer to survivors of the 1960 birth cohort (survivors at the time of survey) who would end their reproductive period in the calendar year 2010, provided they survive until age 50.
Table 1 Formation of cohorts of women from the NFHS-1, NFHS-2 and NFHS-3 surveys

a Age on 1st January of the year of start of the corresponding NFHS survey, provided they are covered in that NFHS round.
b Blank cells indicate no coverage of cohort in the NFHS round.
c The ‘1993 cohort’ refers to the cohort ending their reproductive period in the calendar year 1993. The same convention is used for other cohorts.
d Year they become aged 50, provided they survive.
Since NFHS-1 and NFHS-2 only collected data on ever-married women, to be consistent never-married women in NFHS-3 were omitted from this study. Overall, the study used data from 189,250 ever-married women (165,227 Hindus and 24,023 Muslims) who have ended/will end their reproductive period in the calendar years from 1993 to 2025. Before proceeding to the analysis, the maternity histories of all these women were right-censored at 1st January (the base-line time point) of the year of start of the survey in which they responded, in order to maintain uniformity in the comparison of fertility among different cohorts of women.
As can be seen from Table 1, information on maternity history is available for different durations of ages from different NFHSs for most of the considered cohorts in this study. The study made use of most of the available information on the maternity history of the considered cohorts. For instance, for a cohort that will end their reproductive period in the calendar year 2010, ASFRs up to age 30 years were calculated based on maternity history data available for this cohort from all three NFHSs, whereas ASFRs at ages 31–36 years were calculated based on maternity history data available from NFHS-2 and -3, while ASFRs at ages 37–43 years were calculated based on maternity history data available from NFHS-3.
Methods
A six-parameter special form of the Gompertz model (henceforth S-P model), proposed by Pasupuleti and Pathak (Reference Pasupuleti and Pathak2010a), was used to model simultaneously the fertility schedules of several cohorts of Hindu and Muslim women who ended/will end their reproductive period in the calendar years from 1993 to 2025. Pasupuleti and Pathak (Reference Pasupuleti and Pathak2010a) showed that the S-P model fits well to the cohort fertility schedules of Indian women. Using the S-P model has many benefits, including: (i) providing an alternative to data on several cohorts of women in describing their fertility patterns; (ii) summarizing and storing important information in the form of model parameters that have a clear demographic interpretation and throw light on various important characteristics of fertility; (iii) the easy derivation of other characteristics of fertility, such as ‘age of peak fertility’ and ‘effective fertility period’ (Pasupuleti & Pathak, Reference Pasupuleti and Pathak2010b), i.e. the age interval during which the fertility level of a cohort rises from 5% to 95% of the CTFR. In other words, the age interval around the median age of fertility during which 90% of the total births occur for a considered cohort; and (iv) the projection of incomplete maternity histories of several cohorts.
The functional form of the S-P model is as follows.
 $$G(t,T){\equals}(F_{1} {\plus}F_{2} T_{1} )\left( {{1 \over 2}} \right)^{\!\!\!{\left( {{{\log (0.95)} \over {\log (0.05)}}} \right)^{\!\!{\left( {{{t{\minus}(a_{1} {\plus}a_{2} T_{1} )} \over {b_{1} {\plus}b_{2} T_{1} }}} \right)}} }} $$
where, T 1=T−1993 and T=1993, 1994, 1995 … 2015. Here, t is the age and T is the calendar year in which a cohort ends its reproductive period; G(t, T) is the cumulative Age-Specific Fertility Rate (ASFR) up to the exact age t for a cohort of women ending their reproductive period in the calendar year T; parameter F 1 is the CTFR for the 1993 cohort. [Note that marriage is universal for women in India with more than 98% of women marrying by the age of 30 (IIPS, 1995; IIPS & Macro International, 2000, 2007). As the focus of this study is on completed fertility rates, marital CTFR and CTFR (i.e. combining married and unmarried woman) are the same (or extremely close) in the case of India for the above-mentioned reason. Therefore, in this study marital CTFR is simply referred to as CTFR.] Parameter F 2 is the rate at which the CTFR is changing (or expected to change) over cohorts in between the 1993 and 2025 cohorts; the parameter a 1 is the ‘median age of fertility’ for the 1993 cohort; parameter a 2 is the rate at which median age of fertility is changing (or expected to change) over cohorts between the 1993 and 2025 cohorts; parameter b 1 is the length of the effective fertility period for the 1993 cohort; parameter b 2 is the rate at which the length of the effective fertility period is changing (or expected to change) over cohorts between the 1993 and 2025 cohorts. Here, (F 1+F 2 T 1), (a 1+a 2 T) and (b 1+b 2 T 1) and are CTFR, median age of fertility and length of effective fertility period, respectively, for a cohort of women who end their reproductive period in the calendar year T.
Other characteristics of fertility, such as ‘effective fertility period’ and ‘age of peak fertility’, for a cohort of women who end their reproductive period in the calendar year T, can be estimated using the following formulae (note that the constants in Eqns (2) and (3) were obtained by simplifying the corresponding expressions in the S-P model; Pasupuleti & Pathak, Reference Pasupuleti and Pathak2010a).
 $$\hskip-7.8pc{\rm Effective}\,{\rm fertility}\,{\rm period}\,{\rm {\equals}}\,\left( {A,B} \right)$$
where,
 $$\eqalignno{ & A\,{\equals}\,(a_{1} {\plus}a_{2} T_{1} ){\rm \,{\minus}\,0}{\rm .35986}\,(b_{1} {\plus}b_{2} T_{1} ) \cr & B\,{\equals}\,(a_{1} {\plus}a_{2} T_{1} ){\plus}{\rm 0}{\rm .640137}\,(b_{1} {\plus}b_{2} T_{1} ) \cr & {\rm Age}\,{\rm of}\,{\rm peak}\,{\rm fertility}\,{\rm {\equals}}\,(a_{1} {\plus}a_{2} T_{1} ){\rm\, {\minus}\,0}{\rm .29516}\,(b_{1} {\plus}b_{2} T_{1} ) $$
The S-P model was built on the assumption that each of the three characteristics of fertility, i.e. CTFR, median age of fertility and length of effective fertility period, is changing linearly (increasing or decreasing or remaining constant) over cohorts. Hence, this assumption needs to be validated before using the model to study cohort fertility patterns among Hindus and Muslims.
Following the above analysis, the study proceeded step-by-step considering the conceptual framework in Fig. 1 and using linear regression models to better understand the fertility gap between Hindus and Muslims. Data on cohorts of Hindu and Muslim women who ended their reproductive period in the various calendar years from 1993 to 2012 were used for regression analysis. For each cohort, maternity history was available at least up to the exact age of 42 years. The number of children borne by the exact age of 42 years was the outcome (dependent) variable, and religion was the main exposure (explanatory) variable in the regression analysis. Other explanatory variables in the regression analysis (considered either as confounders or as mediators) are shown in Table 4 alongside their categories, if any.
As mentioned in the conceptual framework section, religion can directly and/or indirectly influence fertility, i.e. a part of the effect of religion on fertility is direct and the rest is indirect (i.e. through mediators in the relation between religion and fertility). The sum of these direct and indirect effects of religion on fertility is called the ‘total effect of religion on fertility’. It is possible that this can be obscured (depleted/elevated) by other factors (confounders) that are not in the casual pathway between religion and fertility but which have an association with both. So, for a systematic exploration of the effect of religion on fertility five linear regression models were used step-by-step in the following sequence. In the first step, i.e. Model I, religion is the only explanatory variable. Model II adds socio-demographic confounders, namely the calendar year in which a woman ends her reproductive period, caste, place of residence and region of residence. To these, Model III adds socioeconomic and demographic mediators such as level of education, standard of living, exposure to media, son preference, work status, age gap with spouse and education gap with spouse. Model IV adds the number of child deaths experienced and the age at marriage. Model V adds the ideal number of children.
Model I is the crude model or a model in which the estimate of the effect of religion on fertility suffers from a confounding bias, and Model II is the refined model or a model in which this estimate is free from confounding bias (Rothman & Greenland, Reference Rothman and Greenland1998; Aschengrau & Seage, Reference Aschengrau and Seage2008; Weisberg, Reference Weisberg2010), assuming that the considered factors (caste, region, place of residence and the calendar year in which a woman ends her reproductive period) are the only confounders in the relation between religion and fertility. Of the remaining three models, Model IV (to know what extent the fertility gap is due to differences in their socioeconomic and demographic factors; see Box 2 of Fig. 1) and Model V (to know what extent the fertility gap is due to differences in their pronatalist ideology) are the main focus of this study. Model III was used so as to allow the authors to test additionally two hypotheses: (1) whether differences in age at marriage between Hindus and Muslims can explain the difference in their fertility level; and (2) whether differences in the number of child deaths experienced by Hindus and Muslims can explain the difference in their fertility level particularly after adjusting for socioeconomic and some demographic factors that are included in Model III.
The entire data analysis was carried out using SAS Version 9.3. The NLIN procedure was used to fit the S-P model, and the GLIMMIX procedure was used for regression analysis. While using the GLIMMIX procedure the ‘Empirical=HC3’ option was used to obtain heteroscedasticity-consistent parameter estimates (SAS Institute, 2005).
Results
Trends in the age pattern of fertility by cohort and religion
Figure 2 shows the trends in the Age-Specific Fertility Rate (ASFR) in the cohorts of Hindu (Fig. 2A) and Muslim (Fig. 2B) women who end their reproductive period in the calendar years 1994, 2004, 2014 and 2024. This is an effort to cover all the cohorts of women who end their reproductive period in the various calendar years from 1993 to 2025. The purpose of this figure is to explore the changes in the age pattern of fertility among Hindus and Muslims by cohort, and also in their fertility characteristics such as the level of fertility, median age of fertility and length of effective fertility period. It is clear that the decline in the ASFR over the cohorts is small below the age 19 and above the age 43 years, but larger between the ages of 24 and 38 years for both Hindus and Muslims. This in turn results in a decline in Cohort Total Fertility Level (CTFR), length of the effective fertility period, median age of fertility and age of peak fertility over cohorts in both Hindus and Muslims. Another interesting feature apparent from Fig. 2 is the decline in fertility over cohorts in the age of peak fertility for Hindus but not for Muslims.
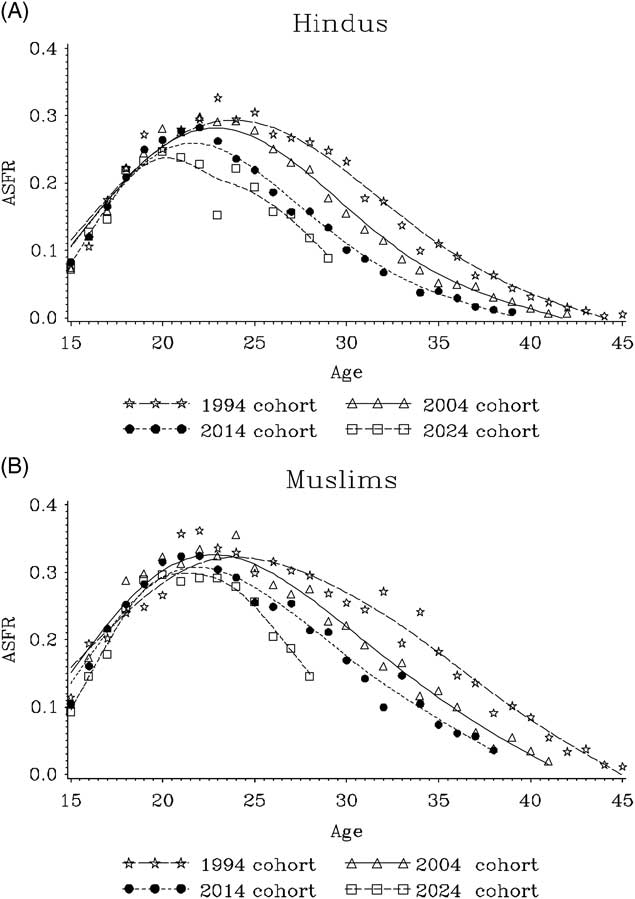
Fig. 2 Changes in Age-Specific Fertility Rates (ASFRs) for different cohorts for Hindus (A) and Muslims (B). Smoothed lines have been fitted to the data using a cubic spline to identify general trends in the data. For Muslims, in order to reduce fluctuations in ASFRs caused by smaller sample sizes, the ASFRs were calculated using three-year moving averages (for example, ASFR at age 20 for the 2004 cohort is the average of the ASFRs at age 20 for the 2003, 2004 and 2005 cohorts).
Figure 3 compares the age pattern of fertility for Hindu and Muslim women within each cohort, for Hindu and Muslim women who ended/will end their reproductive period in the years 1994, 2004, 2014 and 2024. The clear message from this is that Muslim women of each cohort have higher levels of fertility at each age than their counterpart Hindu women. This clearly implies Muslims have higher fertility (CTFR) than their counterpart Hindus.

Fig. 3 Comparison of Age-Specific Fertility Rates (ASFRs) among Hindus and Muslims by cohort. Smoothed lines have been fitted to the data using a cubic spline to identify general trends in the data. For Muslims, in order to reduce fluctuations in ASFRs caused by smaller sample size, the ASFRs were calculated using three-year moving averages (for example, ASFR at age 20 for the 2004 cohort is average of ASFRs at age 20 for the 2003, 2004 and 2005 cohorts).
Validation of the assumption in the S-P model
There are two different approaches to validating whether the assumption in the S-P model (that the CTFR, median age of fertility and length of effective fertility period change linearly over cohorts) holds true for Hindus and Muslims. The first approach is to fit the S-P model separately to the cohort fertility schedules of Hindu and Muslim women, and verify whether the S-P model fit is good for each and every cohort of Hindu and Muslim women who end their reproductive period in the various calendar years from 1993 to 2025. A good fit of the S-P model to all cohorts suggests that the assumption in the S-P model holds true for Hindus and Muslims. The second approach is to verify whether the CTFR, median age of fertility and length of effective fertility period are changing linearly over cohorts, for Hindus and Muslims, after fitting the special form of the Gompertz model proposed by Pasupuleti and Pathak (Reference Pasupuleti and Pathak2010b) to the different cohorts. However, this approach is appropriate only for those cohorts for which information is available up to at least 42 years of age (i.e. for cohorts who end their reproductive period in the various calendar years from 1993 to 2012 only), as a stretched S-shape in the empirical cumulative fertility curve is fairly visible for these women cohorts. Both the above-mentioned approaches were followed to validate the assumption in the S-P model for Hindus and Muslims.
Figure 4 shows the fit of the S-P model, fitted separately to the cohort fertility schedules of Hindu and Muslim women. For better clarity, and to cover all the cohorts considered in the study, the fits of the S-P model to the 1994, 2004, 2014 and 2024 cohorts are only shown for Hindus (Fig. 4A–D) and Muslims (Fig. 4E–H). The fit statistics of the S-P model (not shown) and the graphs in Fig. 4 suggest that the S-P model fits well to the cohort fertility schedules of Hindu and Muslim women, and that the assumption in the S-P model is valid both for Hindus and Muslims.
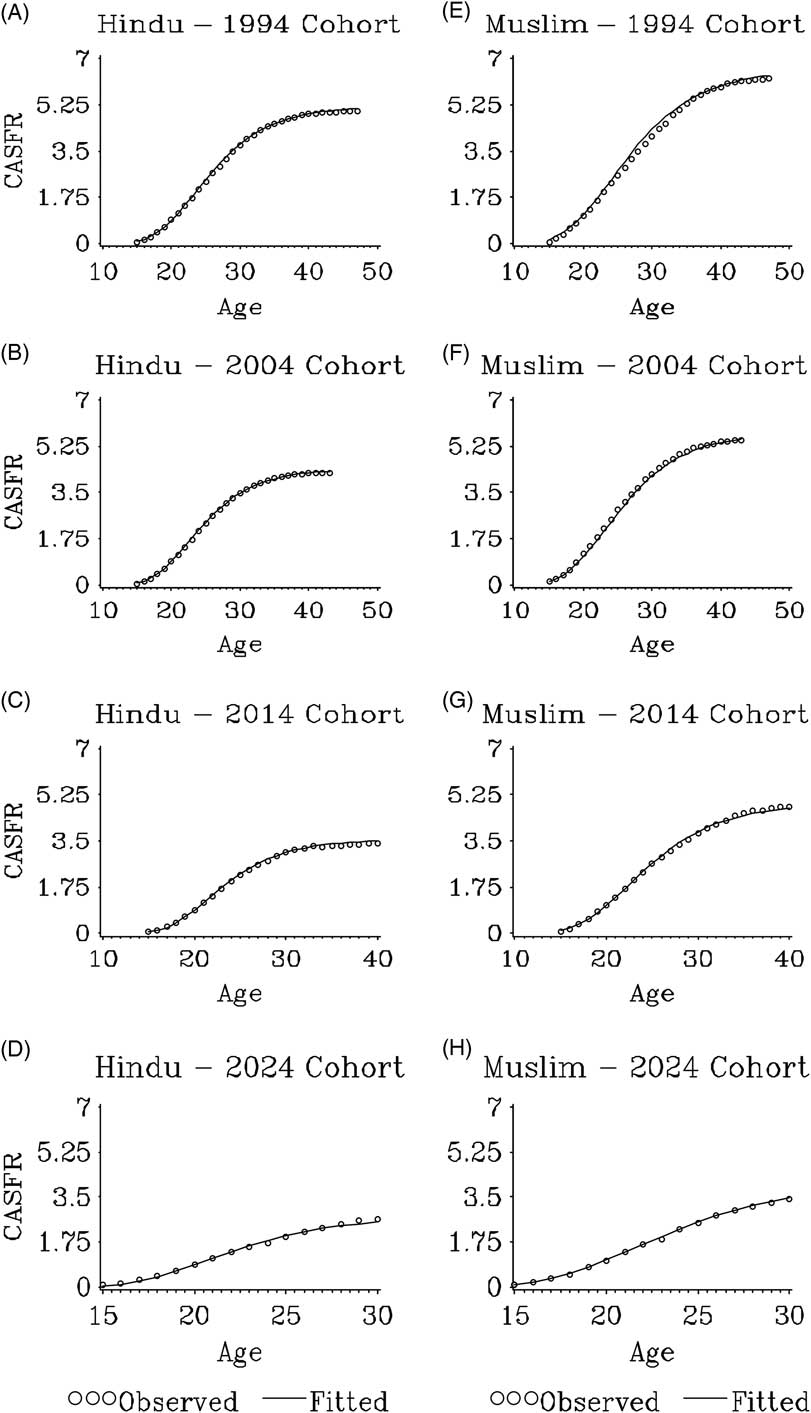
Fig. 4 Fit of the S-P model to the fertility schedules of Hindu and Muslim women who ended/will end their reproductive period in 1994, 2004, 2014 and 2024, by cohort. CASFR denotes the Cumulative Age-Specific Fertility Rate.
Figure 5 shows the trends in the CTFR (Fig. 5A), median age of fertility (Fig. 5B) and the length of effective fertility period (Fig. 5C) over cohorts for Hindus and Muslims. These parameters were obtained by fitting the three-parameter special form of the Gompertz model to the individual Hindu and Muslim women cohorts who ended their reproductive period in the calendar years from 1993 to 2012. As can be seen from this figure, the assumptions in the S-P model are valid both for Hindus and Muslims. Therefore, changes in fertility characteristics over cohorts among Hindus and Muslims were investigated using the S-P model.
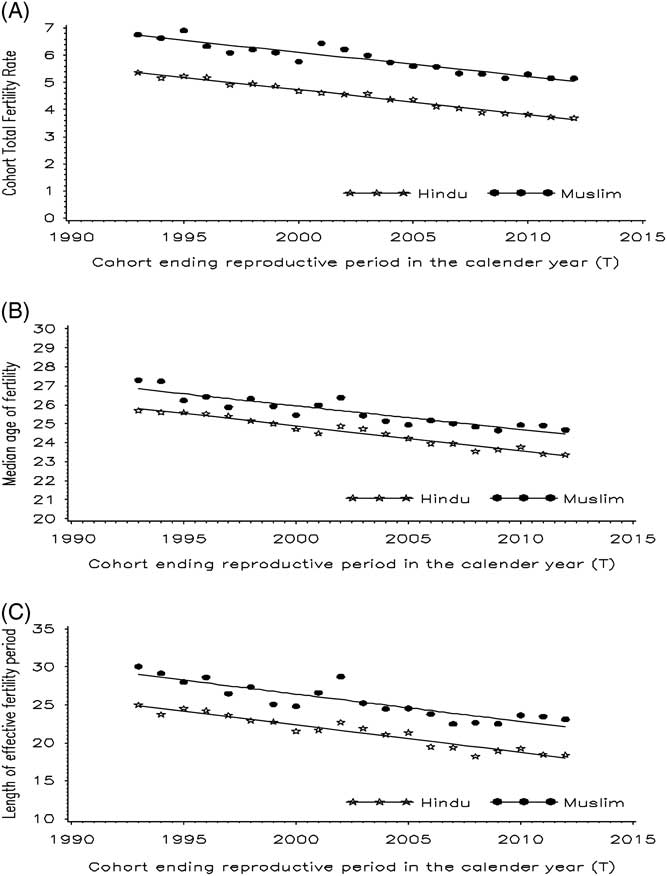
Fig. 5 Trends in CTFR (F), median age of fertility (a) and length of effective fertility period (b) over cohorts (T) among Hindus and Muslims. These parameters were obtained by fitting the three-parameter special form of the Gompertz model to each cohort. Smoothed lines have been fitted to the data using a cubic spline to identify general trends in the data.
Changes in cohort fertility characteristics by religion
The parameter estimates of the S-P model, fitted separately to the fertility schedules of cohorts of Hindu and Muslim women, are given in Table 2. Their fertility characteristics are presented in Table 3. There is a clear differential in CTFR between Hindu and Muslim women. The CTFR for Muslim women who ended their reproductive period in the year 1993 (i.e. for the 1993 cohort) is 6.69, while this is 5.29 for Hindu women. Therefore, a gap of 1.40 children per woman is found between Muslim and the Hindu women for the 1993 cohort. The rate of fertility decline between the 1993 and 2025 cohorts (i.e. the cohort of women who will end their reproductive period in the calendar year 2025) is more or less the same for Hindus (0.082) and Muslims (0.084). The CTFR for Muslim women who will end their reproductive period in 2025 is expected to be 4.01, while this is 2.67 for Hindu women (Table 3). Since fertility decline over cohorts is linear, with the same rate of fertility decline among Hindus and Muslims, the relative differential in fertility between Hindus and Muslims is increasing over the considered cohorts. For instance, Muslim fertility is 26.5% higher than Hindu fertility for the 1993 cohort, and is projected to increase to 50.4% by the 2025 cohort.
Table 2 Parameter estimates of the S-P model, fitted to the fertility schedules of cohorts of Hindu and Muslim women who end their reproductive period in the calendar years from 1993 to 2025

F 1 is the CTFR for the cohort who have ended their reproductive period in the calendar year 1993 (the 1993 cohort).
F 2 is the rate at which CTFR is changing/expected to change over cohorts between the 1993 cohort and the cohort of women who will end their reproductive period in the calendar year 2025 (the 2025 cohort).
a 1 is the median age of fertility for the 1993 cohort.
a 2 is the rate at which median age of fertility is changing (or expected to change) over cohorts between the 1993 cohort and the 2025 cohorts.
b 1 is the length of the effective fertility period for the 1993 cohort.
b 2 is the rate at which the length of the effective fertility period is changing (or expected to change) over cohorts between the 1993 cohort and the 2025 cohort.
Table 3 Changes in cohort fertility characteristics for Hindu and Muslim womenFootnote a

a All calculations were done using the formulae in the Data and Methods section, with T 1 being zero for the 1993 cohort and 32 (=2025−1993) for the 2025 cohort.
b The 1993 cohort included women who ended their reproductive period in the calendar year 1993.
c The 2025 cohort included women who will end their reproductive period in the calendar year 2025.
d The age interval during which the fertility level of a cohort rises from 5% to 95% of the CTFR.
The effective fertility period (age interval in years during which the fertility level of a cohort rises from 5% to 95% of CTFR) varies between Hindus and Muslims, decreasing over cohorts in both groups. Muslim women in the 1993 cohort have an effective fertility period of (16.49, 44.88) years, meaning that on average 5% of their total births (i.e. 0.33 births out of a total of 6.69) occurred by the age of 16.49 years and 95% of the total births by the age of 44.88 years. Hence, 90% of the total births (i.e. 6.02 births) occurred between 16.49 and 44.88 years of age. The effective fertility period for Muslim women in the 2025 cohort is expected to be (16.23, 35.43) years. Corresponding changes in effective fertility period for Hindu women are from (16.99, 41.09) years for the 1993 cohort to (16.39, 31.66) years for the 2025 cohort. This shows that Muslim women have a longer effective fertility period than Hindu women. Interestingly, the length of effective fertility period is expected to decrease by about 9 years among Hindu and Muslim women between the 1993 and 2025 cohorts.
For Muslim women the median age of fertility is about 1.0 years higher than that for Hindu women for the 1993 cohort; and it is expected to decrease from 26.7 to 23.1 years between the 1993 and 2025 cohorts. For Hindu women, the median age of fertility is expected to decrease by 3.8 years between the 1993 and 2025 cohorts (i.e. from 25.7 years to 21.9 years). The age of peak fertility, i.e. the age when the fertility level is highest within a cohort, is also found to vary between Hindu and Muslim women. For women in the 1993 cohort, the age of peak fertility is 24.2 years for Muslims and 23.5 years for Hindus. Between the 1993 and 2025 cohorts, the age of peak fertility is expected to decrease by about 2.7 years for Muslims and 3.0 years for Hindus.
Results of the regression analysis
It is acknowledged that the differentials in fertility level between Hindu and Muslim women seen in the earlier analysis might be because of the influence of various socioeconomic and demographic characteristics. Hence, regression models have been used to determine the confounding or mediating role of the various socioeconomic and demographic factors in the fertility difference between the two groups. The results are shown in Table 4. Model I indicates that overall (i.e. combining all considered cohorts of women who ended their reproductive period in the various calendar years from 1993 to 2012) the average number of children born by the exact age of 42 years was higher among Muslim women than among Hindu women by about 1.17 (95% confidence interval (CI) 1.08–1.26) children per woman. After controlling for suspected socio-demographic confounders, namely the calendar year in which a woman ends her reproductive period, caste, place of residence and region of residence, the gap in fertility between Muslim and Hindu woman increased to 1.43 (CI 1.34–1.52) children per woman (Model II). Indeed, this is the real gap between Muslim and Hindu women that was masked by the above-mentioned socio-demographic confounders and explanation is needed for this gap. In Model III, level of education, exposure to media, son preference, work status, age gap with spouse and education gap with spouse were controlled in the regression model. After controlling for these mediators, the difference in average number of children between Muslim and Hindu women has reduced to 1.03 (CI 0.94–1.13). This essentially means that these socioeconomic and demographic mediators are accounting for 27.7% of the true gap in the average number of children between Muslim and Hindu women. Adjusting further for age at marriage did not cause any change in the effect of being Muslim (result not shown in Table 4), but additionally adjusting for the number of child deaths experienced (Model IV) resulted in further decline in the fertility gap to 0.98 (CI 0.90–1.07) children per woman, indicating that this factor explains an additional 3.5% of the actual gap in fertility between Muslims and Hindus. As a result, on the whole, the socioeconomic and demographic mediators or factors considered in this study accounted for 31.2% of the actual gap in fertility between Muslims and Hindus. Adjusting then for ideal number of children (Model V) reduced the gap in average number of children between Hindu and Muslim to 0.72 (CI 0.64–0.81) children per woman. This clearly indicates that a significant part of the difference in fertility between Hindu and Muslim women (18.2%) is because of the difference in ideal number of children between Hindus and Muslims.
Table 4 Results of the linear regression analysis

Model I has religion as the sole explanatory variable. Model II adds the cohort effect, caste, place of residence and region of residence. Model III adds level of education, standard of living, work status, age gap with spouse, education gap with spouse, exposure to media and son preference. Model IV adds age at marriage and number of child deaths experienced per woman. Model V adds ideal number of children.
a The study uses the same regional classification as NFHS-3 (IPS & Macro International, 2007).
Ref., reference group; CI, confidence interval.
*p<0.05; **p<0.01.
Discussion
This study investigated cohort fertility patterns among Hindus and Muslims in India, and the causes of higher fertility among Muslims, by considering cohorts of women who ended/will end their reproductive period in the various calendar years from 1993 to 2025, and adopting a causal analysis framework. This is the first study to focus on cohort fertility patterns among Hindus and Muslims in India.
A gap of 1.4 children per woman (CTFR) between Muslim (6.7) and Hindu women (5.3) was found for the 1993 cohort. A decrease of about 2.6 (children per woman) for Hindus and Muslims would be expected between the 1993 and 2025 cohorts as a result of the similar pace of fertility decline for both groups. Hence, on average, Muslim women have 1.37 extra children per woman than their counterpart Hindu women between the above-mentioned cohorts. Over the considered cohorts, the age of peak fertility and median age of fertility were about 0.7 years and 1 year higher, respectively, for Muslim women than for Hindu women. Similarly, Muslim women give birth over a longer age interval (roughly 4 more years) than Hindu women, and this longer interval declined over the considered cohorts. Between the 1993 and 2025 cohorts, the length of the effective fertility period is predicted to decline by about 9 years in both Hindus and Muslims. The socioeconomic and demographic characteristics of Muslims were found to account for 31.2% of the gap in fertility between Muslims and Hindus (Model IV, Table 4), while a desire for more children among Muslims (indicative of an extra effect of being Muslim) explains an additional 18.2% of the gap in fertility between the two groups (Model V, Table 4).
Since earlier studies found a gap in fertility between Muslims and Hindus of about 15% in pre-independence India (Davis, Reference Davis1946; Visaria, Reference Visaria1974), and the present study found a gap of more than 25% (26.5% for the 1993 cohort), and projected that the gap will increase to 50.4% by the year 2025 as a result of similar rates of fertility decline among Hindus and Muslims, over the considered cohorts (post-independence India), this indicates an additional increase in the fertility gap between Muslims and Hindus by more than 10% (indeed 10% to 35%), following the independence of the country in 1947. This finding is consistent with the finding of Bhat and Zavier (Reference Bhat and Zavier2005), who showed that Muslim fertility is higher than that of Hindus by about 25–30% for women cohorts who ended their reproductive period during the 1990s.
A relatively lower incidence of contraceptive acceptance among Muslims compared with Hindus in the first two decades of India’s family planning programme, which was initiated in 1952, might have widened the gap in fertility (to about 1.4 children per woman) and the gap in contraceptive prevalence between Muslims and Hindus. However, the similar incidence of contraceptive acceptance among Muslims and Hindus in the subsequent decades of India’s FPP (Operations Research Group, 1971, 1983, 1990), during which the cohorts in this study had mostly experienced their reproductive years, may have caused the similar pace of fertility decline and the persistence of a fertility gap of about 1.37 children per woman between Muslims and Hindus. The increased usage of contraceptive methods (particularly tubal sterilization) from older to current cohorts, together with a lowering of the age at which contraception is adopted (Pasupuleti et al., Reference Pasupuleti, Pathak and Chattopadhyay2012), is very likely to be behind the decrease in CTFR, median age of fertility and age of peak fertility, and the shrinkage in the effective fertility period over the considered cohorts. Some of the findings in this study, such as the shrinking of the effective fertility period, would not have been possible without the usage of detailed maternity histories.
Some people in India are of the opinion that one day the Muslim population will outnumber the current Hindu majority because of the higher fertility of Muslims and their slower rate of fertility decline (mentioned in Jeffery & Jeffery (Reference Jeffery and Jeffery2002) and Shariff (Reference Shariff1995)). However, the present study found fertility fall to be very similar among Muslim and Hindu women. If the cohort fertility trends among Hindus and Muslims observed in this study continue into the future, this study projects Muslim woman will require an additional 16 years than Hindu women to reach replacement level fertility of 2.1 children per women. Other demographers argue that there is no reason to believe that fertility transition will stall, once it is started (James & Nair, Reference James and Nair2005). Bhat and Zavier (Reference Bhat and Zavier2005) also noted that the proportion of Muslims in India may at most rise to 20% of the population, before the population stabilizes.
The finding in this study of a large fertility differential between Hindus and Muslims supports that of many earlier studies conducted in India (Balasubramanian, Reference Balasubramanian1984; Reddy, Reference Reddy2003; Bhat & Zavier, Reference Bhat and Zavier2005; Dharmalingam et al., Reference Dharmalingam, Navaneetham and Morgan2005). The socioeconomic and demographic characteristics of Muslims were found to account for 31.2% of the gap in fertility between Hindus and Muslims, in line with the findings of Bhat and Zavier (Reference Bhat and Zavier2005), based on their analysis of NFHS-2 data. This means that the ‘characteristics hypothesis’, which proposes it is not religion but the socioeconomic conditions of the members of religious group that matter in their reproductive behaviour (Chamie, Reference Chamie1977), explains 31.2% of the fertility difference between Muslims and Hindus in India.
There is an argument that the lower age at marriage among Muslim women in comparison to Hindu women may be one of the reasons for their higher level of fertility (James & Nair, Reference James and Nair2005). However, this study did not find any support for this argument. Similarly, it found the number of child deaths experienced by a woman explains less than 4% of the actual gap in fertility between Hindus and Muslims. In an effort to identify the role of pronatalist ideology in the fertility gap between Hindus and Muslims (Reddy, Reference Reddy2003), this study controlled for the ideal number of children in the regression model (Model V in Table 4) and found that the gap in fertility between Hindus and Muslims decreased by 0.26 children per woman. This means that the desire for relatively more children among Muslim women (IIPS & ORC Macro, 2000) explains 18.2% of the overall difference in fertility between Hindu and Muslim women, or about one-quarter of the gap in fertility that was not accounted for by socioeconomic and demographic factors. This finding provides support for the argument of Reddy (Reference Reddy2003), that Muslims prefer to have more children than Hindus; hence they have a lower level of usage of contraceptives and hence their fertility is higher. This finding also may suggest that, even with the same socioeconomic and demographic status, Muslim women do wish to have more children than Hindu women, and this explains 18.2% of the overall gap in fertility. It is thus interesting to probe why Muslim women in India desire more children than Hindu women. It may be that religion itself plays a role. For instance, value attached to children may be more among Muslims than among Hindus. Or else, some other factors might be playing a role. This study’s authors sincerely feel and recommend a separate and detailed effort to probe why Muslim women in India desire more children than Hindu women, considering various possible factors, which includes religion itself.
For the remaining 50.6% of the gap in fertility between Muslims and Hindus that was not accounted for by the considered socioeconomic, demographic and pronatalist ideology factors, an explanation is sought from other possible angles, including the degree of autonomy of women, duration of breast-feeding, religiosity, differences in the usage of contraceptives, unmet need for family planning methods, religious injunctions against the usage of family planning methods, interpretation of religious texts by clergy, local conditions, cultural practices, the minority status of Indian Muslims, together with insecurity among Muslims caused by the frequent communal conflicts in India. Information on autonomy was not collected in NFHS-1 and was therefore not included in this analysis. However, since there is only a small difference in the level of autonomy between Hindus and Muslims in India, this may not explain a significant gap in fertility (Bhat & Zavier, Reference Bhat and Zavier2005). Earlier studies have found that duration of breast-feeding and postpartum abstinence does not vary much between Hindus and Muslims (Moulasha & Rao, Reference Moulasha and Rao1999; IIPS & ORC Macro, 2000); hence these are unlikely to play a role in the fertility gap (Bhagat & Praharaj, Reference Bhagat and Praharaj2005). Studies conducted around the world have showed that people who are more religious in nature are likely to have a higher level of fertility than those who are less religious or have no religion (Ongaro, Reference Ongaro2001; Pfeiffer & Nowak, Reference Pfeiffer and Nowak2001; Adsera, Reference Adsera2006; Westoff & Frejka, Reference Westoff and Frejka2007; Frejka & Westoff, Reference Frejka and Westoff2008; Zhang, Reference Zhang2008). Unfortunately, the NFHSs have not collected data on the religiosity of individuals, so this could not be included in the analysis. To the best of the authors’ knowledge there is no source of data that provides nationally representative information on the religiosity of individuals belonging to various religious groups in India.
A part of the gap in fertility between Hindus and Muslims may be due to differences in the usage of contraceptive methods. Since most of the women in this study had either ended, or were about to end, their reproductive period, simple measures like current use/ever usage of contraceptive method(s) were not good measures to probe their effect on the fertility gap between Hindus and Muslims. A measure like ‘fertile reproductive years lost due to usage of contraceptives’ would be a valid measure of this, but information on this is not available in the NFHSs. Although information on the timing of sterilization is available, there is evidence that Muslims in India use more temporary contraceptive methods than Hindus and no information is available on the timing and the duration of usage of these in the NFHSs. Therefore, the role of differences in the usage of contraceptive methods in the fertility gap between Hindus and Muslims was not investigated in this study.
A portion of the gap in fertility between Hindus and Muslims might have resulted from a greater aversion of Muslim women to use family planning methods as they perceive them to be against their religion. For instance, about 12.5% of Muslim women as against 0.2% of Hindu women who responded in the NFHS-2, and who were not using any family planning methods at the time of the survey, reported that they were not using family planning methods because it was against their religion (IIPS & ORC Macro, 2000). Researchers have shown that unmet need for family planning is greater among Muslims than among Hindus in India (Bhagat & Praharaj, Reference Bhagat and Praharaj2005), which indicates that part of the gap in fertility between Hindus and Muslims may be because of a higher level of unmet need for family planning methods among Muslims during their reproductive years.
It may look a bit puzzling that, on the one hand, there is evidence for a relatively higher percentage of Muslim women who do not use any family planning method on religious grounds, and on the other hand that there is evidence for a relatively higher unmet need for family planning among Muslims than among Hindus. However, it is quite possible that both these factors co-exist in causing higher fertility among Muslims. For instance, those Muslim women who wish to have birth spacing or who wish to terminate their fertility may not actually use a contraceptive method anticipating opposition or mistreatment from other members of the community who are averse to the use of family planning on religious grounds. The same argument may even hold for Hindus. However, due to the fact that the percentage averse to the use contraceptives on religious grounds is higher among Muslims than among Hindus, the above-mentioned possibility, if it holds true, would cause a higher level of unmet need for family planning among Muslims than among Hindus. Other explanations are also possible. For instance, based on their research in rural areas of Bijnor District in Uttar Pradesh, Jeffery and Jeffery (Reference Jeffery and Jeffery2002) argued that Muslim women’s mistrust of government family planning programmes and the heavy focus and persuasion on terminal methods in the family planning clinics, to which Muslims are generally averse, might have demotivated Muslim women from visiting family planning clinics for contraceptives. They also argued that the perception of mistreatment in the family planning clinics, which are usually dominated by well-educated urban Hindu staff, for their repeated pregnancies may also discourage Muslim women from visiting the clinics, despite their need or wish to use temporary contraceptive methods. However, all these explanations need to be validated with a nationally representative dataset, and the actual reasons for the higher unmet need for family planning among Muslims have to be explored by future studies, given the important policy implications associated with it.
Differences in socio-political circumstances, i.e. minority status and insecurity among Muslims due to the frequent communal conflicts in India (Jeffery & Jeffery, Reference Jeffery and Jeffery2000, Reference Jeffery and Jeffery2002, Reference Jeffery and Jeffery2005; Bhagat & Praharaj, Reference Bhagat and Praharaj2005; Dharmalingam et al., Reference Dharmalingam, Navaneetham and Morgan2005), might also play a role in the fertility gap between Hindus and Muslims. Thus, overall, a host of socio-political, psychological and environmental factors might be acting together to cause about 50% of the gap.
While the study provided estimates for Hindu–Muslim fertility differentials and provided an explanation for half of the gap in fertility using a cohort approach, the analyses are not without their limitations. First, the cross-sectional nature of the study means that some characteristics, like standard of living, exposure to media, son preference, work status, number of child deaths experienced and ideal number of children, which are likely to vary over women’s reproductive period, were only measured at the time of survey. Since the majority of the women in the study had ended, or were near the end of, their reproductive period at the time of survey, their characteristics at the time of survey may not be a perfect representative to their characteristics when they were passing through their reproductive years. Longitudinal studies may be the ideal platform to better understand the influence of various time-varying factors in the fertility gap between Hindus and Muslims. Second, the study was based on self-reported information from the survey respondents so was prone to reporting errors. Third, since maternity histories were collected retrospectively from each respondent, the data may have suffered from recall bias. Fourth, the study used number of children born by the exact age of 42 years as the outcome variable for the regression analysis. If there was no constraint on data availability and if the number of children born by the end of 49 years was the outcome variable for regression analysis, then the results of the regression analysis might have been slightly different than those found.
Despite these limitations, this study makes an important contribution to the literature on Hindu–Muslim fertility differentials in India by making use of available data to address some of the limitations in the existing literature.
Acknowledgment
The authors are very grateful to the two anonymous reviewers for their insightful comments and suggestions, which have improved the quality of this manuscript.


