


It is known that non-specific antibacterial defence systems consisting of lactoperoxidase (LPO), hydrogen peroxide (H2O2) and thiocyanate are present in bovine milk (Reiter & Harnulv, Reference Reiter and Harnulv1984; Ekstrand, Reference Ekstrand1989). In the LPO/H2O2/thiocyanate system, LPO with H2O2 catalyses the conversion of thiocyanate into antibacterial hypothiocyanite (Björck et al. Reference Björck, Rosen, Marshall and Reiter1975; Barett et al. Reference Barett, Grandison and Lewis1999). LPO and thiocyanate are present in bovine and ovine milk throughout lactation (Zapico et al. Reference Zapico, Gaya, De Paz, Nuñez and Medina1991; Althaus et al. Reference Althaus, Molina, Rodríguez and Fernández2001; Fonteh et al. Reference Fonteh, Grandison and Lewis2002). However, for the system to function, H2O2 must be present in milk.
A supply of H2O2 has been clearly demonstrated in the mouse, as l-amino acid oxidase in milk generates H2O2 through the oxidation of free amino acids (Sun et al. Reference Sun, Nonobe, Kobayashi, Kuraishi, Aoki, Yamamoto and Sakai2002). However, the presence of this enzyme in bovine milk has yet to be confirmed. Polymorphonuclear leucocytes release large amounts of H2O2 into bovine milk, particularly during phagocytosis (Korhonen & Reiter, Reference Korhonen and Reiter1983; Upadhyay, Reference Upadhayay1992). H2O2 is also generated by lactic acid bacteria present in milk (Björck, Reference Björck1978). Xanthine oxidase generates H2O2 in the presence of hypoxanthine (Björck & Claesson, Reference Björck and Claesson1979; Escribano et al. Reference Escribano, Garcia-Canovas and Garcia-Carmona1988) and bovine milk contains both free and fat globule membrane-bound xanthine oxidase (Brieley & Eisenthal, Reference Brieley and Eisenthal1974), while hypoxanthine is also present in bovine milk (Tiemeyer et al. Reference Tiemeyer, Stohrer and Giesecke1984). H2O2 can also be produced by specific generation systems, such as the oxidation of ascorbic acid, oxidation of glucose by glucose oxidase and the manganese-dependent aerobic oxidation of reduced pyridine nucleotides by peroxidase (Wolfson & Summer, Reference Wolfson and Summer1993). As the catalases and peroxidases in milk rapidly consume H2O2, it is normally present in very small amounts (Björck et al. Reference Björck, Rosen, Marshall and Reiter1975; Korhonen & Reiter, Reference Korhonen and Reiter1983). However, relatively high levels of H2O2 have been reported in bovine (Schiffman et al. Reference Schiffman, Schültz and Wiesner1992) and ovine milk (Althaus et al. Reference Althaus, Molina, Rodríguez and Fernández2001).
Following gel filtration of bovine milk, we found that an H2O2-like substance was generated in the small molecular mass fraction. In this study, the substance is identified as H2O2. We report here that bovine milk generates H2O2 by utilizing a low molecular weight compound.
Materials and Methods
Milk samples
Foremilk (first 15 ml) was collected from fourteen Holstein cows, 2–7 months into lactation, on the dairy farms at Nihon University and the University of Tokyo. Milk samples were of deliverable grade, and were cooled on ice after milking and stored at −60°C.
Whey was prepared by centrifugation at 265 000 g at 4°C for 2 h according to the findings of Morr & Swenson (Reference Morr and Swenson1973). Whey was applied to the YM-3 filter unit with a molecular limit of 3000 (Millipore Japan, Tokyo, Japan) and was centrifuged at 14 000 g at 4°C for 90 min. Filtrate was collected (YM-3 filtrate), diluted with an equal volume of 100 mm-sodium phosphate (pH 7·0) and incubated at 25°C for 4 h with 0·5 μg (5 U)/ml bovine liver catalase (Wako Pure Chemicals, Osaka, Japan) or 1 μg (0·08 U)/ml LPO (Sigma, St. Louis MO, USA). Insoluble materials appearing during incubation were removed by centrifugation at 20 000 g for 5 min.
Determination of H2O2
H2O2 was determined using one chemiluminescence and three colorimetric detection systems.
System 1: Test sample was mixed with an equal volume of assay reagent. The assay reagent consisted of 1·2 mg/ml TDPO (bis [2-(3, 6, trioxadecanyloxycarbonyl)-4-nitrophenyl] oxalate) and 0·2 mg/ml pyrene in acetonitrile (Wako Pure Chemicals) and was prepared on the day of the experiment (Imai et al. Reference Imai, Nawa, Tanaka and Ogata1986). The luminescence intensity was counted for 10 s immediately after mixing using an Atto AB-2200 luminometer.
System 2: In the presence of LPO, the oxidation of ABTS (2,2′-azinodi-ethylbenzthia-zoline-6-sulphonic acid) (Wako Pure Chemicals) by H2O2 was measured at an absorbance of 412 nm using a Shimadzu UV-1600 spectrophotometer. The assay reagent consisted of 1 μg/ml LPO and 1 mm-ABTS in 100 mm-sodium phosphate (pH 6·7). The reaction was started by mixing the test sample with the assay reagent. The final concentration of the test sample was 3% (v/v). Increases in optical density (OD) were recorded. Initial rates of change were linear for 1 min in all samples examined.
System 3: The oxidation of phenol red by H2O2 was determined in the presence of horseradish peroxidase (HRPO) (Pick, Reference Pick, Sabato and Everse1986). HRPO and phenol red (Wako Pure Chemicals) was dissolved in 50 mm-potassium phosphate (pH 7·0). The reaction mixture, consisting of 20 U/ml HRPO, 0·56 mm-phenol red and 10% (v/v) test sample, was incubated at 37°C for 60 min. The reaction was interrupted by adding a 1/10 volume 1 m-NaOH and the OD was measured at 600 nm.
System 4: H2O2 was determined using a colorimetirc H2O2 kit supplied by Sigma. Test sample was diluted with three volumes of 70 mm-sodium phosphate (pH 6·0) according to the manufacturer's instructions and the OD was measured at 550 nm with a spectrophotometer.
Each determination was performed in triplicate. A standard calibration curve was constructed for each assay using known amounts of H2O2 in water. The amount of H2O2 in the test sample was calculated using the standard curve. In this study, the signal obtained without H2O2 in water was taken as the background for each detection system.
Gel filtration
Samples (0·5 ml) of whey and YM-3 filtrate were separated at 4°C on an Amersham Biosciences FPLC with Superdex 30 (HR 16/50) (Uppsala, Sweden) at a flow rate of 1 ml/min, and 1-ml fractions were collected. OD was monitored at 280 nm. The elution buffer consisted of 100 mm-sodium phosphate (pH 7·0). The column was calibrated using vitamin B12, cystine and H2O2 (Wako Pure Chemicals). The void volume was determined using blue dextran (Amersham). Details are given in the legend of Fig. 2.
Statistical methods
Results are expressed as means±sd with the experiment number. Statistical analyses were performed using Student's t test, correlation analysis and one way analysis of variance (ANOVA). Differences with P values below 0·05 were considered to be statistically significant.
Results
Milk samples used for evaluation
Fourteen individual milk samples were used for evaluation. YM-3 filtrates were incubated at 25°C for 4 h and then introduced into System 1. As compared with the standard curve, no TDPO-reactive substances were detected at 0 h, but at 4 h the amount increased to between 2·4 and 6·5 nmol/ml, depending on the sample. The mean production was 4·2±1·7 nmol/ml (mean±sd) indicating that TDPO-reactive substances were newly synthesized during the 4-h incubation. We then attempted to clarify whether the TDPO-reactive substance was H2O2.
Measurement of H2O2 using System 1
The minimum amounts of H2O2 detected by each detection system are shown in Table 1. System 1 had the highest sensitivity, and the dose-response curve was linear from 0·1 to 10 nmol/ml H2O2. System 1 also had no background interference in determining H2O2 (Fig. 1). In three milk samples, the intra-assay variation was within 6% (each with five determinations) and the inter-assay variation was within 13% (3 repetitions, each with five determinations).

Fig. 1. Effects of catalase and lactoperoxidase. YM-3 filtrate was incubated at 25°C for 4 h with (+) or without (−) catalase and lactoperoxidase (LPO). The amount of H2O2 was determined using System 1. Values are means±sd (n=14), **P<0·01 compared with no enzyme control.
Table 1. Hydrogen peroxide (H2O2) determined using systems 1–4. YM-3 filtrate was incubated at 25°C for 4 h in the presence and absence of catalase and then H2O2 was determined using the detection system indicated.
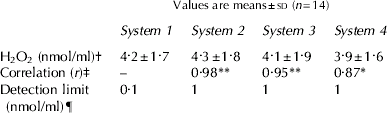
† Amount of H2O2 had been subtracted from that obtained in the presence of catalase
‡ Compared with data obtained using System 1: *P<0·05, **P<0·01
¶ Detection levels in each system were obtained using standard H2O2 solutions
Identification of H2O2
If the TDPO-reactive substance is H2O2, the substance will be degraded by incubation with catalase and LPO. The YM-3 filtrate was incubated with catalase and LPO and the amount of TDPO-reactive substance was then determined using System 1 (Fig. 1). The TDPO-reactive substance disappeared during incubation with calalase, returning to background levels in System 1. After 4 h of incubation with LPO, a TDPO-reactive substance decreased significantly (P<0·005). Thus, the TDPO-reactive substance disappeared by incubation with catalase and LPO.
If the TDPO-reactive substance is H2O2, it will similarly be detected in the various H2O2 detection systems. The YM-3 filtrate was incubated in the presence and absence of catalase, and was then assayed using systems 1–4. Even after incubation with catalase, the OD was occasionally higher than the background OD in systems 3 and 4 (results not shown). The catalase-dependent decrease is shown in Table 1, and was comparable among the four detection systems (F=0·53, P>0·25). The amount estimated using System 4 was slightly lower than that estimated using System 1, but the difference was non-significant.
If the four systems accurately and correctly detect the same substance, the data must be correlated. In this study, the catalase-dependent decrease was used for comparison. Results obtained using System 1 were compared with those obtained using the other three colorimetric systems (Table 1). The correlation coefficient was 0·98 with System 2 (P<0·01), 0·95 with System 3 (P<0·01) and 0·87 with System 4 (P<0·05).
Based on this evidence, the TDPO-reactive substance was confirmed to be H2O2.
Gel filtration of whey and YM-3 filtrate
An H2O2-generating substance must be present in milk. All 14 samples were examined and the representative results are shown in Fig. 2. Whey was subjected to gel filtration (Fig. 2A). No peaks for H2O2 were detected immediately after gel filtration, but after 4 h of incubation, a single peak was seen in fraction 84. When a comparison was made with the molecular mass marker positions, the H2O2-generating substance had an apparent molecular mass of 600. To test the heat stability, fraction 84 was placed in boiling water for 5 min. The production of H2O2 was unchanged after boiling.

Fig. 2. Gel filtration of whey and YM-3 filtrate. The amount of H2O2 was determined using System 1. The positions of molecular mass markers (vitamin B12 (1), cystine (2) and H2O2 (3)) are indicated. (A) Whey was applied on Superdex 30. After gel filtration the tube was incubated at 25°C for 0 h (open symbol) or 4 h (closed symbol). (B) YM-3 filtrate was pre-incubated at 25°C for 30 min and then applied. After gel filtration the tube was incubated at 25°C for 0 h (open symbol) or 4 h (closed symbol).
The YM-3 filtrate was prepared from whey used above. To generate H2O2 before gel filtration, the YM-3 filtrate was incubated at 25°C for 30min and then applied (Fig. 2B). In fraction 84, the concentration of H2O2 increased from 0 to 1·2 nmol/ml during the 4-h incubation. Another peak was detected at position 94, the same as that for pure H2O2, but the height was unchanged by the 4-h incubation after gel filtration. H2O2 was clearly separated from the H2O2-generating substance.
The total amount of H2O2 from fractions 80–97 (Fig. 2B) was correlated with that from fractions 80–90 (Fig. 2A) (r>0·93, P<0·01, n=14).
Except in a void volume (fraction 41), the OD profile of whey was essentially the same as that for YM-3 (results not shown).
Time-dependent production of H2O2
YM-3 filtrate was incubated at 25°, 38° and 45°C. Time-dependent production of H2O2 is shown in Fig. 3. At 25°C, the production of H2O2 increased at 30 min (P<0·01 compared with that at 0 h) and increased in a curvilinear manner with time. The production peaked after 3 h of incubation. Production at 38°C increased faster than that at 25°C and peaked at 2 h of incubation. The time-dependent production at 45°C was comparable to that at 38°C (results not shown). Maximun production was the same at either 25, 38 or 45°C. No H2O2 was detected in the presence of catalase.

Fig. 3. Time-dependent production of H2O2. The YM-3 filtrate was incubated with (closed symbol) or without (open symbol) catalase and at the times indicated, the amount of H2O2 was determined using System 1; 25°C (circle) and 38°C and 45°C (square). Values are means±sd (n=4).
In our unpublished observations, the YM-3 filtrate was degassed in a vacuum and incubated in an atmosphere of water-saturated nitrogen. No production was observed at 25, 38 and 45°C. Incubation was done under light-protected and unprotected conditions, and no difference was found.
Effects of whey incubation on production of H2O2
Whey was preincubated on ice and at 38°C for 2 h and the YM-3 filtrate was then prepared. After 4 h of incubation of the YM-3 filtrate, production of H2O2 was determined. With preincubation at 38°C for 0 and 2 h, production of H2O2 was 4·1±1·5 nmol/ml and 1·6±0·9 nmol/ml (mean±sd, n=14), respectively. The difference was significant (P<0·01). In three milk samples, however, the degree of this decrease was relatively small (29, 33 and 39%). With preincubation on ice, no decrease of the ability to produce H2O2 was observed.
Discussion
Initially, we found that a TDPO-reactive substance was generated during incubation of the YM-3 filtrate. Several methods are available for the determination of H2O2 in the nanomolar range. System 1 had the highest sensitivity and no background interference in determining H2O2. Colorimetry was also successful in determining H2O2. However, high background levels were occasionally observed in Systems 3 and 4, thus suggesting that the amount of H2O2 should be calculated by the difference between the presence and absence of catalase.
Catalase decomposes H2O2 to water and oxygen, and we confirmed the complete decomposition of H2O2 in the standard H2O2 solution by catalase. The TDPO-reactive substance also disappeared on incubation with catalase. LPO decomposes H2O2 efficiently in the presence of oxidizable halides and thiocyanate (Furtmüller et al. Reference Furtmüller, Jantschko, Regesberger, Jakopitsch, Arnhold and Obinger2002). Thiocyanate in milk (Zapico et al. Reference Zapico, Gaya, De Paz, Nuñez and Medina1991; Althaus et al. Reference Althaus, Molina, Rodríguez and Fernández2001; Fonteh et al. Reference Fonteh, Grandison and Lewis2002) is converted to hypothiocyanite through the decomposition of H2O2 by LPO (Pruitt et al. Reference Pruitt, Tenovuo, Andrews and McKane1982; Thomas et al. Reference Thomas, Bonezan, Learn, Everse, Everse and Grisham1991; Furtmüller et al. Reference Furtmüller, Jantschko, Regesberger, Jakopitsch, Arnhold and Obinger2002). Thiocynate in milk is able to pass through the YM-3 filter (unpublished data) as determined by ferric nitrate dye assay (Fonteh et al. Reference Fonteh, Grandison and Lewis2002). Thus, LPO is capable of decomposing H2O2 in the YM-3 filtrate. The TDPO-reactive substance was decomposed by incubation with LPO.
TDPO, an aryl oxalate ester in the peroxyoxalate chemiluminescence reaction, was developed for the high-sensitivity detection of H2O2 (Imai et al. Reference Imai, Nawa, Tanaka and Ogata1986). The TDPO-reactive substance oxidized ABTS with LPO in System 2 (Shindler & Bardsley, Reference Shindler and Bardsley1975) and oxidized phenol red with HRPO in System 3 (Pick, Reference Pick, Sabato and Everse1986). Ferrous ions (Fe2+) are converted to Fe3+ by H2O2 and Fe3+ binds with xylenol orange (Jiang et al. Reference Jiang, Woollard and Wolff1990). A purple colour proportional to TDPO-reactive substance was produced in System 4. The catalase-dependent decreases were within the same range in all detection systems used in this study. Based on the high correlations, all detection systems appeared to detect the same compound generated during incubation. On gel filtration, the TDPO-reactive substance was eluted at the same position as H2O2. All these observations indicate the presence of H2O2 and we thus concluded that the TDPO-reactive substance is H2O2.
Gel filtration of whey indicated that a H2O2-generating substance had an apparent molecular mass of 600. A H2O2-generating substance could completely pass through the ultrafiltration membrane and the molecular mass remained unchanged. At present, it is uncertain whether the H2O2-generating substance is a non-proteinic compound.
Based on the decrease of H2O2 production after incubation of whey, it is clear that H2O2 is generated in milk. However, H2O2 in whey was not detected in this study, which confirms previous findings (Björck et al. Reference Björck, Rosen, Marshall and Reiter1975; Korhonen & Reiter, Reference Korhonen and Reiter1983). This is probably due to the decomposition of H2O2 by LPO in milk, as the oxidation of thiocynate by LPO in the presence of H2O2 occurs very rapidly (Furtmüller et al. Reference Furtmüller, Jantschko, Regesberger, Jakopitsch, Arnhold and Obinger2002). As shown here, the generation of H2O2 terminated once a H2O2-generating substance had been consumed. It is reasonble to speculate that the production of H2O2 is started after the release of the substance into the alveolar lumen. As the interval is longer after milking, the volume of milk in the udder is larger. The concentration of H2O2-generating substance in milk present in the alveolar lumen is higher than that reported here.
In conclusion, a H2O2-generating substance is present in bovine milk and is degraded in whey. Thus, a novel H2O2-supplying system is identified in this study.
This work was supported by Grants-in-aid for Scientific Research from the Ministry of Education, Science, Sports and Culture of Japan and by Tikusan-Gijutu Kyokai in Tokyo. The authors are also very grateful to Professor K Endo at Nihon University.


