INTRODUCTION
The geographic location of southern Africa at the confluence of temperate and tropical/subtropical climatic systems (Schulze, Reference Schulze1972) and the Agulhas and Benguela Currents (Lutjeharms, Reference Lutjeharms2006) leads to spatially complex modern climatic conditions. Within the context of the complexity and variability of climate conditions, the South African south coast is a key region for research on understanding the origins of modern humans (e.g., Marean et al., Reference Marean, Cawthra, Cowling, Esler, Fisher, Milewski, Potts, Singles and De Vynck2014; Wadley, Reference Wadley2015) as well as research in the highly diverse Greater Cape Floristic Region (GCFR; e.g., Allsopp et al., Reference Allsopp, Colville and Verboom2014). In order to analyze the effects of climate variations on our modern human ancestors and the vegetation dynamics and diversification in the region, we need to better understand the past climatic variability at this crossroad of atmospheric and oceanic circulation systems.
An outstanding feature of the South African climate is the seasonality of its rainfall distribution (Fig. 1a). The southwest of the country is dominated by Mediterranean-type winter rainfall, whereas the east and northeast get most of their rainfall during the summer. Our study site at Pinnacle Point on the south coast is located in the transition region between winter and summer rainfall, and rain may fall year-round (Fig. 1a). The rainfall season is determined by atmospheric interactions between the temperate westerlies, the subtropical anticyclones, and the tropical easterlies (Tyson and Preston-Whyte, Reference Tyson and Preston-Whyte2000; Engelbrecht et al., Reference Engelbrecht, Landman, Engelbrecht and Malherbe2015). The main rain-bearing systems on the south coast are ridges of the South Atlantic Anticyclone to the south of South Africa, which lead to advection and stratiform rainfall on the south coast, and the tropical temperate troughs that form when a continental heat low (or thermal low) links up with the westerlies to form convective cloud bands (Engelbrecht et al., Reference Engelbrecht, Landman, Engelbrecht and Malherbe2015). A recent study of the rainfall isotopic composition in the year-round rainfall region indicates that considerable changes of rainfall δ18O (δ18Op, ~ 5‰) are related to seasonal variations in synoptic conditions (Braun et al., Reference Braun, Bar-Matthews, Ayalon, Zilberman and Matthews2017).
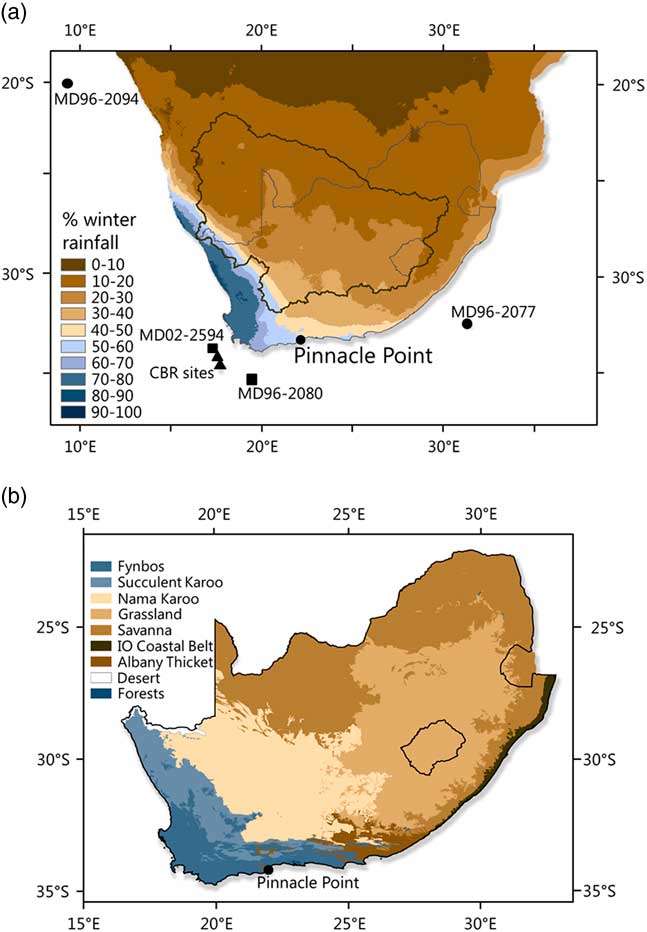
Figure 1 (color online) Maps of South Africa and surroundings. (a) Locations of Pinnacle Point and sediment cores used in analyses (dots for cores MD96-2094 [Stuut et al., Reference Stuut, Prins, Schneider, Weltje, Jansen and Postma2002] and MD96-2077 [Bard and Rickaby, Reference Bard and Rickaby2009]; squares for sites MD02-2594 and MD96-2080 [Martínez-Méndez et al., Reference Martínez-Méndez, Zahn, Hall, Peeters, Pena, Cacho and Negre2010]; triangles for sites of the Cape Basin Record [CBR; Peeters et al., Reference Peeters, Acheson, Brummer, de Ruijter, Schneider, Ganssen, Ufkes and Kroon2004]); shading shows percentage of winter rainfall (legend in graph). The thick black outline delineates the catchment of the Orange River. (b) Distribution of vegetation biomes (Mucina and Rutherford, Reference Mucina and Rutherford2006), the Greater Cape Floristic Region combines the fynbos, succulent karoo, and Albany thicket biomes (Bergh et al., Reference Bergh, Verboom, Rouget and Cowling2014).
Present-day vegetation distribution in South Africa is closely tied to the seasonality and amount of rainfall. Fynbos, the megadiverse biome dominated by C3 plants, is mainly located in the southwestern winter rainfall region but also extends along the south coast into the year-round rainfall region (Fig. 1). As the proportion of summer rainfall increases on a west-to-east transect along the south coast, so does the fraction of C4 grasses in the vegetation (Vogel et al., Reference Vogel, Fuls and Ellis1978; Cowling, Reference Cowling1983). Toward the interior, total rainfall amounts decrease and fynbos communities are replaced by succulent karoo (Mucina and Rutherford, Reference Mucina and Rutherford2006), rich in crassulacean acid metabolism (CAM) plants. Together, the fynbos, succulent karoo, and subtropical thicket biomes are referred to as the GCFR (Allsopp et al., Reference Allsopp, Colville and Verboom2014). Given its extratropical location, the GCFR has extraordinarily high levels of plant and invertebrate diversity and endemism (Cowling et al., Reference Cowling, Holmes and Rebelo1992; Goldblatt and Manning, Reference Goldblatt and Manning2002; Colville et al., Reference Colville, Potts, Bradshaw, Measey, Snijman, Picker, Procheş, Bowie and Manning2014). However, this diversity is not equally distributed across the GCFR; the western, winter rainfall and C3–dominated areas have about double the number of species compared with the less seasonal rainfall region along the south coast (Cowling and Lombard, Reference Cowling and Lombard2002). It has been suggested that this diversity is a response to differential environmental stability during the Quaternary, whereby eastern regions experienced stronger environmental fluctuations and therefore greater rates of GCFR lineage extinction than areas farther west (Cowling, Reference Cowling1983; Cowling and Lombard, Reference Cowling and Lombard2002; Cowling et al., Reference Cowling, Procheş and Partridge2009).
A commonly accepted hypothesis for climate change in southern Africa on glacial-interglacial timescales suggests that increases in polar ice volume during glaciations led to a northward shift of the westerlies and increases in the spatial extent of the winter rainfall region (Van Zinderen Bakker, 1976, Reference Van Zinderen Bakker1983), while the summer rainfall region experienced extended droughts (Van Zinderen Bakker and Illies, Reference Van Zinderen Bakker and Illies1978; Van Zinderen Bakker, Reference Van Zinderen Bakker1983). Considering the high spatial complexity of present-day climate, it is, however, not surprising that a growing number of climate reconstructions from different regions across southern Africa show considerable discrepancies (e.g., Scott et al., Reference Scott, Neumann, Brook, Bousman, Norström and Metwally2012; Chevalier and Chase, Reference Chevalier and Chase2015).
Records of speleothem oxygen and carbon stable isotope ratios (δ18Oc, δ13C) are among the most powerful proxies for terrestrial climate change. Speleothem growth history can be directly and precisely dated using U-series disequilibrium dating (e.g., Hellstrom and Pickering, Reference Hellstrom and Pickering2015). δ18Oc values are influenced by the temperature at the cave site and by the δ18O of the cave water, which reflects rainwater and fractionation processes in the water cycle (e.g., Gascoyne et al., Reference Gascoyne, Schwarcz and Ford1980; McDermott, Reference McDermott2004). δ13C values of speleothems in areas where C3 and C4 plants overlap primarily depend on their relative abundances in the vegetation above the cave (Dorale et al., Reference Dorale, González, Reagan, Pickett, Murrell and Baker1992, Reference Dorale, Edwards, Ito and González1998; Bar-Matthews et al., Reference Bar-Matthews, Ayalon and Kaufman1997; Denniston et al., Reference Denniston, González, Asmerom, Polyak, Reagan and Saltzman2001; Hopley et al., Reference Hopley, Weedon, Marshall, Herries, Latham and Kuykendall2007). In the southern South African region, a pioneering carbon and oxygen stable isotope study at Cango Cave by Talma and Vogel (Reference Talma and Vogel1992) revealed the potential of cave speleothems to record temperature change and rainfall variations, as well as the composition of the vegetation. Bar-Matthews et al. (Reference Bar-Matthews, Marean, Jacobs, Karkanas, Fisher, Herries and Brown2010) reconstructed past climate conditions using speleothems from Crevice Cave at Pinnacle Point. Their work showed that between 90 and 53 ka, periods of cool climate are generally associated with increased summer rainfall and a spread of C4 vegetation (Bar-Matthews et al., Reference Bar-Matthews, Marean, Jacobs, Karkanas, Fisher, Herries and Brown2010).
The coastal cliffs at Pinnacle Point indeed represent a uniquely important environment for the study of past climates. The caves and rock shelters in these cliffs contain well-preserved archaeological deposits that have provided abundant evidence for hunter-gatherer adaptations in the middle and late Pleistocene (Marean et al., Reference Marean, Bar-Matthews, Bernatchez, Fisher, Goldberg, Herries and Jacobs2007; Brown et al., Reference Brown, Marean, Herries, Jacobs, Tribolo, Braun, Roberts, Meyer and Bernatchez2009, Reference Brown, Marean, Jacobs, Schoville, Oestmo, Fisher, Bernatchez, Karkanas and Matthews2012; Jerardino and Marean, Reference Jerardino and Marean2010; Karkanas et al., Reference Karkanas, Brown, Fisher, Jacobs and Marean2015; Wilkins et al., Reference Wilkins, Brown, Oestmo, Pereira, Ranhorn, Schoville and Marean2017). Taken together, the archaeological occupations date from ~160 to 50 ka (Marean et al., Reference Marean, Cawthra, Cowling, Esler, Fisher, Milewski, Potts, Singles and De Vynck2014), thus covering what is thought to be the formative period of the modern human lineage in Africa (Marean, Reference Marean2015; Wadley, Reference Wadley2015). It is widely recognized that hunter-gatherer adaptations are strongly linked to climate and environmental change, and a major motivation of this study is to provide a long and well-dated climate record to help contextualize modern human origins in this region.
This study extends the Pinnacle Point speleothem δ18Oc and δ13C record to cover the interval between 330 and 43 ka. Despite several hiatuses in speleothem deposition, the extended record covers both interglacial and glacial conditions and thus allows us to assess the relative impacts of drivers of glacial-interglacial climate change. We explore different environmental parameters that may influence the δ18Oc and δ13C of speleothems at Pinnacle Point and compare our record with reconstructions of temperatures in Antarctica, sea surface temperature (SST) in the Agulhas Current region of the southwest Indian Ocean, a proxy for river runoff from the Orange River, and a proxy for shifts of the location of the subtropical convergence (STC) south of South Africa. This comparison allows us to present a new hypothesis on the effect of orbital scale changes in atmospheric pressure systems on climate in South Africa. Finally, we compare the climatic change indicated by our new proxy record with other proxies from the South African south coast and evaluate the impact of the environmental variations on human hunter-gatherers and GCFR plant communities.
Regional setting of the study
Pinnacle Point (34°12.47ʹS, 22°5.37ʹE; Fig. 1) is a coastal headland located 10 km west of the city of Mossel Bay. Caves and rock shelters are common in the steep coastal cliffs in the area.
Present-day climate
The average annual rainfall amount at Cape St. Blaize weather station at Mossel Bay (~6 km east of Pinnacle Point) is 330 mm, and annual average temperature is 17.5°C (National Climatic Data Center, National Oceanic and Atmospheric Administration, 2016). Seasonal temperature variations are low (~ 6°C difference between monthly average in February and July). Rainfall seasonality along the Cape south coast is moderate with all 12 months of the year contributing 5% or more to the long-term annual average (Engelbrecht et al., Reference Engelbrecht, Landman, Engelbrecht and Malherbe2015). The isotopic composition of rainfall (δ18Op) varies seasonally by ~5‰, depending on the shifts in synoptic conditions and changes in the contribution from stratiform and convective rainfall (Braun et al., Reference Braun, Bar-Matthews, Ayalon, Zilberman and Matthews2017).
Regional environment and cave formation
The coastal cliffs at Pinnacle Point consist of the coarse quartzitic sandstones of the Skurweberg Formation (Paleozoic; Table Mountain Sandstone Group [TMS]), which contain fault breccias (Theron et al., Reference Theron, Malan and Hill1989). Repeated sea level variations and wave action created caves and rock shelters by eroding these fault breccias. During periods of lowered sea levels, dunes formed on the exposed continental shelf and frequently sealed the cave sites as they migrated toward the cliffs. Unlithified dunes, eolianites, and calcretes assigned to the Bredasdorp Group (Klein Brak and Waenhuiskrans Formations; Pleistocene; Malan, Reference Marean1990) are ubiquitous at Pinnacle Point, cemented to the cliffs, and across the landscape on top of the TMS. Speleothem and tufa formations are common in the caves with carbonate sources in the eolianites, calcarenites, and calcretes of the Bredasdorp Group.
The unusual development history of the caves in a quartzite host rock with closure by dunes leads to several possible complications for speleothem formation and stable isotopic equilibrium. In typical karstic caves, speleothem deposition in isotopic equilibrium is likely in poorly ventilated chambers where relative humidity and CO2 concentration in the cave air are high (McDermott, Reference McDermott2004; Lachniet, Reference Lachniet2009). However, in the small wave-cut caves at Pinnacle Point, ventilation is determined by the thickness and degree of cementation of the closing dune. During times when the cave is open, the deposition of tufa rather than speleothems is likely. Speleothem deposition may occur, however, when the cave has a small opening or is sealed by a thin dune cover with limited air circulation. Fluctuating CO2 concentrations and humidity in the cave air can lead to fast CO2 degassing or evaporation of drip water, respectively, which may result in kinetic isotope effects during speleothem formation. The more frequent and rapid shifts between open and closed conditions in the quartzite caves compared with typical karstic caves also lead to the formation of smaller speleothem deposits (closed cave) interbedded with layers of sand and tufa (open conditions). We address questions of the establishment of isotopic equilibrium by employing a combination of repetition tests, Hendy tests (Hendy, Reference Hendy1971), and petrographic analyses to identify an overall climatic signal in the stable isotopic records. Details of these tests are given in the “Materials and Methods.”
The primary vegetation above the cliffs is limestone fynbos, a vegetation type dominated by C3 shrubs and rich in endemic species. Below the cliffs, strandveld and thicket, also C3-dominated vegetation types, prevail (Willis et al., Reference Willis, Cowling and Lombard1996; Mucina and Rutherford, Reference Mucina and Rutherford2006). C3 and C4 grasses occur in roughly equal proportions in both vegetation types but form a relatively minor component. However, in renosterveld and some of the fynbos vegetation types to the interior of the study site, the grass component is sometimes high with C3 species (Capechola, Pentemeris) dominant on pole-facing slopes and C4 species on equator-facing slopes (Cowling, Reference Cowling1983).
MATERIALS AND METHODS
Sampling
Speleothem samples were taken from two sites at Pinnacle Point: Staircase Cave and PP29, located 130 and 250 m west, respectively, of Crevice Cave studied by Bar-Matthews et al (Reference Bar-Matthews, Marean, Jacobs, Karkanas, Fisher, Herries and Brown2010). Both sites were wave cut and intermittently closed by coastal dunes, allowing for speleothem deposition (Bar-Matthews et al., Reference Bar-Matthews, Marean, Jacobs, Karkanas, Fisher, Herries and Brown2010; Marean et al., Reference Marean, Bar-Matthews, Fisher, Goldberg, Herries, Karkanas, Nilssen and Thompson2010). PP29 is now an open cave, and vandalism has caused considerable damage to its deposits. Speleothem sampling included specimens from different parts of the cave to ensure a comprehensive coverage of all depositional phases at the highest possible resolution. Pieces of stalagmites, stalactites, and flowstones were cut using a combination of an angle grinder, core drill, diamond-bladed circular saw, and diamond-bladed chain saw. Staircase Cave is a collapsed cave, now only represented by remnants of clastic cave sediments and speleothems plastered to the cliff. Samples from Staircase Cave were drilled with a core drill into exposed flowstone and cut from edges of flowstones with an angle grinder, and some were removed from a crevice or pocket that had formed within the cave sediments.
All specimens were cut in half along their main growth axis with a diamond saw, and archives kept in South Africa. Aliquots for dating and stable isotope analyses were drilled from the other half.
U-series disequilibrium dating
U-series disequilibrium dating measurements were done at the Geological Survey of Israel (GSI) using procedures described by Vaks et al. (Reference Vaks, Bar-Matthews, Ayalon, Matthews, Frumkin, Dayan, Halicz, Almogi-Labin and Schilman2006, Reference Vaks, Bar-Matthews, Matthews, Ayalon and Frumkin2010) and Grant et al. (Reference Grant, Rohling, Bar-Matthews, Ayalon, Medina-Elizalde, Ramsey, Satow and Roberts2012). Aliquots for dating were drilled across speleothem samples following the growth laminae. Between 0.2 and 0.3 g of the speleothem material was drilled for each aliquot using a hand drill equipped with 0.8–4 mm diameter diamond drill bits. The calcite powder was dissolved in 7N HNO3. Detrital material was separated in a centrifuge (10 minutes at 4000 rpm) and treated additionally with HNO3 and HF. For calibration, a 229Th + 236U spike was added to all aliquots, which were then loaded into minicolumns that contained 2 mL Bio-Rad AG 1-X8 200–400 mesh resin. Thorium was eluted with 6N HCl, and uranium with 1N HBr. The two solutions were evaporated to dryness and dissolved in 5 mL and 2 mL of 0.1N HNO3, respectively. Measurements were carried out using a multicollector inductively coupled plasma mass spectrometer (MC-ICP MS; Nu Instruments Ltd., UK) equipped with 12 Faraday cups and three ion counters. The aliquots were introduced to the MC-ICP MS through an Aridus microconcentric desolvating nebulizer sample introduction system. The instrumental mass bias was corrected for (using an exponential equation) by measuring the 235U/238U ratio and correcting with the natural value (137.88). The calibration of ion counters relative to Faraday cups was performed using several cycles of measurement with different collector configurations for each individual analysis. Age determination was possible because of the accurate determination of 234U and 230Th concentrations by isotope dilution analysis using the 236U–229Th spike. Uranium standard CRM 112A was analyzed every eight uranium samples. Values of half-lives for 230Th and 234U were taken from Cheng et al. (Reference Cheng, Edwards, Shen, Polyak, Asmerom, Woodhead and Hellstrom2013a). Concentrations of detrital thorium (represented by 232Th) were between 1.1 and 153 ppb in PP29 and 0.2 to 254 ppb in Staircase Cave. Only one dating sample from Staircase Cave (46861-C1) had a higher concentration of 232Th of 692 ppb and a low 230Th/232Th ratio (9.25) and therefore was corrected for detrital thorium. The corrected age assumes an initial 230Th/232Th atomic ratio of 4.4 ± 2.2 × 10⁻⁶, the value of material in secular equilibrium with the bulk earth 232Th/238U ratio of 3.8. The results of uranium and thorium isotopic analyses and the calculated ages with errors are presented in Table 1.
Table 1 Speleothem 230Th dating results. Samples with no depth value were taken in a different part of the speleothem as the isotopic record and are not used in age models. b2k, before the year 2000 .

Stable isotope analyses of oxygen and carbon
Stable isotopic analyses of the speleothem carbonate were done using the protocols described in Bar-Matthews et al. (Reference Bar-Matthews, Ayalon and Kaufman1997, Reference Bar-Matthews, Ayalon, Gilmour, Matthews and Hawkesworth2003). For the analysis of δ18Oc and δ13C, aliquots of 1–2 mg were drilled from the cross section of the samples at intervals of about 0.5 mm along the growth axis of the speleothem using a hand drill equipped with a 0.8 mm diameter drill bit. About 600–700 μg of the aliquots was weighed and put into glass vials at room temperature. Vials were dried uncapped in an oven at 60°C overnight to remove excess moisture. The vials were balanced horizontally, with the carbonate powder in the bottom and a drop of dry phosphoric acid (100%) at the top and flushed with pure helium gas for 10 minutes. After the needles used for flushing were removed, the vials were turned to a vertical position to allow for the dissolution of the carbonate in the phosphoric acid. The isotopic composition of CO2 generated by the reaction was measured in a Finnigan Gas Bench II extraction system attached to a ThermoFinnigan DELTA plus XD mass spectrometer with a CTC Analytics automatic sampler at the GSI. Values where measured relative to international Standard NBS 19 and are reported in per mil (‰) relative to Vienna Pee Dee Belemnite. Analytical reproducibility is better than 0.1‰ for δ18Oc and δ13C.
Results of the stable isotopic analyses of individual samples are given in Supplementary Table 1.
Age model construction
The diversity of the sample material, together with occurrence of hiatuses and outlier ages, necessitated the combined application of two methods of age model construction: linear interpolation and the algorithm StalAge (Scholz and Hoffmann, Reference Scholz and Hoffmann2011). Initially, StalAge age models were used to identify major outliers and to provide an error envelope in the form of its 95% confidence limits. At the same time, a linearly interpolated age model was constructed using all ages in stratigraphic order and assuming continuous growth. Sections of the samples in which the growth rates given by the initial age models were reduced by a factor of 10 compared with the rest of the sample were examined for evidence of hiatuses using petrographic criteria (variations of color, the presence of white laminae, sharp changes in isotopic values, and switches of the crystal fabric and growth habit in thin section; Supplementary Fig. 1). In cases where several indications for a hiatus were found, the sample was subdivided at the hiatus boundary into separate growth phases, and new linear interpolation and StalAge age models were constructed for the subsections of the sample. Continuously grown sections of speleothems generally show good agreement between linear interpolation and StalAge age models (Figs. 2 and 3), but variations in growth rate can bring about deviations between the StalAge and linear interpolation age models (e.g., Fig. 2d and f).
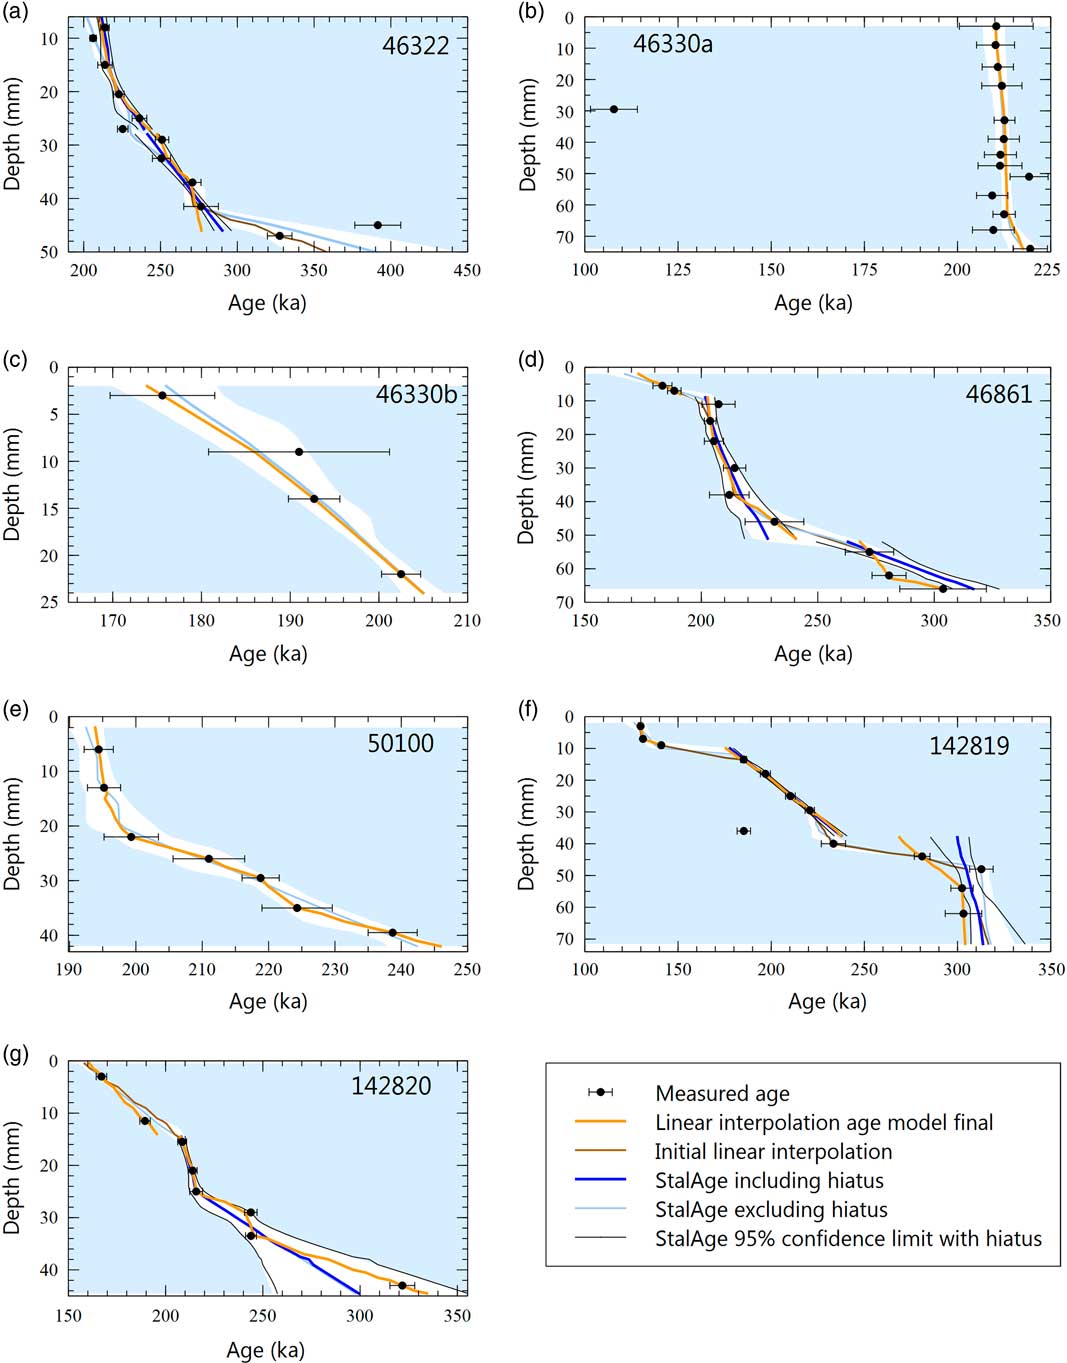
Figure 2 (color online) (a–g) Age-depth plots showing measured ages for samples from Staircase Cave and age models constructed by linear interpolation and using StalAge (Scholz and Hoffmann, Reference Scholz and Hoffmann2011; legend is given in figure). White background indicates 95% confidence interval of initial StalAge age model (not accounting for hiatuses). Detailed description of age model construction for individual samples can be found in Supplementary Chapter 1. Linear interpolation age models generally overlap well with StalAge age models in sections where both methods could be applied.
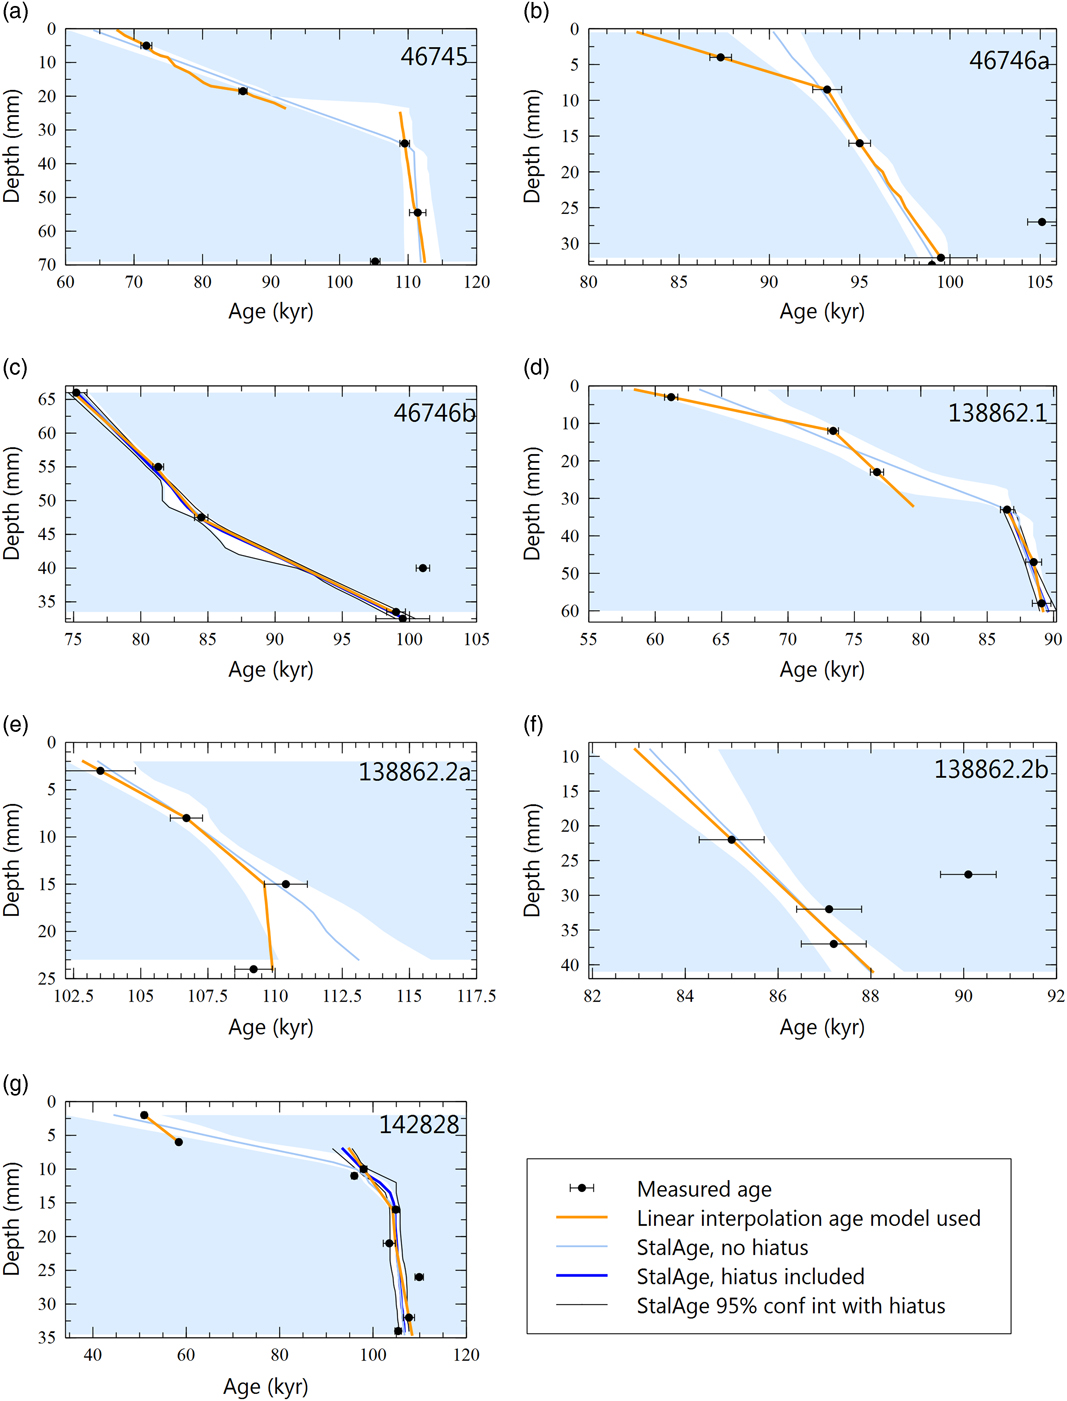
Figure 3 (color online) (a–g) Age-depth plots showing measured ages for samples from PP29 and age models constructed by linear interpolation and using StalAge (Scholz and Hoffmann, Reference Scholz and Hoffmann2011; legend is given in figure). White background indicates 95% confidence interval of initial StalAge age model (not accounting for hiatuses). Detailed description of age model construction for individual samples can be found in Supplementary Chapter 1. Linear interpolation age models generally overlap well with StalAge age models in sections where both methods could be applied.
The subdivision into different growth intervals created subsections in some of the samples for which age modelling using StalAge was not possible; either they were only dated by two ages, or changes in growth rate within the section led to problems in the algorithm’s check for outliers. We therefore constructed linearly interpolated age models for these sections of the samples, which usually were within the 95% confidence limit of the initial StalAge age models that did not account for hiatuses. Figures 2 and 3 show the final age model compared with StalAge age models for each of the samples. Individual samples and age models are described in Supplementary Chapter 1, and data are given in Supplementary Table 1.
Correlation of trends in the records
Statistical analyses of correlation between different time series were performed using the R software environment for statistical computing and graphics (R Core Team, 2017). To allow for the analysis of correlation between data sets, the different sets were smoothed using a spline interpolation following the methods described in Fritsch and Carlson (Reference Fritsch and Carlson1980). We achieved this by applying the “splinefun” function of the “stats” package in R with the method “monoH.FC.” In this manner, we created a monotone piecewise cubic interpolation function of the original data sets that could then be sampled at defined and equally spaced intervals using the “seq” function of the “base” R package. Resampling our speleothem δ18Oc and δ13C records at the same resolution and the same points in time as the relevant proxy records allowed us to calculate Pearson’s correlation coefficients and P values using the “cor.test” function in R’s “stats” package. Supplementary Figure 2 shows a comparison of the original data sets with spline functions sampled at 1 ka intervals for the Staircase Cave δ18Oc values and the key proxy records referred to in this study (SST from sediment cores MD96-2080 and MD02-2594: Martínez-Méndez et al., Reference Martínez-Méndez, Zahn, Hall, Peeters, Pena, Cacho and Negre2010; relative sea level: Rohling et al., Reference Rohling, Grant, Bolshaw, Roberts, Siddall, Hemleben and Kucera2009; proportion of hemipelagic mud in core MD96-2094: Stuut et al., Reference Stuut, Prins, Schneider, Weltje, Jansen and Postma2002). Values of Pearson’s correlation coefficient (r) between −0.3 and +0.3 are considered “weak” correlation, values of −0.5 to −0.3 and 0.3 to 0.5 are “moderate”, and values between −1 and −0.5 and from 0.5 to 1 are considered “strong”. Significant correlation is generally assumed for P values below 0.01.
Because of the strong smoothing performed by the spline functions, the correlation coefficients represent only the compatibility of overall trends and cannot be interpreted in terms of a correlation of the actual measured data.
RESULTS
Dating results
Ages used for the construction of age models in this study range between 329.6 ± 7.9 ka (46322-B) and 130.2 ± 1.1 ka (142819-A) for Staircase Cave and from 111.4 ± 1.2 ka (46745-A1) to 41.5 ± 2.1 ka (46747-a) for PP29. Out of the 104 age analyses performed on the samples from PP29 and Staircase Cave, 5 had 2σ errors above 5% of the age value, and the highest error was 6.0% of its respective age. Plots of the age against depth for all samples are shown in Figures 2 and 3. Images of the samples are shown in Supplementary Figures 3 and 4.
Fully comprehensive sampling of Staircase Cave was not feasible as a result of it being a collapsed site. It is therefore possible that the samples recovered from the excavated residual parts of the site do not represent the complete deposition cycle.
Tests of stable isotopic equilibrium
The formation history of the sea caves at Pinnacle Point raises concerns that kinetic, rather than equilibrium, isotope effects may be affecting δ18Oc and δ13C, because it is unclear when the caves were fully closed or when they may have been partially ventilated. We therefore apply a combination of Hendy (Reference Hendy1971) tests and repetition tests (Dorale and Liu, Reference Dorale and Liu2009) to assess the closeness to isotopic equilibrium deposition of the speleothem samples.
The two Hendy tests (Hendy, Reference Hendy1971) made on one sample from PP29 (138862.2) and one from Staircase Cave (142819) do not show correlation of δ18Oc with δ13C along single growth layers (Supplementary Fig. 5a) suggesting slow CO2 degassing and carbonate deposition in isotopic equilibrium (Hendy, Reference Hendy1971). In addition, δ18Oc values do not increase along the laminae (Supplementary Fig. 5b) showing that evaporation was not substantial (Hendy, Reference Hendy1971).
Correlation of δ18Oc and δ13C along the main growth axis of a speleothem may reflect kinetic isotope effects (Hendy, Reference Hendy1971; Mickler et al., Reference Mickler, Stern and Banner2006). Such correlation, however, can also be caused by environmental changes that lead to simultaneous variations of δ18Oc and δ13C (e.g., Dorale and Liu, Reference Dorale and Liu2009; Bar-Matthews et al., Reference Bar-Matthews, Marean, Jacobs, Karkanas, Fisher, Herries and Brown2010). Three records from Staircase Cave (46330a, 50100, and 142819; Supplementary Fig. 6) and two records from PP29 (138862.2b and 142828; Supplementary Fig. 7) show strong and significant positive correlations between δ18Oc and δ13C (r>0.5, P<0.01).
For the repetition test, the stable isotopic records of coeval samples from the same cave or region are directly compared with each other. Although this test is emerging as a new standard for the assessment of isotopic equilibrium, speleothem studies rarely include more than two or three coeval samples (e.g., Boch et al., Reference Boch, Spötl and Kramers2009; Stríkis et al., Reference Stríkis, Cruz, Cheng, Karmann, Edwards, Vuille, Wang, de Paula, Novello and Auler2011; Cheng et al., Reference Cheng, Sinha, Cruz, Wang, Edwards, D’Horta, Ribas, Vuille, Stott and Auler2013b; Kanner et al., Reference Kanner, Buenning, Stott, Timmermann and Noone2014; Lachniet, Reference Lachniet2015; Oster et al., Reference Oster, Montañez, Santare, Sharp, Wong and Cooper2015). Our study includes seven records from Staircase Cave and eight from PP29, all of which have highly variable resolutions and age uncertainties. Nevertheless, differences between δ18Oc values of coeval samples are usually less than 1.0‰ (Fig. 4a and d). There also is a good overlap of the overall trends for the δ13C values (Fig. 4b and e), suggesting that minor offsets between samples may be related to differences of the growth rate and age errors. In view of the good overlap for both isotopes, we assume that kinetic isotope effects represent a minor influence at Staircase Cave and PP29, at least for time intervals covered by several samples. Furthermore, we chose a method of composite record construction (described in the following section) that accounts for the minor differences between individual samples and smooths them into a record that represents overall environmental trends.

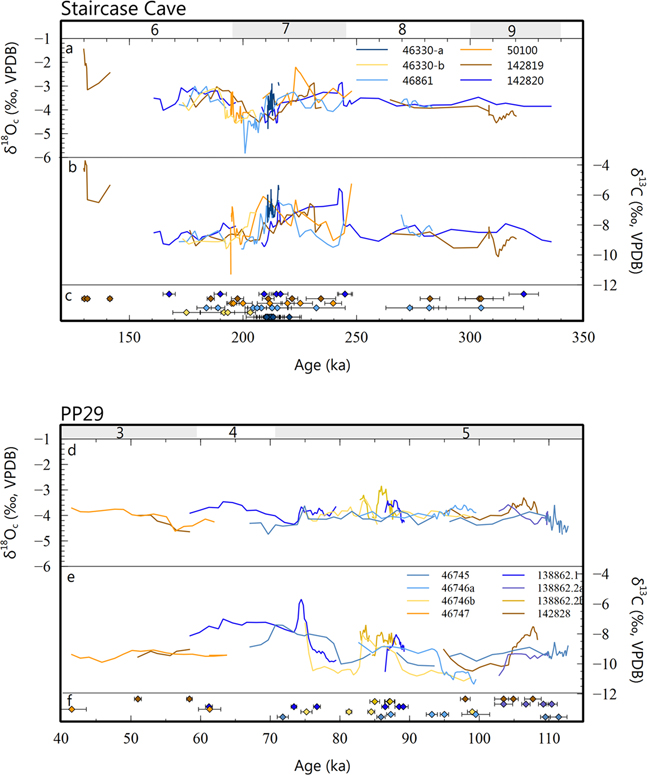
Figure 4 (color online) δ18Oc and δ13C of all samples from Staircase Cave (a, b) and PP29 (d, e). In panels c and f, measured age results with 2σ errors are shown. The different samples from the same cave site show good compatibility of δ18Oc and δ13C values and trends. Numbers at the top of the panels denote Marine Oxygen Isotope Stages. VPDB, Vienna Pee Dee belemnite.
Composite record construction
We created composite records of stable isotopes at each site by chronologically merging records from all speleothems using the estimated ages given by each record’s age model. Stable isotopic values were smoothed with a 3-point running mean to reduce local noise following a modified approach described by Williams et al. (Reference Williams, King, Zhao and Collerson2005). Because our speleothem samples often cover different time intervals and have variable resolutions, we did not adjust them to a common mean as done by Williams et al. (Reference Williams, King, Zhao and Collerson2005). We estimate the confidence intervals around the 3-point running mean of the δ18Oc and δ13C values by bootstrapping with replacement over 1000 iterations. We calculated the 5th and 95th percentiles for the δ18Oc and δ13C of the composite records and plotted them, along with the 3-point running mean and original values, in Figure 5. Periods with the greatest precision of isotope values were observed where the growth of multiple speleothems overlapped and where temporal resolution was highest, such as the period between 220 and 190 ka.
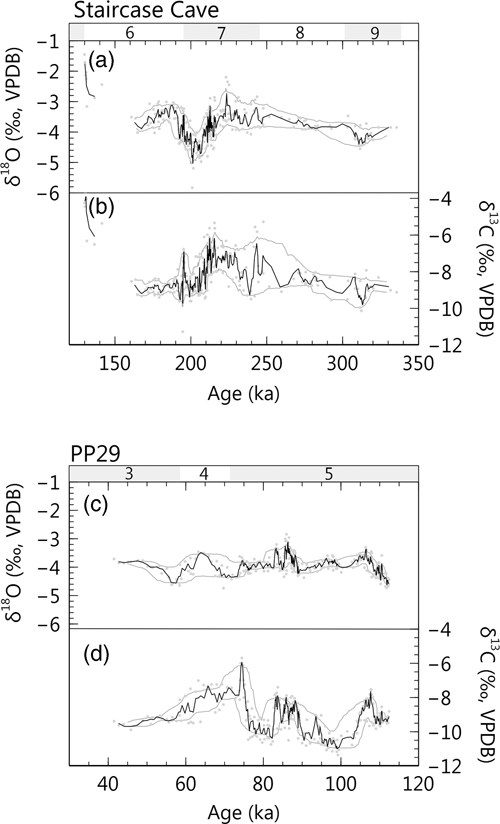
Figure 5 Three-point running mean composite δ18Oc and δ13C records of Staircase Cave (a) and PP29 (b) with 5th and 95th percentile confidence intervals constructed using 1000 iterations of bootstrapping with replacement. All individual isotope analyses are shown in gray. Numbers at the top of the panels denote Marine Oxygen Isotope Stages. VPDB, Vienna Pee Dee belemnite.
Staircase Cave
The composite stable isotopic record of Staircase Cave covers the period from 330 to 130 ka (Fig. 5a, Supplementary Table 2); it includes a total of 291 δ18Oc and δ13C analyses. There is no chronological overlap of the Staircase Cave record with those of PP29 and Crevice Cave (Bar-Matthews et al. Reference Bar-Matthews, Marean, Jacobs, Karkanas, Fisher, Herries and Brown2010). δ18Oc and δ13C values of the smoothed record range mostly from −5.0‰ to −2.7‰ and from −9.8‰ to −6.2‰, respectively. A short interval at the transition between Marine Oxygen Isotope Stage (MIS) 6 and MIS 5 has exceptionally high values of δ18Oc (−2.8‰ to −1.8‰) and δ13C (−6.1‰ to −3.9‰).
In MIS 9 and 8 (330–250 ka), values of δ18Oc generally show small variations between −4.4‰ and −3.4‰. δ13C values mostly range between −9.8‰ and −7.8‰. At the transition from glacial MIS 8 into interglacial MIS 7, δ18Oc and δ13C increase from −3.8‰ to −3.2‰ and from −8.8‰ to −6.5‰, respectively (Fig. 5a, Supplementary Table 2). The δ18Oc values in early MIS 7 (245–217 ka) are between −3.8‰ and −3.1‰ with a short peak of −2.7‰ between 226 and 223 ka. In late MIS 7 (217–206 ka), δ18Oc values gradually decrease from −2.8‰ to −4.7‰, and they remain low (−4.2‰) until the beginning of MIS 6 (195 ka). Values of δ13C show larger variability in early MIS 7 than in MIS 9 and MIS 8, between −9.3‰ and −6.2‰. In late MIS 7 (211–200 ka), δ13C values gradually decrease from −6.2‰ to −9.1‰.
After the decrease in late MIS 7, and in the early part of MIS 6 (203–163 ka), δ13C values mostly remain low and stable between −8.4‰ and −9.7‰. Values of δ18Oc increase gradually from the low values in late MIS 7 (approximately −4.7‰) into early MIS 6 (−3.1‰ at 187 ka). δ18Oc values are −3.7‰ at the onset of the hiatus in deposition at 163 ka. In the interval following the hiatus between 137 and 130 ka, both δ18Oc and δ13C have high values and show increasing trends (δ18Oc: −2.8‰ to −1.8‰; δ13C: −6.1‰ to −3.9‰). Because this interval is covered only by one sample, it may not reflect average conditions at the site and kinetic effects may be affecting these extraordinary values.
PP29
The composite stable isotopic record of PP29 (Fig. 5b, Supplementary Table 2) covers the interval between 112 and 43 ka and is based on 280 isotopic analyses. δ18Oc and δ13C values vary from −4.6‰ to −3.1‰ and from −11.0‰ to −5.9‰, respectively.
In late MIS 5, between 112 and 74 ka, δ18Oc in PP29 shows irregular variations, between −4.6‰ and −3.0‰. Values of δ13C cyclically vary between −11.0‰ and −7.6‰ for most of late MIS 5, with high values (approximately −8.0‰) at 107 ka and 88–83 ka. The transition from MIS 5 into MIS 4 at ~76–74 ka is marked by a steep increase of the δ13C values from −10.0‰ to −5.9‰ (Fig. 5b, Supplementary Table 2) and a less pronounced peak of the δ18Oc record (−3.8‰). During MIS 4, δ18Oc values gradually increase from −4.3‰ to −3.5‰, whereas δ13C values remain high (between −8.2‰ and −7.2‰). At the transition from MIS 4 into MIS 3, δ18Oc and δ13C decrease from −3.5‰ (at 64 ka) to −4.6‰ (at 58 ka) and from −7.3‰ to −9.3‰, respectively. In early MIS 3, between 57 and 43 ka, δ18Oc values increase from −4.5‰ to −3.8‰, whereas δ13C remains stable (between −9.7‰ and −9.2‰).
DISCUSSION
Factors influencing the speleothem stable isotope records
Controls of speleothem δ18Oc values
The main controls of δ18Oc are the cave temperature and the δ18O of cave water at the time of speleothem formation. Because of the dense fracture system in the host rock at Pinnacle Point, water infiltrates quickly (Karkanas and Goldberg, Reference Karkanas and Goldberg2010), and cave water δ18O thus most likely reflects the δ18Op of local rainfall without effects of evaporation.
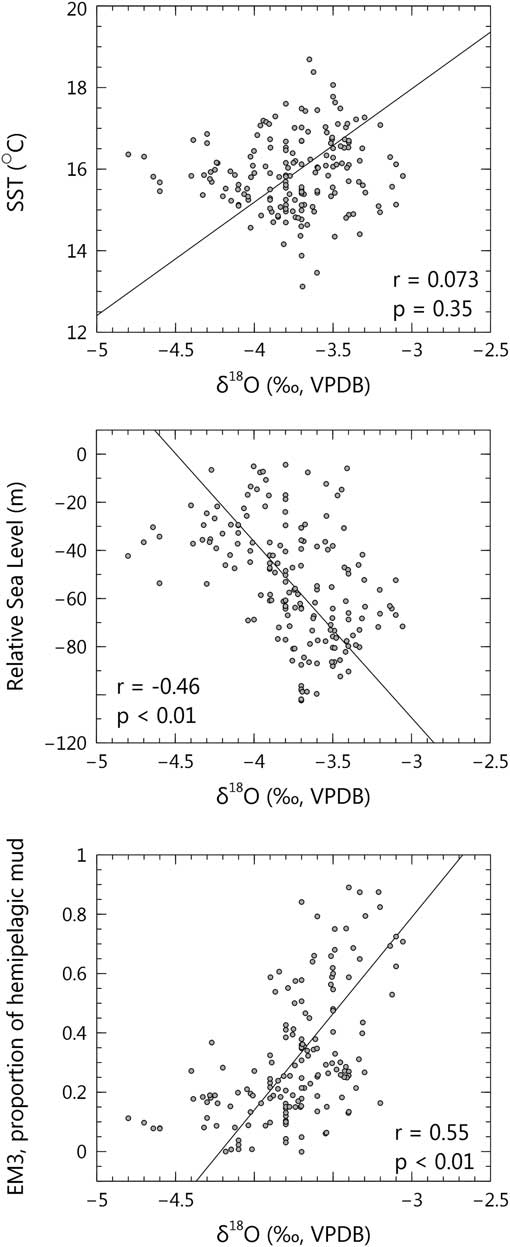
Temperature has a dual impact on δ18Oc: an indirect effect attributable to the temperature dependence of fractionation between water vapor and raindrops in the atmosphere, and the direct effect attributable to the temperature dependence of fractionation between drip water and carbonate inside the cave. The temperature of a cave is close to the mean annual surface temperature of the region in which it is situated. However, resampled δ18Oc values from Staircase Cave show no correlation with SST from the Cape Basin (cores MD02-2594 and MD96-2080; r=0.073, P=0.35; Figs. 1a and 6a; Martínez-Méndez et al., Reference Martínez-Méndez, Zahn, Hall, Peeters, Pena, Cacho and Negre2010). If oceanic temperatures are taken as a first approximation for terrestrial temperatures in the coastal region (see Bar-Matthews et al., Reference Bar-Matthews, Ayalon, Gilmour, Matthews and Hawkesworth2003; Almogi-Labin et al., Reference Almogi-Labin, Bar-Matthews, Shriki, Kolosovsky, Paterne, Schilman, Ayalon, Aizenshtat and Matthews2009, for the Mediterranean region), then changes in δ18Oc are not correlated with land temperature variation. Some other factor must be overriding the temperature effect.

Figure 6 Scatter plots of the exponential spline smoothed and resampled record of δ18Oc from Staircase Cave against the sea surface temperature (SST) records reconstructed using Mg/Ca ratios of Globigerina bulloides from sediment cores MD02-2594 and MD96-2080 (a; Martínez-Méndez et al., Reference Martínez-Méndez, Zahn, Hall, Peeters, Pena, Cacho and Negre2010); relative sea level (b; Rohling et al., Reference Rohling, Grant, Bolshaw, Roberts, Siddall, Hemleben and Kucera2009); and the river-derived sediment size fraction of core MD96-2094 (c; Stuut et al., Reference Stuut, Prins, Schneider, Weltje, Jansen and Postma2002). Only the longest continuous growth period of speleothems at Pinnacle Point (between 328 and 163 ka) was included in these analyses. Data sets were resampled at 1 ka intervals. Regression lines were calculated using reduced major axis regression. EM3, end member 3; VPDB, Vienna Pee Dee belemnite.
Variations of global sea level may affect δ18Oc through changes in relative altitude of the cave and the distance to the sea. Both factors potentially decrease the δ18Op during phases of low sea level compared with sea level high stands (Rozanski et al., Reference Rozanski, Araguás-Araguás and Gonfiantini1993; Poage and Chamberlain, Reference Poage and Chamberlain2001; Winnick et al., Reference Winnick, Chamberlain, Caves and Welker2014). The overall trends of the smoothed δ18Oc record from the longest continuous growth period at Staircase Cave (between 331 and 163 ka), however, show only a weak negative correlation with sea level (r=−0.46, P<0.01; Fig. 6b; Rohling et al., Reference Rohling, Grant, Bolshaw, Roberts, Siddall, Hemleben and Kucera2009), implying that low δ18Oc values are not associated with low sea levels and that there is a negligible effect of sea level change.
Globally, the most important factors influencing δ18Op are temperature (in temperate regions) and rainfall amount (in the tropics). Given its location between temperate and tropical climate regions, the complex patterns of rainfall seasonality across South Africa have a profound effect on δ18Op. In Pretoria, in the summer rainfall region, δ18Op shows the correlation with rainfall amount that is characteristic for tropical rainfall (Braun et al., Reference Braun, Bar-Matthews, Ayalon, Zilberman and Matthews2017). In contrast, in Cape Town, in the coastal Mediterranean climate region, there is only minor correlation of δ18Op with both temperature and rainfall amount (Bowen, Reference Bowen2008; Braun et al., Reference Braun, Bar-Matthews, Ayalon, Zilberman and Matthews2017). Rainfall in the South African year-round rainfall region is a synoptically complex combination of tropical, subtropical, and temperate atmospheric pressure systems (Engelbrecht et al., Reference Engelbrecht, Landman, Engelbrecht and Malherbe2015; Engelbrecht and Landman, Reference Engelbrecht and Landman2016).
Modern rainfall sampling at Mossel Bay in the year-round rainfall region during a 4 yr period (2009–2012) when winter rainfall dominated interannual variability reveals similar low correlation between δ18Op and temperature/rainfall amount as at Cape Town (Braun et al., Reference Braun, Bar-Matthews, Ayalon, Zilberman and Matthews2017). However, the amplitude of seasonal δ18Op variations is more than twice as high in Mossel Bay (4.8‰) than at Cape Town (2.2‰). Braun et al. (Reference Braun, Bar-Matthews, Ayalon, Zilberman and Matthews2017) attribute this larger amplitude to the seasonal variations in the complex synoptic conditions influencing precipitation in the year-round rainfall region. Temperate cold fronts, which are a major source for rain in the winter rainfall region, only contribute 5% of the rainfall on the south coast (Engelbrecht et al., Reference Engelbrecht, Landman, Engelbrecht and Malherbe2015). More significant contributions are from ridges of the South Atlantic Anticyclone to the southwest of the continent (46%), tropical temperate troughs (28%), and troughs to the southeast of the continent (8%; Engelbrecht et al., Reference Engelbrecht, Landman, Engelbrecht and Malherbe2015). Ridging anticyclones do not contribute much to seasonality, because they occur all year-round (Fig. 7a; Engelbrecht and Landman, Reference Engelbrecht and Landman2016). Tropical temperate troughs peak in late summer (January–April, Fig. 7a) and are associated with strong convection (Fig. 7a; Todd and Washington, Reference Todd and Washington1999; Engelbrecht and Landman, Reference Engelbrecht and Landman2016). High-altitude condensation leads to high values of δ18Op of convective clouds, and large drop sizes prohibit isotopic equilibration with surrounding vapor as the drops fall (Aggarwal et al., Reference Aggarwal, Romatschke, Araguás-Araguás, Belachew, Longstaffe, Berg, Schumacher and Funk2016). Troughs to the southeast occur most frequently in the winter months (June–September, Fig. 7a; Engelbrecht and Landman, Reference Engelbrecht and Landman2016) and mostly bring stratiform rainfall. The condensation altitude is lower in stratiform clouds, and the size of raindrops is smaller than in convective clouds; raindrops therefore have a lower δ18Op to begin with and exchange more easily with vapor at low atmospheric levels, which leads to even lower δ18Op values (Aggarwal et al., Reference Aggarwal, Romatschke, Araguás-Araguás, Belachew, Longstaffe, Berg, Schumacher and Funk2016). The combination of seasonality of major synoptic types and the type of rain clouds they bring therefore leads to the large seasonal amplitude of δ18Op in the South African year-round rainfall region (Fig. 7b; Braun et al., Reference Braun, Bar-Matthews, Ayalon, Zilberman and Matthews2017).
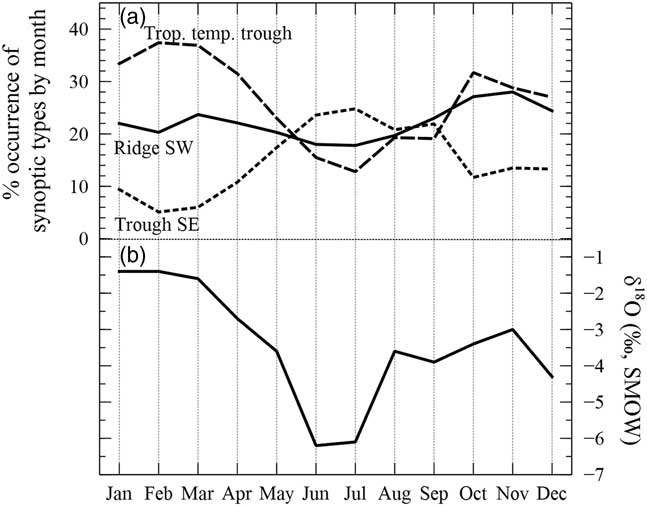
Figure 7 Monthly averages of the occurrence percentage of main circulation types (a; Engelbrecht and Landman, Reference Engelbrecht and Landman2016) compared with monthly average δ18O of rainfall at Mossel Bay (b; Braun et al., Reference Braun, Bar-Matthews, Ayalon, Zilberman and Matthews2017). SMOW, standard mean ocean water.
The modern-day synoptically controlled variations in δ18Op, together with the absence of evidence for cave temperature correlations with δ18Op, suggest that rainfall seasonality was a major factor of δ18O variation. Changes of summer insolation, equator-to-pole insolation gradients, and polar ice volume on orbital timescales bring about changes in the strength and position of the continental summer heat low, the Southern Hemisphere westerlies, and the anticyclones in the South Atlantic and South Indian Oceans (Bradley, Reference Bradley2015, p. 42). These variations could result in a change of the contributions of rainfall from different synoptic conditions on the south coast, which in turn would affect the δ18Oc of cave speleothems through changes in δ18Op. These issues will be examined in detail in the following sections, whereby, based on the modern-day pattern, shifts to higher δ18Oc values will be taken to reflect a trend to more convective summer rainfall and lower δ18Oc values to more stratiform winter rainfall.
Controls of the speleothem δ13C values
Speleothem δ13C values mainly reflect the δ13C of soil CO2 and the carbonate source material (Bredasdorp Group eolianites, calcarenites, and calcretes). In closed system conditions, where the solution is removed from contact with the soil atmosphere once it gets into contact with the carbonate source, the host rock contributes up to 50% of the carbon in the solution. However, in the porous carbonate sources in the eolianites and calcretes and the highly fractured quartzite host rock of the caves, it is likely that the solution is always in contact with the infinite reservoir of soil CO2, which would drive the isotopic composition of the dissolved bicarbonate toward the δ13C of the soil gas reservoir.
δ13C values of soil CO2 can be affected by a range of factors such as plant root respiration, microbial activity, and organic matter decay, all of which depend on the availability of water in the soil. Decrease in water availability would lead to reduced plant root respiration and microbial activity, as well as lower vegetation density. The δ13C values of soil CO2 would therefore shift toward higher values representative of atmospheric CO2 rather than biogenic CO2 (Baldini et al., Reference Baldini, McDermott, Baker, Baldini, Mattey and Railsback2005; Williams et al., Reference Williams, King, Zhao and Collerson2005; Genty et al., Reference Genty, Blamart, Ghaleb, Plagnes, Causse, Bakalowicz and Zouari2006). Such a process is, however, most likely limited to high-latitude regions (or possibly the edges of deserts) where dramatic changes in the vegetation density lead to decreases in subsurface CO2 concentrations to less than five times that of the atmosphere (Wong and Breecker, Reference Wong and Breecker2015). Furthermore, low water availability would also decrease speleothem growth rates (Genty et al., Reference Genty, Baker and Vokal2001), yet high δ13C periods in our record (e.g., ~230–210 ka or 98–83 ka) show the coeval deposition of several speleothem samples at high temporal resolution. A reduction of water availability is also thought to cause the precipitation of calcite prior to the drip water entering the cave (prior calcite precipitation [PCP]; Fairchild et al., Reference Fairchild, Borsato, Tooth, Frisia, Hawkesworth, Huang, McDermott and Spiro2000). Effects of degassing and PCP in the bedrock are unlikely in the quartzite host rock because infiltration of the water through the dense fracture system is fast (Karkanas and Goldberg, Reference Karkanas and Goldberg2010).
The alternative control of soil CO2 δ13C is vegetation type. In areas where the ranges of C3, C4, and CAM plants overlap (as on the South African south coast), changes in the proportions of these plants in the vegetation above the cave are important influences on speleothem δ13C (e.g., Talma and Vogel, Reference Talma and Vogel1992; Holmgren et al., Reference Holmgren, Lee-Thorp, Cooper, Lundblad, Partridge, Scott, Sithaldeen, Talma and Tyson2003; Bar-Matthews et al., Reference Bar-Matthews, Marean, Jacobs, Karkanas, Fisher, Herries and Brown2010). Although C3 and C4 plants have distinct δ13C values (C3: −29‰ to −22‰; C4: −16‰ to −10‰), the δ13C of CAM plants can overlap with the range of C3 or C4 plants depending on whether they are obligate CAM plants (only CAM photosynthesis; δ13C: −10.6‰ to −18.7‰) or facultative CAM plants (possible switches between CAM and C3; δ13C: −16.7‰ to −27.6‰; Williams, Reference Williams2015). Although CAM plants do occur in the vicinity of Pinnacle Point, they only become the dominant ground cover in the succulent karoo biome (Midgley and van der Heyden, Reference Midgley and van der Heyden1999). The transition from the fynbos biome to the succulent karoo biome occurs in areas with ~200–300 mm of annual rainfall (Rebelo et al., Reference Rebelo, Boucher, Helme, Mucina and Rutherford2006). In semiarid regions of Israel, speleothem deposition only occurs when rainfall amount exceeds 300 mm (Vaks et al., Reference Vaks, Bar-Matthews, Ayalon, Matthews, Frumkin, Dayan, Halicz, Almogi-Labin and Schilman2006). Assuming that a similar amount of annual rainfall would be required for speleothem deposition at Pinnacle Point, it is unlikely that CAM plants were a dominant proportion in the vegetation while speleothems were forming.
Another GCFR vegetation type with common, mainly facultative, CAM plants that may have colonized the cave area is subtropical thicket. The main difference between the climatic and environmental conditions of subtropical thicket and fynbos is the frequency of fires, which is much lower in thicket (Hoare et al., Reference Hoare, Mucina, Rutherford, Vlok, Euston-Brown, Palmer and Powrie2006; Rebelo et al., Reference Rebelo, Boucher, Helme, Mucina and Rutherford2006). Low fire frequencies are found where rainfall is plenty and occurs year-round. The facultative CAM succulents in the thicket vegetation would therefore perform C3 photosynthesis (Williams, Reference Williams2015), and the thicket vegetation would be indistinguishable from other C3-dominated GCFR communities.
Values of δ13C of soil CO2 therefore are changing mostly dependent on the abundance of C3 and C4 plants in the vegetation above the cave. The larger rooting depth of C3 trees compared with C4 grasses has been shown to bias the δ13C in cave air CO2 toward values representative of C3 vegetation (Wong and Breecker, Reference Wong and Breecker2015). Such effects are unlikely in the fynbos biome, because trees are rare (Rebelo et al., Reference Rebelo, Boucher, Helme, Mucina and Rutherford2006) and the rooting depths are generally shallow (Higgins et al., Reference Higgins, Lamb and van Wilgen1987). Thicket vegetation may have considerable abundances of trees (Vlok et al., Reference Vlok, Euston-Brown, Cowling and Hoffman2003); however, this vegetation type would have a dominant C3 signal also without a bias by deep roots (see Regional environment and cave formation).
Using the average measured values of δ13C for C3 (−24.5‰) and C4 (−13.0‰) plants in the GCFR compiled by Williams (Reference Williams2015), and the enrichment factor between CO2 and carbonate (10.35‰) from Emrich et al. (Reference Emrich, Ehhalt and Vogel1970) and Hendy (Reference Hendy1971) at the average present-day temperature at Mossel Bay (17.5°C; National Climatic Data Center, National Oceanic and Atmospheric Administration, 2016), pure C3 vegetation in open system conditions (constant equilibration between solutes and soil CO2) would result in speleothem δ13C of −14.2‰; in pure C4 vegetation, speleothem δ13C would be −2.7‰. The boundary for mixed vegetation with 50% C3 and 50% C4 vegetation (δ13C of organic matter of approximately −18.75‰) would be at −8.4‰.
In the alternative calculation for closed conditions (limited contact between infiltrating water and soil CO2 once carbonate is being dissolved) involving stoichiometric dissolution between eolianite with marine carbonates (δ13C ~1‰), C3 vegetation or C4 vegetation gives end member δ13C values of −13.0‰ for 100‰ C3 vegetation and –4.3‰ for 100‰ C4 vegetation. In this case, the δ13C of the transition from C3-dominated to C4-dominated vegetation would be −8.6‰ and thus close to the open system conditions. Carbonate in the solution in this region may, however, also originate from calcretes with δ13C values between 0‰ and −8‰ (Talma and Netterberg, Reference Talma and Netterberg1983). A combination of the marine carbonates with calcretes as the carbonate source would shift the expected δ13C value for speleothems under mixed vegetation toward more negative values. However, the stoichiometric reaction model calculation is not consistent with the rapid downward penetration of solution through the host rock (Karkanas and Goldberg, Reference Karkanas and Goldberg2010), which would preferentially take up the labile soil CO2. We therefore regard the open system model to give a better approximation of the speleothem δ13C values of mixed C3/C4 vegetation.
Variations of atmospheric CO2 concentrations can affect speleothem δ13C by changing the δ13C values of C3 plants and by affecting their growth rate. Lower atmospheric CO2 concentrations generally would lead to higher δ13C values in the C3 plant tissue (Breecker, Reference Breecker2017), and the decreased growth rates caused by low atmospheric CO2 could also cause a shift of the vegetation from C3 to C4 plants. Both these effects would lead to a negative correlation between the speleothem δ13C and the concentrations of atmospheric CO2. The δ13C records from PP29 (r=−0.20, P=0.10) and Staircase Cave (r=0.07, P=0.38) show weak correlation with atmospheric CO2 concentration suggesting that the δ13C variations we observe are not primarily caused by changes of atmospheric CO2 but are in fact caused by changes of the vegetation composition related to other environmental drivers. Present-day distributions of C3 and C4 grasses are determined mainly by the temperature during the main rainfall season (Vogel et al., Reference Vogel, Fuls and Ellis1978; Cowling, Reference Cowling1983). On orbital timescales, it is also likely that the proportions of C3 and C4 plants on the south coast vary in phase with temperature and shifts in the main rainfall season. Consistent with the calculations presented previously, an increase of C4 grasses in the vegetation, which would increase speleothem δ13C, could be caused by either an overall increase of temperature or a shift of the rainfall seasonality toward more summer rainfall, or both. A dominance of C3 plants would be indicated by lower δ13C values.
Environmental interpretation of the combined δ18Oc and δ13C records
To place the speleothem record within its wider regional environmental context, we address the potential connections between the δ18Oc and δ13C data and four other proxy records: temperature reconstructions for the Dome C ice core from Antarctica (Jouzel et al., Reference Jouzel, Masson-Delmotte, Cattani, Dreyfus, Falourd, Hoffmann and Minster2007), SST reconstructions at the location of sediment core MD96-2077 on the southern border of the Agulhas Current in the Indian Ocean (Bard and Rickaby, Reference Bard and Rickaby2009), the fraction of hemipelagic mud in sediment core MD96-2094 on Walvis Ridge (southeast Atlantic Ocean; Stuut et al., Reference Stuut, Prins, Schneider, Weltje, Jansen and Postma2002), and the reconstruction of shifts of the STC from the Cape Basin record (CBR; sediment cores GeoB-3603-2 and MD96-2081; Peeters et al., Reference Peeters, Acheson, Brummer, de Ruijter, Schneider, Ganssen, Ufkes and Kroon2004; Fig. 1). The hemipelagic mud on Walvis Ridge originates from nepheloid layers from the Orange River or ephemeral rivers draining the central Namib Desert and thereby is related to the amount of runoff from these rivers and rainfall amount in their drainage basins (Stuut et al., Reference Stuut, Prins, Schneider, Weltje, Jansen and Postma2002). The Orange River basin covers large parts of the South African interior plateau (Fig. 1), and its runoff reflects rainfall amounts in large areas of the interior. The proximity of the STC to the CBR sites (Fig. 1) was derived by Peeters et al. (Reference Peeters, Acheson, Brummer, de Ruijter, Schneider, Ganssen, Ufkes and Kroon2004) using three planktonic foraminifera species: Globorotalia inflata and Neogloboquadrina pachyderma (dex.), currently occurring in waters just south of the STC, and Globorotalia truncatulinoides, which is found just north of it. The ratio of G. truncatulinoides/[N. pachyderma (dex.) + G. inflata + G. truncatulinoides] was used as the proxy for the STC position relative to the sediment core sites. A shift of this oceanic convergence is most likely related to a shift of the latitudinal position of the westerly winds (Bard and Rickaby, Reference Bard and Rickaby2009).
The speleothem records and temperature proxy records are plotted together in Figure 8. Using the reasoning previously laid out for the relations of δ18Oc with rainfall systems and δ13C with proportions of C3 and C4 plants, we first examine the time trends in the speleothem data (Fig. 8d and e) and then how they compare with the other proxy records (Fig. 8a–c, f, and g). Our objective is to assess the correlations (or lack of) between the speleothem δ18Oc and δ13C series and temperature proxy records, and the changes in the runoff of the Orange River. Correspondingly, we determine the connections between rainfall type (stratiform or convective) on the south coast with runoff from the Orange River and the position of the STC.
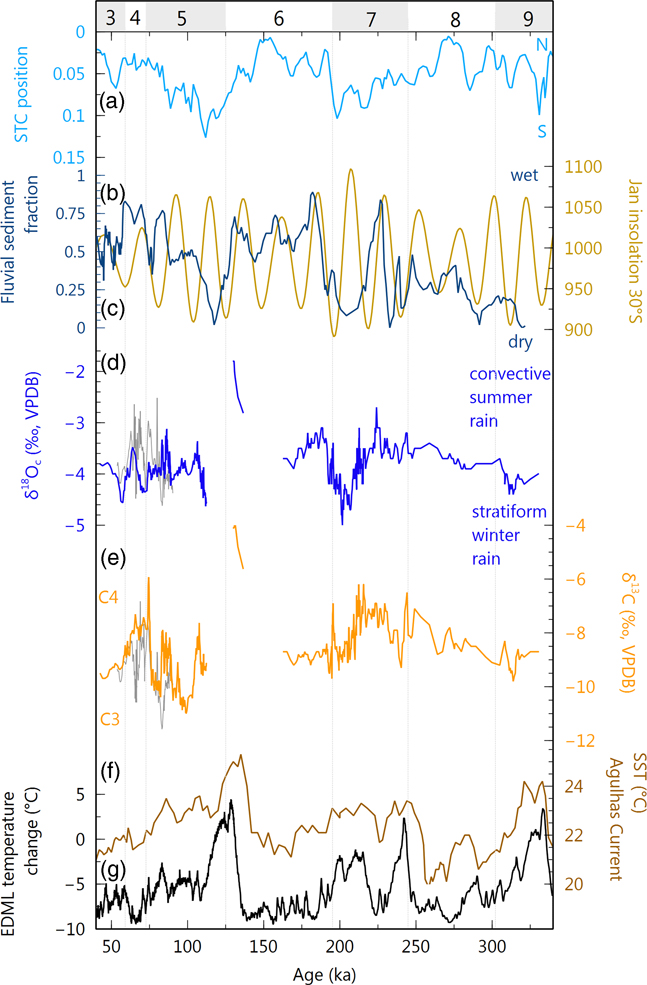
Figure 8 Comparison of the stable isotopic records from Staircase Cave and PP29 with other proxy records. (a) Reconstruction of the position of the subtropical convergence (STC) using the abundances of planktonic foraminifera found to the north and south of its present position (Peeters et al., Reference Peeters, Acheson, Brummer, de Ruijter, Schneider, Ganssen, Ufkes and Kroon2004). (b) Proportion of end member 3 in the dust fraction of sediment core MD96-2094 (dark blue); this smallest size fraction originates from river runoff of the Orange River and the Central Namib Desert and reflects changes in rainfall amounts in the southern African interior (Stuut et al., Reference Stuut, Prins, Schneider, Weltje, Jansen and Postma2002). (c) Summer insolation (January) at 30°S (brown; Laskar et al., Reference Laskar, Robutel, Joutel, Gastineau, Correia and Levrard2004). (d) δ18Oc of speleothems from Pinnacle Point: Staircase Cave and PP29 in blue, Crevice Cave in gray. (e) δ13C of speleothems from Pinnacle Point: Staircase Cave and PP29 in orange, Crevice Cave in gray. Records of Crevice Cave from Bar-Matthews et al. (Reference Bar-Matthews, Marean, Jacobs, Karkanas, Fisher, Herries and Brown2010). (f) Sea surface temperature (SST) in the southwest Indian Ocean on the southern edge of the Agulhas Current (Bard and Rickaby, Reference Bard and Rickaby2009). (g) Reconstruction of temperature changes relative to today at Antarctic European Project for Ice Coring in Antarctica Dronning Maud Land ice core (Jouzel et al., Reference Jouzel, Masson-Delmotte, Cattani, Dreyfus, Falourd, Hoffmann and Minster2007). Numbers at the top of the figure denote Marine Oxygen Isotope Stages. VPDB, Vienna Pee Dee belemnite. (For interpretation of the references to color in this figure legend, the reader is referred to the web version of this article.)
Modern climate and environmental conditions predict that δ18Oc and δ13C move in concert when rainfall seasonality and vegetation shift in phase (see the “Factors influencing the speleothem stable isotope records” section; Bar-Matthews et al., Reference Bar-Matthews, Marean, Jacobs, Karkanas, Fisher, Herries and Brown2010). Such conditions are suggested by the covariation of δ18Oc and δ13C values from ~320 ka in MIS 9 to the boundary between MIS 7 and 6 at ~195 ka (Fig. 5). Thus, as the relative amount of summer rain in the form of convective rainfall increases in this interval, the abundance of C4 grasses concurrently increases and vice versa. The relationship is disturbed in the early half of MIS 6 (195–163 ka, Fig. 5), when the relative amount of convective rainfall increases, but no increase of C4 grasses is detected. After a hiatus in deposition, speleothem formation resumes between ~136 and 130 ka. In this interval at the transition from MIS 6 into MIS 5, δ18Oc and δ13C again follow the expected correlation (Fig. 5). This marks the end of deposition at Staircase Cave, which was likely undercut by the MIS 5e sea level high stand and collapsed. Speleothem deposition in PP29 lasted between 112 and 43 ka, but δ18Oc and δ13C are not correlated in this interval (Fig. 5). The contemporaneous record from Crevice Cave has higher amplitude variability and a good correlation between δ18Oc and δ13C (Bar-Matthews et al., Reference Bar-Matthews, Marean, Jacobs, Karkanas, Fisher, Herries and Brown2010).
δ18Oc and δ13C values are low to intermediate for most of the covered period in MIS 9 and 8 suggesting overall mixed rainfall influences and vegetation. Uniform values of the speleothems in this interval might in part be related to low resolution that smooths the environmental signals. However, it appears that not even the temperature decrease from peak interglacial MIS 9 to the coldest part of MIS 8 (decrease of ~4°C of SST in MD96-2077 and decrease of ~12°C in EDML) induces a significant trend in the speleothem δ18Oc and δ13C. Only one low of δ18Oc and δ13C at 312 ka deviates from the uniform values and suggests increased amounts of stratiform rainfall and C3 vegetation. This δ18Oc and δ13C low coincides with decreasing temperatures in Antarctica and the Agulhas Current at the transition from MIS 9 into MIS 8 (Fig. 8f and g). Low river runoff from the Orange River indicated at 318 ka (Fig. 8b) and a southward position of the westerlies at 311 ka (Fig. 8a) might also be associated with this transition period.
The termination of MIS 8 and transition into interglacial MIS 7 is characterized by increases of both δ18Oc and δ13C suggesting a shift toward convective summer rain and more C4 grasses. These trends coincide with steep increases of temperature in Antarctica and the Agulhas Current, as well as a short peak of rainfall amounts in the interior and intermediate north–south position of the STC and westerlies (Fig. 8a, b, f, and g). A marked drop in Antarctic temperature and Agulhas Current SST (Fig. 8f and g) after the initial peak in MIS 7 is reflected in a decrease of the δ18Oc and δ13C values between ~241 and 228 ka. Correspondingly, rainfall amounts in the interior are reduced (Fig. 8b), but the STC remains in an intermediate position (Fig. 8a). The second half of MIS 7 is marked by a second, longer peak of temperature in Antarctica and the Agulhas Current from ~220 to 195 ka (Fig. 8f and g). Rainfall in the interior only shows a short peak between ~230 and 220 ka, which is followed by a steep decline and low amounts until the transition into MIS 6 (Fig. 8b). The location of the STC gradually shifts to a southward position between 201 and 196 ka (Fig. 8a). The speleothem δ18Oc and δ13C show some differences in later MIS 7. δ18Oc values follow closer with the rainfall amount suggesting a short peak of convective summer rainfall between 226 and 222 ka followed by a strong decrease and mostly stratiform rainfall between 210 and 196 ka. Values of δ13C vary more in line with temperature changes with relatively high proportions of C4 plants (δ13C>−7.5‰) between 230 and 210 ka. Between 210 and 198 ka, vegetation shifts toward a greater proportion of C3 plants.
In early–middle MIS 6, between 195 and 163 ka, consistent δ13C values of about −9‰ indicate more C3 plants than C4 grasses. Increase in δ18Oc values in the same interval indicates a gradual increase of the contribution of convective summer rainfall up until ~187 ka, after which the frequency of convective rainfall declines. The temperature record from Antarctica shows a steep decrease at the transition from MIS 7 into MIS 6, and temperatures remain low throughout MIS 6 (Fig. 8g). In comparison, the SST record from the Agulhas Current shows a stepwise decline of temperatures at ~190 ka and 170 ka (Fig. 8f). Rainfall in the interior is high during MIS 6 with short peaks at 182, 158, and 131 ka. The peak at 182 ka coincides with high amounts of convective summer rain on the south coast suggested by the speleothem δ18Oc values (Fig. 8b and d). The STC shows a rapid northward shift at the beginning of MIS 6 (196–190 ka) and remains in a northern to intermediate position throughout early–middle MIS 6 (Fig. 8a).
Following a hiatus, speleothem deposition in Staircase Cave resumed between 136 and 129 ka. The δ18Oc and δ13C values in this period are the highest for the whole record and show an increasing trend until cessation of speleothem growth. The exceptionally high values could suggest a pronounced environmental disturbance at the termination of glacial MIS 6, leading to high convective rainfall amounts and the dominance of C4 grasses. However, this time interval overlaps with the steep temperature increase at the glacial termination, a steep decrease of rainfall in the interior, and a rapid southward shift of the position of the STC (Fig. 8a, b, f, and g). This contrasts with the generally observed trends whereby high δ18Oc values overlap with high runoff from the interior and an intermediate to northern position of the STC and westerlies. It should be noted that this portion of the composite record is only covered by one sample (142819), and that, despite many attempts, we have not been able to find another sample that grew at this time. The possibility therefore remains that the collapse of Staircase Cave was foreshadowed in this interval by the opening of the cave site, leading to kinetic effects and increased values of δ18Oc and δ13C. The speleothem record from PP29 covers the interval between 112 and 43 ka and therefore embraces the deposition interval of the record of Crevice Cave (90–53 ka; Bar-Matthews et al., Reference Bar-Matthews, Marean, Jacobs, Karkanas, Fisher, Herries and Brown2010). The composite record for Crevice Cave was constructed by comparing the δ18Oc and δ13C of all available samples and their resolutions. The samples with the highest resolution and good visual comparability to other samples were then used to construct the composite record (Bar-Matthews et al., Reference Bar-Matthews, Marean, Jacobs, Karkanas, Fisher, Herries and Brown2010). Thus, differences in some of the details of the stable isotopic records from Crevice Cave and PP29 can be explained by the different methods used for composite record constructions. Nevertheless, the good overlap of overall trends firmly supports environmental influences as being the driving factors of these records.
During MIS 5, low δ13C values of less than −7.5‰ generally suggest that C3 plants dominate the vegetation; only two intervals have values indicating mixed vegetation at ~107 ka and between 89 and 83 ka. δ18Oc values show a consistent dominance of stratiform rainfall in MIS 5 with especially low values at the beginning of the PP29 record at 112 ka. Two intervals of increased contributions from convective summer rainfall are indicated at 106 and 87 ka. Both these periods coincide with peaks of SST in the Agulhas Current, whereas the Antarctic record only shows warm temperatures at 83 ka (Fig. 8f and g). Rainfall in the interior shows a distinct low between 123 and 113 ka when the STC is in a southern position (during stratiform rainfall). For the remainder of MIS 5, the interior receives intermediate rainfall amounts, except for a peak between 85 and 80 ka when the south coast received more convective summer rainfall (Fig. 8b and d). The position of the STC gradually shifts northward throughout MIS 5 (Fig. 8a). Low δ18Oc and δ13C values at Crevice Cave at 83 ka indicate dominant C3 vegetation and little convective rainfall.
During MIS 4, the temperature records show a clear cooling in Antarctica and the Agulhas Current. The speleothem records from PP29 and Crevice Cave suggest that there was mixed vegetation with relatively high proportions C4 grasses (δ13C>−8‰) and frequent convective summer rainfall. This pattern coincided with high amounts of rainfall in the interior and a northern position of the STC. In early MIS 3, low δ18Oc values at PP29 suggest a short interval dominated by stratiform winter rain (59–54 ka), but this was followed by an increase in the frequency of convective systems. Stable and low δ13C values suggest that C3 plants dominate the vegetation throughout the early part of MIS 3. At the same time, Antarctic temperature was stable, but Agulhas Current SST was cooling (Fig. 8f and g). Rainfall amounts in the interior are variable with intermediate values in early MIS 3 (Fig. 8b). The STC migrated from a northern to an intermediate position between 56 and 50 ka but then quickly returned north (Fig. 8a).
The time trends and comparisons described previously reveal a better compatibility of δ18Oc and δ13C from Pinnacle Point with rainfall amounts on the interior plateau than with temperature records from Antarctica and the Agulhas Current region. This pattern is supported by the correlation analyses of the spline smoothed records (r=0.55, P<0.001; Fig. 6a and c). The lack of a simple relationship with Antarctic temperature change attests to the complexities of glacial-interglacial climatic variations at the South African south coast. Our data do not support a simple model of glacial-interglacial climate change in which the northward shifted westerlies during glaciations cause an increase of winter rainfall and interglacial phases are characterized by increased summer rainfall (e.g., Van Zinderen Bakker, 1976, Reference Van Zinderen Bakker1983; Chase and Meadows, Reference Chase and Meadows2007). Rather, we find that peaks of convective summer rainfall in early and middle MIS 7, in early MIS 6, in middle MIS 5, and during MIS 4 generally overlap with peaks of rainfall in the South African interior. Phases dominated by stratiform rainfall occur in MIS 9, at the transition from MIS 7 to MIS 6 in early MIS 5 and at the transition from MIS 4 to 3 and generally coincide with drought in the interior during phases when the STC is in a southern position. Nearly always vegetation changes track the variations in rainfall systems. Only in MIS 6 convective summer rainfall increases, but the vegetation remains dominated by C3 plants rather than showing an increased abundance of C4 grasses.
Climatic controls on orbital timescales
The speleothem δ18Oc and δ13C records from Pinnacle Point indicate that past climate and environments varied considerably and that these variations do not follow a simple glacial-interglacial pattern. However, summer rainfall on the South African south coast is closely connected to total rainfall on the interior plateau. The connection between the two regions is most likely related to the occurrence of tropical temperate troughs forming major cloud bands when tropical lows link up with the westerlies. Such cloud bands are a major contributor of rainfall on the interior plateau (Tyson, Reference Tyson1986, p. 136 ff.) and on the south coast (Engelbrecht et al., Reference Engelbrecht, Landman, Engelbrecht and Malherbe2015). Their formation is dependent on a strong low pressure wave in the westerlies and moisture convergence in the tropics, which is favored by a strong continental heat low (Macron et al., Reference Macron, Pohl, Richard, Bessafi, Macron, Pohl, Richard and Bessafi2014).
The position of the westerly storm tracks shifts north and south, depending on the amount of sea ice off the coasts of Antarctica (Blamey and Reason, Reference Blamey and Reason2007). The larger variations of Antarctic sea ice extent on orbital timescales would amplify the latitudinal migration observed under present-day conditions (e.g., Chase and Meadows, Reference Chase and Meadows2007). Tropical low pressure systems like the Intertropical Convergence Zone and continental heat lows over the tropical southern African interior vary their position because of the influence of precession on summer insolation. During phases of high summer insolation in the Southern Hemisphere, these low pressure systems are strengthened and shifted toward a more southern position relative to intervals with lower summer insolation (e.g., Simon et al., Reference Simon, Ziegler, Bosman, Barker, Reason and Hall2015). Figure 8 shows that peaks of summer rain on the South African south coast generally overlap with high rainfall amounts in the interior and with phases of high summer insolation.
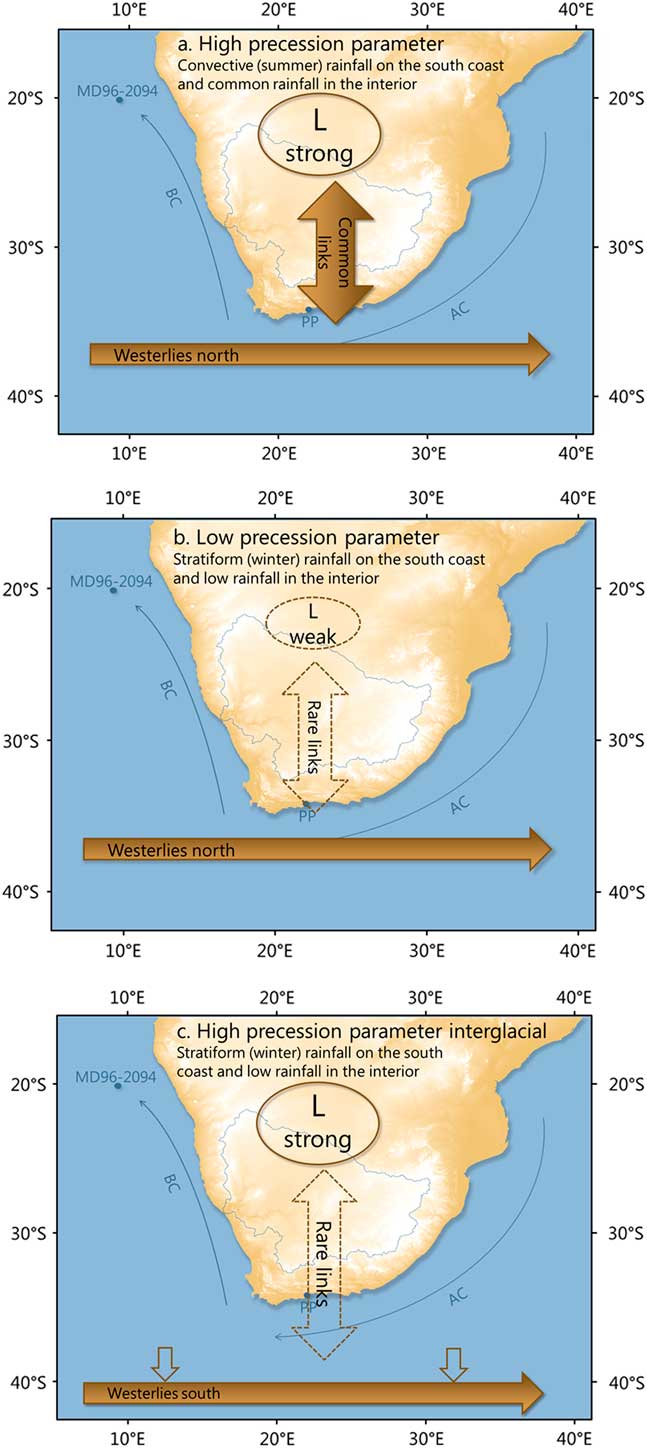
Especially during the first half of MIS 6 and MIS 4, the south coast shows the influence of summer convective rainfall when rainfall in the interior is increased during summer insolation peaks (Fig. 8b–d). Increased Antarctic sea ice during these glacial periods probably moved the STC and westerlies northward. At the same time, peaks of Southern Hemisphere summer insolation would shift the summer heat low in the interior southward and strengthen it. The combination of these two factors leads to good connectivity between tropical and temperate low pressure systems and the frequent occurrence of tropical temperate troughs (Fig. 9a). Glacial intervals with lower precession would see a northward relocation and weakening of the continental heat low, which reduces the frequency of tropical temperate troughs, despite the maintained northern position of the westerlies (Fig. 9b).

Figure 9 Schematics of the effects of shifts in the westerlies and changes in the strength of the continental heat low on the connectivity between the tropics and temperate regions. The locations of Pinnacle Point (PP) and sediment core MD96-2094, as well as the Agulhas Current (AC) and Benguela Current (BC), are indicated. Hemipelagic sediments in the core originate from the Orange River (catchment marked by blue outline). (a) Glacial high precession phase with northward-shifted westerlies and a strong continental heat low (because of high summer insolation). Convective summer rain is common on the south coast, and rainfall amount is high in the interior. (b) Glacial low precession phase, westerlies are north, but continental heat low is weak; stratiform winter rain dominates the south coast, and total rain amounts are low in the interior. (c) Interglacial high precession phase with westerlies in a southern position and strong continental heat low; stratiform winter rain dominates the south coast, and total rain amounts are low in the interior. (For interpretation of the references to color in this figure legend, the reader is referred to the web version of this article.)
Some of the lowest δ18Oc values and highest occurrences of stratiform rainfall are observed during precession peaks in late interglacial phases. In late MIS 7 (220–190 ka), both the speleothem δ18Oc and the interior rainfall record indicate low frequencies of tropical temperate troughs despite a summer insolation peak at 208 ka (Fig. 8b–d). A similar rainfall low in the interior is recorded in MIS 5 (122–112 ka) during another peak in summer insolation (116 ka). The speleothem record does not cover this second interval completely, but the record of PP29 suggests a dominance of stratiform rainfall around 112–109 ka. Both these intervals represent phases of reduced connectivity between the tropical and temperate regions, attributable to a southward shift of the STC and westerlies that is probably related to a reduction in Antarctic sea ice extent during interglacial periods (Fig. 9c).
The transition between MIS 6 and MIS 5 has the highest values of δ18Oc and δ13C recorded on the south coast. This suggests a steep increase of convective rainfall and C4 vegetation in an interval when rainfall in the interior was declining, the westerlies were shifting south, and summer insolation was low. This specific interval is only covered by one sample, and we therefore cannot perform the repetition test to validate the environmental significance of the stable isotope values. As noted, the high values may also be related to kinetic effects in an opening cave. The recovery of a more continuous record of this time interval in the future may help explain the exceptional values that we observe.
Implications for early modern humans and vegetation history of the GCFR
The studied speleothems derive from the same locality of two archaeological sites of major significance to modern human origins, PP13B and PP5-6 (Brown et al., Reference Brown, Marean, Herries, Jacobs, Tribolo, Braun, Roberts, Meyer and Bernatchez2009, Reference Brown, Marean, Jacobs, Schoville, Oestmo, Fisher, Bernatchez, Karkanas and Matthews2012; Marean et al., Reference Marean, Bar-Matthews, Bernatchez, Fisher, Goldberg, Herries and Jacobs2007; Marean, Reference Marean2010). The interpretation of the speleothem stable isotopic records has important implications for the reconstruction of the environmental conditions for early modern humans in the South African paleoscape and vegetation in the GCFR. Notably, it documents significant shifts in the rainfall systems and relative abundance of C3 plants and C4 grasses. Marean et al. (Reference Marean, Cawthra, Cowling, Esler, Fisher, Milewski, Potts, Singles and De Vynck2014) described the main habitat types in the GCFR in terms of their major resources of interest to hunter-gatherers, and the speleothem records suggest that these habitat types changed significantly in composition and placement; they also added the Palaeo-Agulhas Plain ecosystem that formed during lower sea levels on the exposed shelf to the GCFR. Paleoenvironmental reconstructions that predate MIS 6 on the south coast are rare; we therefore focus our discussion of the paleoenvironmental implications of the speleothem record to the period from MIS 6 onward.
Despite the considerable changes in the rainfall systems indicated by variable δ18Oc values during MIS 6, δ13C values are relatively constant and suggest mixed vegetation with a dominance of C3 plants over C4 plants (Fig. 8e). Phytoliths from levels at PP13B dated by optically stimulated luminescence (OSL) to MIS 6 (Jacobs, Reference Jacobs2010) also suggest a dominance of C3 plants at this time (Albert and Marean, Reference Albert and Marean2012). The earliest human occupation of the caves/rock shelters at Pinnacle Point (LC-MSA Lower, 167–162 ka) was related to a short transgressive phase, when the coast was within ~5 km of the sites, in the glacial MIS 6 that was otherwise characterized by low sea levels. A slightly later MIS 6 occupation (DB Sand 4) is associated with the following regression and a wide Palaeo-Agulhas Plain (Marean et al., Reference Marean, Bar-Matthews, Bernatchez, Fisher, Goldberg, Herries and Jacobs2007, Reference Marean, Cawthra, Cowling, Esler, Fisher, Milewski, Potts, Singles and De Vynck2014; Fisher et al., Reference Fisher, Bar-Matthews, Jerardino and Marean2010; Jacobs, Reference Jacobs2010). The presence of large grazing ungulates typical of open grasslands and smaller taxa more characteristic for fynbos and thicket environments attests to the diverse environments that humans were using at the time, including the coast, the open grasslands of the Palaeo-Agulhas Plain, and inland areas with fynbos vegetation (Marean et al., Reference Marean, Bar-Matthews, Bernatchez, Fisher, Goldberg, Herries and Jacobs2007; Jerardino and Marean, Reference Jerardino and Marean2010; Marean, Reference Marean2010; Rector and Reed, Reference Rector and Reed2010; Copeland et al., Reference Copeland, Cawthra, Fisher, Lee-Thorp, Cowling, le Roux, Hodgkins and Marean2016). The mixed, but C3-dominated vegetation suggested by the speleothem δ13C corresponds well with the mosaic of vegetation types indicated by the fauna. The presence of large grassland ungulates with the strong C3 signal indicated by the speleothem suggests the presence of C3 grasses during this very cold phase. Despite the increase of frequency of tropical temperate troughs, C3-dominated vegetation prevailed for most of MIS 6, possibly being favored by cooler temperatures.
The transition from MIS 6 into MIS 5 is associated with extreme climatic and environmental change. Rising sea levels rapidly flooded the entire Palaeo-Agulhas Plain removing roughly half the land surface of the present-day extent of the GCFR (Fisher et al., Reference Fisher, Bar-Matthews, Jerardino and Marean2010), driving people off the plain, and obliterating the grassland ungulate populations that lived on it (Marean et al., Reference Marean, Cawthra, Cowling, Esler, Fisher, Milewski, Potts, Singles and De Vynck2014). The speleothem records may indicate a significant change in the vegetation during the transition from MIS 6 to MIS 5 with the highest abundance of C4 grasses and convective rain in the entire record (Fig. 8d and e). Micromammal assemblages from PP13B and PP9C also support a grassy environment at the end of MIS 6 (Matthews et al., Reference Matthews, Marean and Nilssen2009, Reference Matthews, Rector, Jacobs, Herries and Marean2011). The steep increase of the abundance of C4 grasses indicated by the δ13C may suggest that C4 grasslands replaced fynbos biome vegetation at this time. Early MIS 5 micromammal assemblages, however, indicate a return to more closed vegetation (Matthews et al., Reference Matthews, Marean and Nilssen2009, Reference Matthews, Rector, Jacobs, Herries and Marean2011) and more favorable conditions for fynbos biome vegetation.
After the warm phase of MIS 5e, sea levels began to retreat, and the Palaeo-Agulhas Plain was again partly exposed. During MIS 5, there was a remarkable increase in the abundance of archaeological sites compared with MIS 6 (Marean et al., Reference Marean, Cawthra, Cowling, Esler, Fisher, Milewski, Potts, Singles and De Vynck2014). Large grazing ungulates, as well as intertidal shellfish, are commonly found in archaeological sites across the region (Marean et al., Reference Marean, Cawthra, Cowling, Esler, Fisher, Milewski, Potts, Singles and De Vynck2014).
A record of pollen from Vankervelsvlei near Wilderness covers the interval between 110 and 26 ka (Quick et al., Reference Quick, Meadows, Bateman, Kirsten, Mäusbacher, Haberzettl and Chase2015) and thus partly coincides with the speleothem records from Pinnacle Point. The pollen record indicated a shift from Afromontane forests in earlier MIS 5 (108–96 ka) toward forest margin and fynbos vegetation in later MIS 5 (96–70 ka; Quick et al., Reference Quick, Meadows, Bateman, Kirsten, Mäusbacher, Haberzettl and Chase2015). This shift in vegetation has been associated with climatic change from warm conditions with year-round rainfall to cooler temperatures with mainly winter rainfall (Quick et al., Reference Quick, Meadows, Bateman, Kirsten, Mäusbacher, Haberzettl and Chase2015). The speleothem records from Pinnacle Point are consistent with year-round rainfall and C3 vegetation for most of MIS 5 only with short peaks of C4 plants and summer rainfall at 106 ka and ~88 ka. The former peak coincides with a time interval when phytoliths of C4 grasses were found in PP13B (Albert and Marean, Reference Albert and Marean2012). The interpretation of the Vankervelsvlei record as suggesting a cooling trend is not supported by the speleothems or phytoliths from Pinnacle Point. The archaeological deposits at Pinnacle Point suggest that hunter-gatherers expanded the use of intertidal shellfish to include variable habitats such as sandy beaches and rocky intertidal zones at this time (Jerardino and Marean, Reference Jerardino and Marean2010; Marean, Reference Marean2014; Marean et al., Reference Marean, Cawthra, Cowling, Esler, Fisher, Milewski, Potts, Singles and De Vynck2014). In the interval between 90 and 74 ka, they regularly visited PP5-6 albeit for short periods at a time (Karkanas et al., Reference Karkanas, Brown, Fisher, Jacobs and Marean2015).
The transition from MIS 5 to MIS 4 brought changes to the South African south coast. The pollen records from Vankervelsvlei suggest drying conditions with drought stress but without extreme conditions (Quick et al., Reference Quick, Meadows, Bateman, Kirsten, Mäusbacher, Haberzettl and Chase2015). This drying is only represented by one pollen sample in Vankervelsvlei and might not represent the whole of MIS 4. Previous paleoenvironmental interpretations from the region did not support dry conditions (Chase, Reference Chase2010). At Pinnacle Point, C4 plants are abundant throughout MIS 4, and rainfall conditions are variable (Fig. 8e; Bar-Matthews et al., Reference Bar-Matthews, Marean, Jacobs, Karkanas, Fisher, Herries and Brown2010) but with an overall increase of the connectivity between temperate and tropical regions compared with late MIS 5. Altogether, conditions seem to have been variable, and fynbos biome communities may have regularly shifted in their location during MIS 4. The constant growth of speleothem is inconsistent with conditions significantly drier than today.
The sharp environmental change at the transition from MIS 5 into MIS 4 also marks the beginning of a series of rapid changes in stone tool technology including the introduction of a new and early microlithic technology, commitment to heat treatment of silcrete (Brown et al., Reference Brown, Marean, Herries, Jacobs, Tribolo, Braun, Roberts, Meyer and Bernatchez2009, Reference Brown, Marean, Jacobs, Schoville, Oestmo, Fisher, Bernatchez, Karkanas and Matthews2012), and shifts in the representation of raw materials from a predominantly quartzite-based technology at the MIS 5–4 boundary to varying amounts of silcrete, quartz, and quartzite in the overlying strata (Brown, Reference Brown2011). Ages of these changes are based on a high-resolution OSL age model, which is now precisely validated with the documentation of the Younger Toba tephra (~74 ka) in the PP5-6 sediments (Smith et al., Reference Smith, Jacobs, Johnsen, Ren, Fisher, Oestmo and Wilkins2018). The rapid innovations and technological changes thus correlate well with this period of climate variability and represent subtle adjustments to the changing environmental conditions by behaviorally modern humans (McBrearty and Brooks, Reference McBrearty and Brooks2000; Bar-Matthews et al., Reference Bar-Matthews, Marean, Jacobs, Karkanas, Fisher, Herries and Brown2010).
The MIS 3 pollen sequence from Vankervelsvlei suggests cool conditions with increased summer aridity (Quick et al., Reference Quick, Meadows, Bateman, Kirsten, Mäusbacher, Haberzettl and Chase2015), which is supported by the higher C3 vegetation and lower convective summer rainfall amounts indicated by the Pinnacle Point speleothems.
CONCLUSIONS
We present an extended record of speleothem δ18Oc and δ13C from two sites at Pinnacle Point, Staircase Cave and PP29, covering the interval between 330 and 43 ka with several hiatuses. Speleothem δ18Oc values are interpreted in terms of the relative contributions of rainfall from convection by tropical temperate troughs versus stratiform rainfall. δ13C values of the speleothems reflect changing relative abundances of C3 plants and C4 grasses in the vegetation. More stratiform (winter) rainfall is commonly related to high abundances of C3 plants, and convective rainfall from tropical temperate troughs (summer) usually causes a spread of C4 grasses. This relationship only fails during the glacial MIS 6, when δ18Oc values indicate increased convective summer rain, but vegetation remains dominated by C3 plants, probably because of cold temperatures.
Values of δ18Oc in our new speleothem composite record do not support a commonly accepted model of glacial-interglacial climate change in southern Africa. The prevailing hypothesis implies a close relationship of Antarctic temperature and sea ice extent with the latitudinal position of the westerlies and the extent of the winter rainfall region. δ18Oc and δ13C of speleothems from Pinnacle Point do not vary in phase with temperatures in Antarctica or SST in the Agulhas Current region.
Instead, the record of δ18Oc is correlated with a record of river runoff from the South African interior probably because of the high importance of tropical temperate troughs as a rainfall source in the catchment region. Peaks of river runoff and δ18Oc coincide with peaks of summer (January) insolation at 30°S; only during late interglacial phases, when the STC is in a southern position, the river runoff remains low despite peaks in insolation. We therefore suggest that the occurrence frequency of tropical temperate troughs that drives changes in δ18Oc and river runoff from central South Africa depends on the connectivity between the tropical summer heat low and the westerlies. High summer insolation leads to a strong continental summer heat low that connects regularly with the westerlies, whereas weaker insolation leads to a weaker heat low and lower connectivity. During strong interglacial phases, the STC and westerlies were shifted south and weakened, which also leads to decreased connectivity despite a strong summer heat low. Vegetation changes recorded by the δ13C values of the speleothems follow similar trends as the δ18Oc and river runoff; only during MIS 6, low temperatures may favor C3 plants, leading to low δ13C values.
A comparison of the speleothem isotopic record with other indicators of past vegetation from the South African south coast shows high consistency for large parts of the record, but there are some deviations in MIS 4. Hunter-gatherers encountered variable environments in the region, with shifting vegetation and changes in the accessibility of the coast and the presence of hunting grounds on the Palaeo-Agulhas Plain related to sea levels.
Acknowledgments
We thank Philip Hopley and one anonymous reviewer for their constructive comments, which helped improve this publication. We thank the Institute of Human Origins (IHO) and School of Human Evolution and Social Change (SHESC) staff at Arizona State University (ASU) and the Mossel Bay Archaeology Project (MAP) staff for their assistance, the Dias Museum for field facilities, South African Heritage Resources Agency (SAHRA) and Heritage Western Cape (HWC) for permits, and the Geological Survey of Israel for research support. We acknowledge funding from the European Commission Seventh Framework Marie Curie People program FP7/2007–2013 through funding of the Initial Training Network “GATEWAYS” (http://www.gateways itn.eu) under the grant number 238512. This research was further funded by grants from the National Science Foundation (to C.W. Marean, BCS-0524087 and BCS-1138073), the Hyde Family Foundations and the IHO at ASU, and the John Templeton Foundation to the IHO at ASU (grant ID 48952). The opinions expressed in this publication are those of the author(s) and do not necessarily reflect the views of any of these funding organizations.