


INTRODUCTION
The forkbeard Phycis phycis (Linnaeus, 1766) is a gadiform fish found mainly over rocky bottoms, where it looks for shelter in holes during the day and becomes an active predator during the night (Papaconstantinou & Caragitsou, Reference Papaconstantinou and Caragitsou1989; Morato et al., Reference Morato, Solà, Grós and Menezes1999). It is found in the Mediterranean Sea, the north-eastern Atlantic from the Golf of Biscay to Morocco, and the Macaronesian Archipelagos (Azores, Madeira, Canary and Cape Verde) (Cohen et al., Reference Cohen, Inada, Iwamoto and Scialabba1990). In the Azores, it is one of the most abundant demersal fish, found mostly between 10 and 350 m (Pinho, Reference Pinho2003).
The forkbeard is one of the main target species of the demersal fishery in the Azores (Silva & Krug, Reference Silva and Krug1992). During the 1980s, with the introduction of new fishery technology (Menezes, Reference Menezes1996), its commercial landings continually increased from about 180 tons in 1981 to a maximum of 530 tons in 1990. However, throughout the 1990s, and in spite of the constant fishing effort, forkbeard landings have been decreasing, consisting of only 220 tons in 2000. Given that forkbeard CPUE, as well as that of several other demersal species, has been declining in this area (Menezes, Reference Menezes2003), the management of the Azorean demersal fishery, especially of over-exploited species such as the forkbeard, is now a priority.
Information on the age of fish is essential for fisheries management (Casselman, Reference Casselman, Weatherley and Gill1987; Cailliet et al., Reference Cailliet, Andrews, Burton, Watters, Kline and Ferry-Graham2001), as it forms the basis for the calculations of growth rate, mortality rate and productivity (Campana, Reference Campana2001). With the advent of a possible over-exploitation of forkbeard in the Azores, the aim of the present study is to estimate growth parameters from the recent period of greater fishing intensity.
MATERIALS AND METHODS
Sampling
A total of 527 individuals were obtained from all islands and main banks of the Azores Archipelago, north-eastern Atlantic. Two hundred and fifty individuals were collected from April to June of 2000 during demersal fishery surveys with the RV ‘Arquipélago’, using bottom longline. Additionally, 277 individuals were obtained from commercial landings using bottom longline between April 2002 and August 2004. Sampling from commercial landings was random except for size-classes <30 cm and >60 cm, for which an extra effort was put into obtaining these individuals whenever they were landed. For each fish the total length (L T) was measured to the nearest half cm below, the sex was determined by macroscopic observation of the gonads, and the sagittal otoliths were extracted and stored dry.
Length–frequency composition was studied using the total lengths (cm) measured from all forkbeard caught in the 1991 fishery survey with the RV ‘Geralda’ (N = 307) and in the 2001–2002 fishery surveys onboard the RV ‘Arquipélago’ (N = 342). All surveys fished with bottom longline and adopted the same procedures and sampling details, including the same fishing areas and depth ranges (Menezes, Reference Menezes2003; Pinho, Reference Pinho2003). Size–frequency distributions of forkbeard in the years 1991 and 2001–2002 were compared using a Kolmogorov–Smirnov test.
Otolith reading procedures
The thick otoliths of the forkbeard require processing methods before growth increments become visible. Several methods were experimented with forkbeard otoliths, namely: grinding; sawing; burning and sawing; slicing and burning and simply slicing. The method that showed the highest resolution pattern of growth ring was a combination of burning and slicing, which was adopted for this study. The right otoliths were burned to enhance contrast until achieving a light brown colour, immersed in black polyester resin and cut in thin slices with a high speed cutting machine, based on the method proposed by Bedford (Reference Bedford1983). The slices were then glued to black acrylic slides and photographed under reflected light at a magnification of 10X, using a compound stereoscope coupled to a digital camera, and their images interpreted with the help of the computer program Leica® IM500 Image Manager. Growth increments were measured as a distance from the centre of the nucleus to the outer edge of the increment, along the otolith longest axis.
A score was given to each reading on a scale of I to IV (I, growth increments are not visible; II, growth increments are visible, but raise doubts; III, growth increments can be counted; and IV, growth increments are easily counted) (Abecasis et al., Reference Abecasis, Costa, Pereira and Pinho2006). Only those considered readable (criteria III and IV) were used (N = 477). A sub-sample of otoliths from individuals caught in 2004 (N = 159) was read again by the same reader, with an interval of six months between readings. An attempt was made to select 20 otoliths by 5 cm size-classes, but this was not possible for size-classes <25 cm and >65 cm, which are rarely caught (Table 1). An age-bias plot was used to explore relative bias between readings. The precision of growth increment counts between readings were compared with the average per cent error (APE), with the coefficient of variation (CV) and with a Wilcoxon test for paired samples (Beamish & Fournier, Reference Beamish and Fournier1981; Chang, Reference Chang1982). To confirm the annual periodicity of growth increment deposition, both for younger individuals (ages 2–7 years) and older ones (ages 8–14 years), an edge analysis was used, by classifying the edge as opaque (highly calcified light bands) or translucent (less calcified dark bands). Additionally, the marginal increment (MI) was analysed by measuring the distance between the outermost translucent increment and the edge of the otolith, along its longest axis. Once the annual basis for growth increment deposition was established, the counts were converted into ages assuming 1 January as the designated birthday (Williams & Bedford, Reference Williams, Bedford and Bagenal1974), since January seems to be one of the months included in the forkbeard spawning season (Silva, Reference Silva1986; personal observation). The difference between the date of capture and the estimated birth date was used to estimate fractional age, which in turn was added to the number of annuli read in the otoliths to avoid potential bias in growth estimates due to different sampling dates.
Table 1. Number of Phycis phycis otoliths read twice by 5 cm size-classes.

Growth model
The von Bertalanffy growth equation L t = L ∞ · (1−exp · [−k · (t−t 0)] (L ∞, asymptotic mean length; k, growth rate; t 0, hypothetical age at zero length; L t, length at age t) was fitted to length at age data obtained from the otolith readings by means of non-linear least squares parameter estimation using the quasi-Newton algorithm included in the STATISTICA© 6.0 software. The von Bertalanffy growth equations were calculated for males and females separately and statistically compared using likelihood ratio (LR) tests (Kimura, Reference Kimura1980).
RESULTS
Of the 527 individuals sampled, 270 (51.2%) were males and 248 (47.1%) were females. The sex of the remaining nine individuals could not be macroscopically determined because they had very thin and translucent immature gonads. These immature individuals ranged in size from 21.5 cm to 28 cm L T, whilst males ranged from 26 cm to 71 cm L T and females from 24.5 cm to 68.5 cm L T. However, in spite of the sampling effort, samples were not representative for the entire population size structure, with small individuals (<30 cm L T) as well as individuals larger than 60 cm L T being scarce, as a result of the longline size selectivity and the natural scarceness of larger individuals in the populations.
In the burnt and sectioned otoliths used in this study, even though numerous thin and dim growth increments were present, a regular pattern was visible, with alternate opaque and translucent concentric growth increments deposited around a large opaque nucleus. Inside the nucleus structure there was always evidence of a strongly marked check ring. The nucleus itself was usually delimited by a distinct translucent growth increment. Encircling this first growth increment there was always a large opaque increment. Both these increments comprised the first growth increment, which was clearly visible in most otoliths. The first 6–8 growth increments were relatively large, becoming thinner, yet visible, towards the otolith edge (Figure 1).
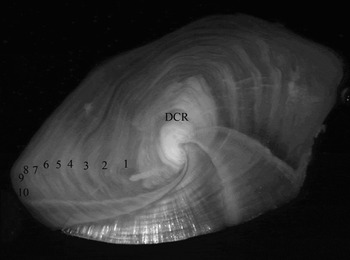
Fig. 1. Sectioned sagittal otolith of a 10 year old forkbeard Phycis phycis collected in 2000 in Azorean waters, with 53 cm L T. Inside the nucleus, the demersal check ring (DCR) is shown.
Of the 527 otoliths read, 9.5% (N = 50) were considered unreadable and were not used for further analysis. Thus, a total of 477 otoliths were used (227 females, 241 males and nine undetermined individuals). The analysis of relative bias between readings shows that some error occurs, but it is consistent throughout the estimated age-classes (Figure 2). The value of APE error of the sub-sample (N = 159) that was read twice was only 2.6, and the level of precision of the age estimates expressed as CV was also 2.6%. Not surprisingly, the Wilcoxon test for paired samples proved that there were no significant differences between the first and the second readings (Z = 0.837; P = 0.403).

Fig. 2. Age-bias plot between the first and the second readings of Phycis phycis otoliths (N = 159).
Monthly proportion of opaque and translucent edges and mean marginal increments of younger (ages 2–7 years; N = 246) and older individuals (ages 8–14 years; N = 204) are shown in Figure 3. An identical pattern throughout the year could be seen in the three cases. Opaque edges were more frequent in spring and summer months (April–October), while translucent edges dominated during autumn and winter (November–March). For both younger and older individuals, the lowest monthly mean marginal increment was registered in March, when the winter minimum water temperature in the Azores occurs (Morato et al., Reference Morato, Afonso, Lourinho, Nash and Santos2003). Afterwards, the marginal increments increased throughout the spring and summer months, and started to decline again in October, remaining low during the winter months. This way, one opaque and one translucent increment are assumed to be deposited on the edge of forkbeard otoliths over a 12-month period. Monthly increments on the otoliths decreased with the age of fish.

Fig. 3. (A) Annual variation pattern of the percentage of opaque and translucent edges; (B) monthly mean marginal increments in otoliths of younger (ages 2 to 7); and (C) older (ages 8 to 14) forkbeard Phycis phycis individuals for the period 2000–2004 (no data for the month of September) (bars represent standard error).
The minimum observed age was two years for females (26 cm L T) and three years for males (27 cm L T), and the maximum observed age was 18 years for both males (71 cm L T) and females (68 cm L T). Mean lengths-at-age are shown in Table 2. The estimated von Bertalanffy growth parameters for Azorean forkbeard are presented in Table 3. No significant differences between males and females growth parameters were found (LR, N = 468; χ2 = 1.59; d.f. = 3; P = 0.66). The growth curve estimated for all forkbeard individuals sampled (N = 477) is presented in Figure 4. Between the ages of 2 and 6 years growth rates remain above 4 cm yr−1. On average, forkbeard individuals attained 50% of the maximum observed size by the age of 5 years.

Fig. 4. The von Bertalanffy growth curve estimated for the entire population sample of Phycis phycis for the period 2000–2004.
Table 2. Mean total length, standard deviation and number of otoliths read for each estimated age of the forkbeard Phycis phycis, for the period 2000–2004.

SD, standard deviation.
Table 3. The von Bertalanffy growth parameters estimated for Phycis phycis in the Azores for the period 2000–2004. Standard deviations are shown in parentheses (L ∞, asymptotic mean length; k, growth rate; t0, hypothetical length at age zero).

Size–frequency distribution in the years 1991 and 2001–2002 (Figure 5) showed a distinct shift towards catching smaller sized forkbeard individuals. Mean L T was 50.8 (±8.9) cm in 1991 and 45.3 (±8.8) cm in 2001–2002, and the distributions were statistically different (P < 0.001).

Fig. 5. Length–frequency distribution of Phycis phycis caught in fishery surveys in 1991 and 2001–2002.
DISCUSSION
Age estimation in gadiform fish has been known to present some difficulties due to otolith thickness, which in most species requires special processing methods so that growth increments become visible (Morales-Nin et al., Reference Morales-Nin, Torres, Lombarte and Recasens1998; Deree, Reference Deree1999). As suggested by Campana (Reference Campana2001) the low values of average per cent error and coefficient of variation indicate, however, that burning and sectioning of forkbeard otoliths is a precise approach for age estimation. This method has also been used to prepare the otoliths of greater forkbeard Phycis blennoides, which presented morphological similarities, namely the thickness, the numerous check rings and the clearly distinguishable demersal check ring, which as reported for this species may be associated with a change in diet/environment from a pelagic to a demersal habitat (Matarrese et al., Reference Matarrese, D'Onghia, Basanisi and Mastrototaro1998; Casas & Piñeiro, Reference Casas and Piñeiro2000). Sectioning has been considered, in fact, a suitable technique for gadiform dense otoliths, allowing faster and better study (Carpentier et al., Reference Carpentier, Dufor, Verin, Bagliniere, Castanet, Conand and Meunier1991; Morales-Nin, Reference Morales-Nin1992) and above all, a substantial improvement in the easiness of reading otoliths with more than 9 growth increments. Ageing forkbeard by interpreting growth increment structures in otoliths appears to be a valid method, since monthly proportion of the marginal increment supports the hypothesis of annual growth increment deposition, with highly dense material being deposited during spring and summer months.
The von Bertalanffy growth parameters estimated for the forkbeard show that it is a relatively slow growing, long lived species, capable of reaching 18 years of age. Although the maximum forkbeard total length recorded in this study was 71 cm, the historical record of 74 cm TL (Pinho, Reference Pinho2003) is closer to the estimated L∞ of 79.6 cm. The forkbeard did not show sexual dimorphism in growth, even though differences in growth between sexes are a common feature among related Gadidae such as Phycis blennoides (Casas & Piñeiro, Reference Casas and Piñeiro2000).
In this study smaller specimens were not well represented in the samples. Individuals less than 30 cm L T are rarely captured with bottom longline, in both commercial landings and fishing surveys, due to hook size selectivity (Grós et al., Reference Grós, Silva and Menezes1995). The shortage of smaller individuals may influence the value estimated for t 0, which was quite high in this study (−1.88±0.25 cm), and eventually interfere with estimates of mortality. Therefore, an extra effort should be made towards sampling juvenile forkbeard, possibly with the use of smaller sized hooks or alternative fishing gear. The good precision results of the methods used in the present study, however, suggest that the estimated growth parameters should reflect the forkbeard growth traits. Given that there are evidences that the size–frequency distribution of this species is shifting towards smaller individuals, one important question should be asked: could intensive fishing cause changes in Azorean forkbeard population growth traits? The authors suggest that, if possible, the age reading methods described in the present paper should be applied to forkbeard otoliths collected prior to the enhancement of demersal fisheries of the mid-1990s, and the results compared with the ones presented here.
ACKNOWLEDGEMENTS
This research was part of the projects ‘ORPAN’ and ‘Programa Nacional de Recolha de Dados da Pesca’. The authors would like to thank L. Gordo for his precious advice regarding methodologies and K. Erzini for his helpful comments.


