Nomenclature
-
 $\textrm{z1}\!\sim\! \textrm{z6}$
-
the coordinate value of the six cables in the x direction
- Smax
-
maximum stress of the membrane of the airship
- r
-
correlation coefficient of the linear relationship between two or more variables

1.0 INTRODUCTION
Structure lightweight and bearing capacity improvement are important issues in the optimisation design of the aircraft. The facts show that if the weight of the rocket or satellite is reduced by one kilogram, the incremental coefficient of the whole weight will be reduced by about one hundred kilograms. Stratospheric airship has the characteristics of large size, light weight and strong load capacity. In order to increase the structure stiffness of the airship, reinforcing cables can be added. Because of the flexibility of membrane and cables, it is important to design and optimise the airship structure configuration.
At present, many researchers have done a lot of work on airship structural optimisation. The multidisciplinary optimisation of an airship with unconventional configuration was carried out in the paper [Reference Ceruti, Voloshin and Marzocca1,Reference Ceruti, Voloshin and Marzocca2]. The objective functions included aerodynamic drag, airship structure weight and control stability. In Refs. [Reference Kanikdale3]–[Reference Ram and Pant5], the simulated annealing algorithm was used to optimise the aerodynamic performance of the airship, with the aerodynamic drag coefficient of the airship hull, mass and envelope stress as the objective functions, with the airship shape parameters as the optimisation variables. In Refs. [Reference Yang, Wang and Gu6] and [Reference Zhang and Zhang7], an optimal model for airship shape was established with the least resistance, the smallest body surface ratio and the minimum cyclic stress of the capsule as the objective functions. In Ref. [Reference Nan8], topology optimisation analysis was carried out for the skeleton structure of semi-rigid airships. One multi-objective decision-making method was proposed based on signal-to-noise ratio, and the best robust design from the Pareto solution was obtained. In Refs. [Reference Shengqi and Haifeng9] and [Reference Chen, Song and Wang10], the parameters of the propeller and the motor were selected as the optimisation variables and the efficiency of the propulsion system was used as the objective function to optimise the parameters of the propulsion system of the airship. Engineering applications of a variety of optimisation algorithms were studied in comparison including the Monte Carlo algorithm [Reference Wasserstein and Fishman11], the differential evolution algorithm [Reference Storn and Ptice12], the simulated annealing algorithm [Reference Hoos and Stutzle13], the particle swarm algorithm [Reference Kennedy and Eberhart14], the genetic algorithm [Reference Kaveh15], and the imperial competition algorithm [Reference Su and Jiang16]. Comparing the results of different methods, it was found that the Monte Carlo algorithm has the worst effect, followed by the simulated annealing algorithm; the other methods have similar optimisation effects.
However, the optimisation about reinforcing cable distribution has not been studied. Usually the cables on the airship membrane are uniformly distributed [Reference Saito, Iijima and Matsuzaka17–Reference Nakashno, Saito and Goto19] and the balance problem between bearing capacity and weight caused by cables is ignored. This paper presents an optimal design optimisation scheme for distributing reinforcing cables which has crucial engineering significance for improve performance of the airship structure design.
In section 2, the mechanical model of the airship is established by ABAQUS. In section 3, several designs are proposed based on engineering experience. By comparing the results of the load analysis, the best solution is determined. In section 4, the optimisation model of the airship with cables is parameterised by ABAQUS secondary development and further analysed based on the NSGA-|| (Non-dominated Sorting Genetic Algorithm) algorithm. In the final section, we draw some conclusions of the rule of optimised reinforcing cable distribution.
2.0 MECHANICAL MODEL OF THE AIRSHIP
2.1 Geometry model
This paper selected a typical outline for the airship with a slenderness ratio of 4. The length of the outline is 10,000mm and it is divided into two segments, both of which are ellipses, as shown in Fig. 1. The demarcation point is at x = 4,192.35mm, which is the position with the largest radius.
The envelope material of the airship capsule is composed of a resin-based composite material, and the reinforcing cable is composed of a flexible cable. The material properties are shown in Table 1.
Table 1 Material property of membrane and cable
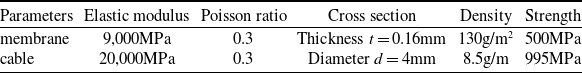
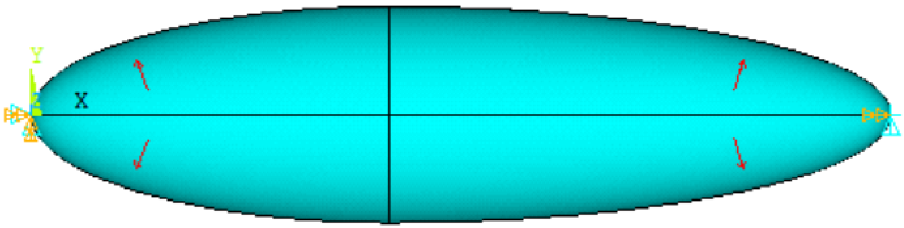
Figure 1. Mechanical model of the airship.
When the airship is free without cables, the mechanical model is established as shown in Fig. 1. The left endpoint is constrained by six degrees x, y, z, Rx, Ry, Rz. The right endpoint is constrained by y, z and Rx, which allows the capsule to stretch freely in x-direction. The internal pressure difference is p = 0.01MPa.
2.2 Finite element model
In ABAQUS, 2D shell element S4R is used for membrane structure and 3D truss element T3D2 is used for reinforced cables. Global size of the element is 100mm.
Considering the tangential stress between the cable and the membrane, the ‘penalty function’ type is applied in contact model. It is necessary to judge whether the slave cable elements penetrate the master membrane elements. If there is no penetrating phenomenon, no treatment is carried out. If penetrating occurs, the normal contact force is used to limit. The magnitude of the contact force is proportional to the contact stiffness and contact displacement.
Due to the large deformation of the airship structure, geometric nonlinearity cannot be neglected and should be ON in the analysis setting. The solution technique is full Newton method.
3.0 SOLUTIONS FOR CABLE DISTRIBUTION BASED ON EXPERIENCE
The role of the cable is to enhance the carrying capacity, so the more, the better. However, the whole weight requirement limits the number of cables. According to the overall design requirements, the integrated areal density (that is, total mass divided by total area) should not exceed 140g/m2 and the bearing capacity should be as large as possible.
3.1 Airship without cables
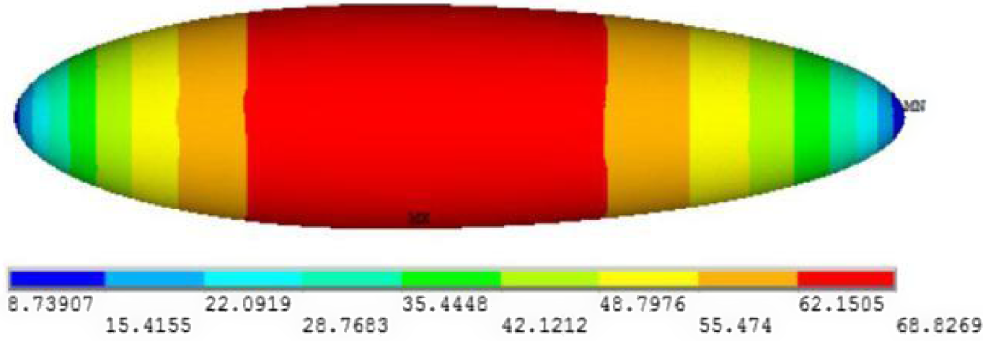
The load analysis is carried out for the mechanical model of the airship and the stress results are shown in Fig. 2. It is obvious that the largest stress of the airship structure is at the position with the largest radius. Therefore, setting one cable at the largest stress position x = 4,192.35mm will obtain the best load-bearing effect.

Figure 2. Stress results of the airship without cables.
3.2 The airship with 9 cables
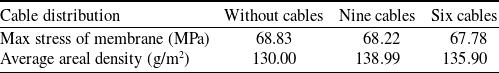
It is feasible to apply warp and weft cables on the airship. However, the results of load analysis show that warp cables have a smaller load-sharing effect than weft cables. Taking into account the weight increase, only the weft cables are added in the airship design. According to engineering experience, nine reinforced cables are arranged on the airship, shown as Fig. 3(a). With reference to x = 4,192.35mm, one cable is placed every 1,000mm. With the same load p = 0.01MPa, the stress results are shown in Fig. 3(b) and (c).
By observing the stress distribution of the membrane and the reinforcing cables, it is found that the stress of the ropes at both ends is small: the minimum value is 31.79MPa while the maximum value is 79.35MPa. The reinforcing cables at both ends play a lesser role. Considering weight reduction and bearing load capacity, it is more reasonable to remove the left two cables and the right one.
3.3 Airship with 6 cables
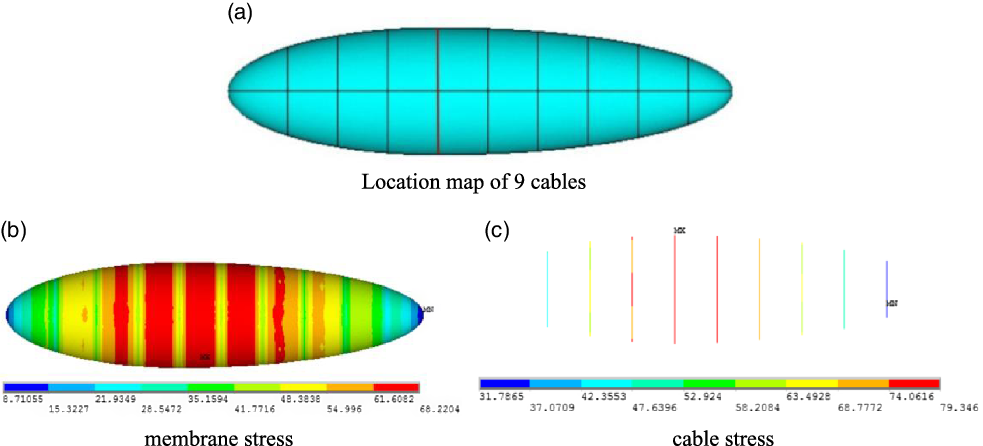
Based on the analysis of airship with nine cables, the location of the remaining six cables is shown as Fig. 4(a) and the stress results are shown as Fig. 4(b) and (c).
Table 2 Comparison of different schemes


Figure 3. Model and stress results of the airship with nine cables.

Figure 4. Model and stress results of the airship with six cables.
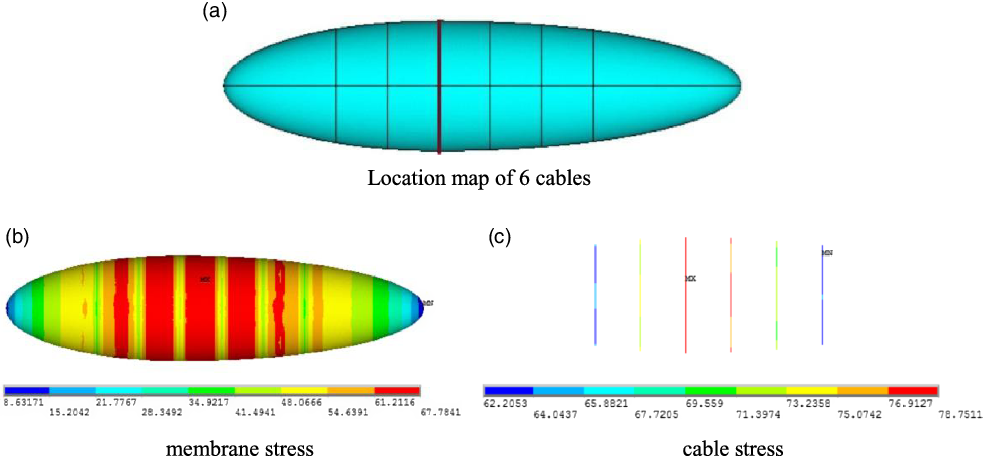
Comparing the stress results of the two schemes, it is shown that the maximum stress of the membrane and the cable is approximately equal after the reduction of three cables, but the minimum stress of the cable is larger. The stress range of cables changes from 31.79∼79.35MPa to 62.21∼78.75MPa, indicating that the six reinforcing cables have shared more load. At the same time, the reduction in the number of cables will greatly reduce the weight of the airship and the average areal density will be reduced from 138.99g/m2 to 135.90g/m2, as shown in Table 2.
4.0 OPTIMISATION MODEL OF CABLE DISTRIBUTION
4.1 Optimisation plan
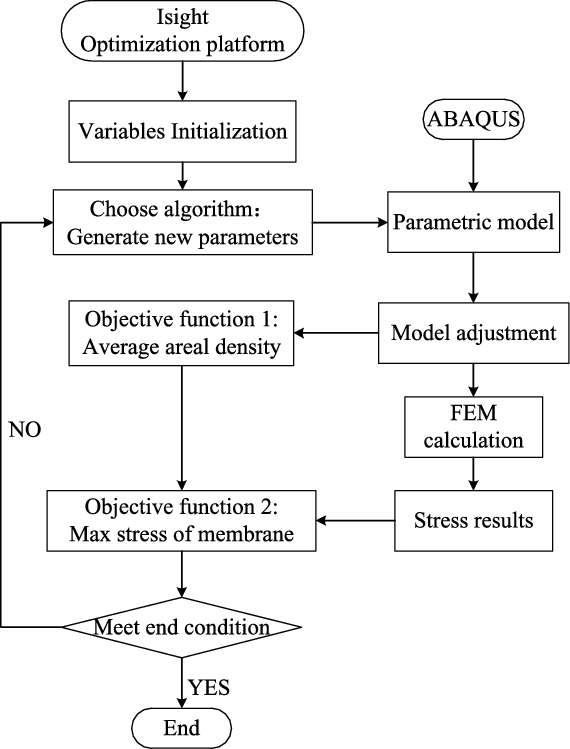
In order to achieve an optimisation design for the cable distribution, this paper combines the FEM software ABAQUS and the optimisation platform named Isight, shown as Fig. 5. By using ABAQUS software, parametric modeling of the airship with cables is established by the python language script function [Reference Lai and Jiang20] and the load analysis is implemented. With the Isight platform, parameter passing and optimisation method selection are realised.
4.2 Design variables and constraint conditions
The initial solution for optimisation design is the one with six cables in the Section 3. The design variables are the location of six cables in x-direction. With the left endpoint as the coordinate origin, the variables are set as z1, z2, z3, z4, z5, z6. The initial values are listed in Table 3.
Table 3 Design variables and constraint conditions
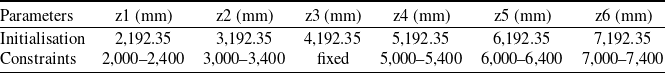

Figure 5. Optimisation plan of combining Isight with ABAQUS.
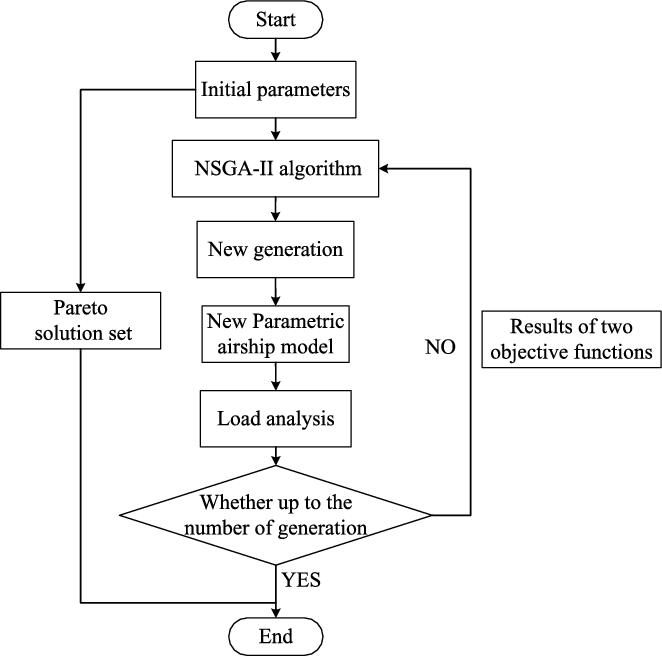
Figure 6. Process of the NSGA-II optimisation.
According to the analysis of Section 3, z3 should be fixed at the maximum radius position. The reinforcement cables should be distributed uniformly on the airship and cannot be very close. Therefore, it is reasonable to set the range of the other five variables as shown in Table 3.
4.3 Objective functions
One important factor of the airship is lightweight and the technical requirement in this paper is that the average areal density cannot exceed 140g/m2. The other factor is bearing capacity, and we choose the maximum stress of the airship membrane structure under 10,000Pa pressure as the second objective function.
So the objective functions are listed as follows:
 $$objective\;functions:\left\{ \begin{array}{l}{f_1}:\;\min \left( {average\;areal\;density} \right)\\{f_2}:\;\min \;\left( {max\;stress\;of\;membrane} \right)\end{array} \right.$$
5.0 OPTIMISATION ANALYSIS BASED ON NSGA-II METHOD
5.1 Optimisation analysis
The optimisation of cable distribution belongs to multi-objective optimisation problem. It is difficult to obtain the best solution, which makes all objectives optimum because the objectives are in conflict with each other. Therefore, the Pareto optimal solution set is the suitable choice. There are many optimisation algorithm, such as EA (Evolution Algorithms), SA (Simulated Annealing), ACO (Ant Colony Optimisation), PSO (Particles Swarm Optimisation), G (Genetic Algorithm) and so on. Compared with other algorithms, GA has some advantages in convergence, solution diversity and avoiding the non-inferiority local optimal. New genetic algorithm named NSGA-II further introduces the elite strategy and retains the Pareto solutions of every parent generation directly to the next generation. This strategy improves the search efficiency and avoids the non-inferiority local optimum [Reference Deb, Agrawal and Pratap21,Reference Zhang, Liao and Chai22].
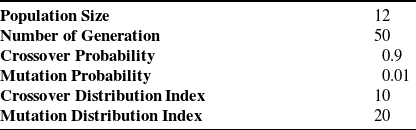
Table 4 Parameters of NSGA-II algorithm

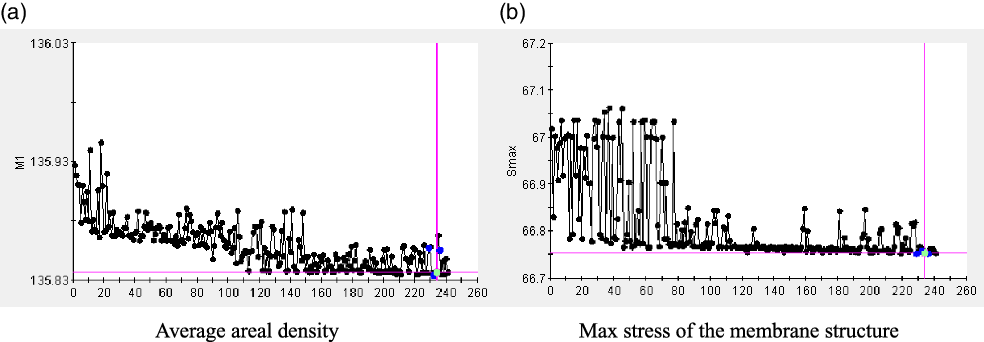
Figure 7. Historical process of NSGA-II iteration.
The flow chart of NSGA-II algorithm is shown in Fig. 6. In the optimisation process, the new generation parameters are transmitted to the airship model, and the results of two objective functions are returned to the algorithm process before the number of generation. The parameters are listed in Table 4.
5.2 Optimisation results
5.2.1 Iteration process
The NSGA-II algorithm gradually gets closer to the optimal result through producing the next generation by preserving the superior individuals of the father and crossover operator. As shown in Fig. 7, they are the historical iterative process of two objective functions. The iterative process becomes gradually concentrated instead of divergent and gradually develops toward the direction in which the objective function decreases.
(2)5.2.2 Parameter correlation analysis
For multi-objective optimisation analysis, the correlation analysis between the optimisation variables and the objective functions can help to better guide the arrangement of the reinforcement cables. Correlation analysis is about the linear relationship between two or more variables, using correlation coefficient r to express the degree of correlation.
 $r$
meets the condition of
$r$
meets the condition of
 $\left| r \right| \le 1$
. If
$\left| r \right| \le 1$
. If
 $\left| r \right|$
is larger, it indicates that the correlation is greater. If
$\left| r \right|$
is larger, it indicates that the correlation is greater. If
 $\left| r \right|$
is closer to 0, it indicates that the correlation is small.
$\left| r \right|$
is closer to 0, it indicates that the correlation is small.
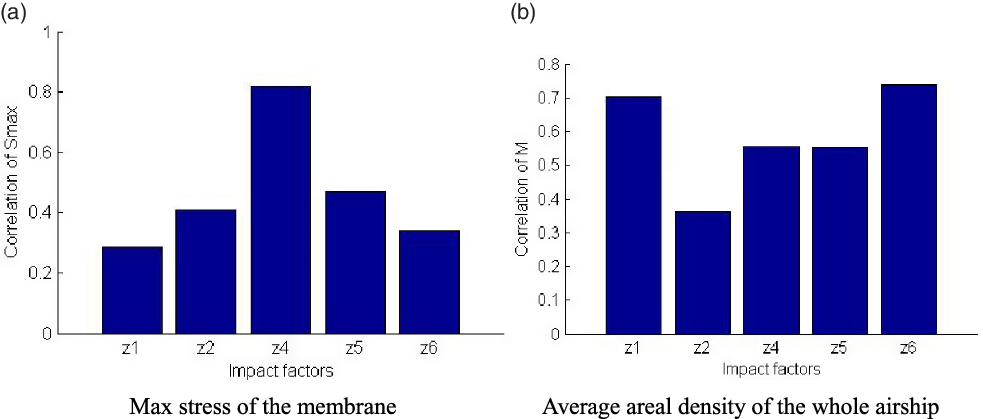
Figure 8(a) shows the correlation between the positions of the five reinforcing cables and the maximum stress of the airship membrane structure. It can be seen that the correlation of z4 is the largest, so the arrangement of z4 is more important and needs higher manufacturing precision. Figure 8(b) shows the correlation between the positions of the five reinforcing cables and average areal density of the whole airship. It can be seen that the correlation coefficients of z2, z4 and z5 in the middle are relatively lower, and the ones of z1 and z6 at two ends are relatively higher. The reason is that the slope in the middle of the airship is small and the slope at the two ends is large. For z1 and z6 at two ends, when the positions of the reinforcing cables change, the length of the cables changes more and the impact on the total mass is greater.
5.2.3 Pareto solution set
An important feature of the NSGA-II algorithm is that the generation of the Pareto solution set is not just one solution. In engineering applications, the best optimal results may not be achieved easily. In the Pareto solution set, decision makers can choose the suitable one according to their preferences or engineering needs. The partial ones of the Pareto solution set are shown in Table 5.
Table 5 Part of Pareto solution set
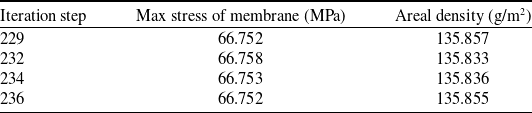
Table 6 Optimal solution of NSGA-II
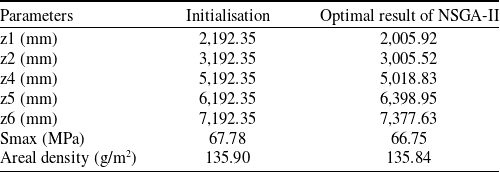

Figure 8. Correlation analysis of variables.
It can be seen from the Table 5 that the range of average areal density is small and is from 135.833g/m2 to 135.857g/m2. The technical requirement of the project is less than 140g/m2, so there are enough margins for the cable connection kn, welded part of membrane and other factors. When the stress factor is more important, we can choose the solution with the least stress. When the mass factor is more important, we can choose the solution with smallest average areal density. Considering the sum of two objective functions, the result of the 234th step is the optimal solution that meets our requirements.
5.2.4 The optimal solution
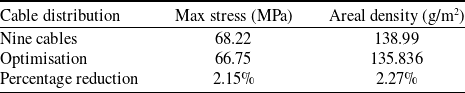
This paper compares two designs of the arrangement with six cables and the optimal solution, as shown in Table 6. As we can see, the optimisation of the NSGA-II produces very good results. Besides, the finite element analysis of the optimal solution is conducted and the stress cloud diagram is shown in Fig. 9.
The results are listed in Table 7. It shows that the number and position optimisations of the cables have brought the obvious improvement on the stress distribution and weight reduction. The max stress of the membrane and the areal density are reduced obviously. Combining Fig. 9 with Fig. 3, the max stress is also reduced from 78.75MPa to 76.49MPa. The whole airship strength performance has been improved. The cable optimisation design is very important for the airship structure design, and the weight reduction and stress reduction could provide more design space for the fabric weaving of the membrane.
Table 7 Results of different designs

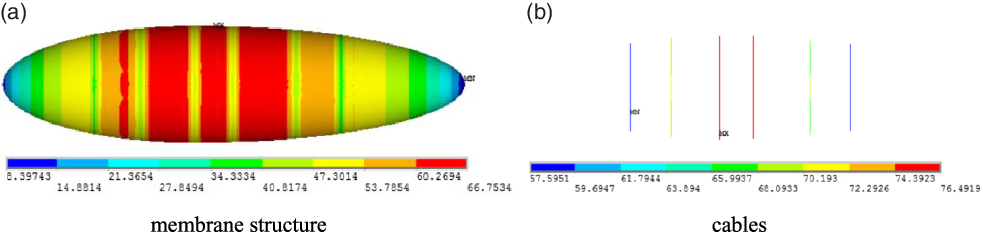
Figure 9. Stress results of the optimal scheme.
6.0 CONCLUSIONS
From the optimisation analysis of the reinforced cable distribution, it can be found that the number and position distribution of the cables have a great influence on the bearing capacity and stress distribution. The laws and trends of the cable distribution can provide guidance for the design of the cables.
Some conclusions are obtained from the results:
-
(1) By setting the reinforcing cables, the load of the airship can be effectively shared. The maximum stress of the membrane structure can be reduced and the stress distribution can be more uniform.
-
(2) According to analysis of the experience solutions, the cables at both ends have little effect on improving the bearing capacity of the airship. It is more reasonable to only install reinforcing cables in the middle of the airship. By the number of cables based on experience, the material utilisation ratio of the cables is improved, and the whole performance of the performance of the airship is better.
-
(3) By concentrating on the optimisation of the cable position distribution, the maximum stress of the membrane and the weight of the airship are both reduced. The influence on the maximum stress is more obvious. Further, the max stress of the cables is also reduced and the material utilisation ratio of the cables is improved. The cables in the middle of the airship have greater influence on the stress distribution than the ones at both ends.
Supplementary material
To view supplementary material for this article, please visit https://doi.org/10.1017/aer.2021.84