


Introduction
The agricultural regions of western Washington (WWA) and Alaska (AK) Interior are distinct from many major wheat (Triticum aestivum L.) producing areas in the USA due to high latitude (>45°N), climate, cropping systems and farm size. Wheat is vital to WWA and AK agriculture and food systems, and germplasm assessment within these alternative regions is necessary to breed adapted cultivars.
In WWA, wheat is grown as a rotation, cover and alternative cash crop (Miles et al., Reference Miles, Roozen, Jones, Murphy and Chen2009). Wheat supports crops deriving high agricultural monetary value such as horticultural crops, dairy and potatoes (USDA NASS, 2012), as well as globally significant vegetable seed production (du Toit et al., Reference du Toit, Foss and Jones2007a, Reference du Toit, Foss and Jonesb). WWA wheat production is also part of an emerging regional grain economy (Hills et al., Reference Hills, Goldberger and Jones2013). In AK, spring wheat is produced for regional human consumption and animal feed (Van Veldhuizen and Knight, Reference Van Veldhuizen and Knight2004). Wheat systems in AK also contribute to food security when inclement weather impacts transportation.
The climate in these regions poses challenges to spring wheat production. WWA has a cool and wet maritime climate (WRCC, 2016). Late spring and early fall rains and prioritization of higher monetary crops necessitate early maturing wheat. The AK Interior has a subarctic continental climate (Quarberg et al., Reference Quarberg, Jahns and Chumley2009; WRCC, 2016) and is conducive only to spring planting. The growing season is cool and short (80–118 d), with extreme high latitudes (60–65°N), below freezing temperatures in late spring and early fall, and low spring and moderate fall precipitation (Quarberg et al., Reference Quarberg, Jahns and Chumley2009; WRCC, 2016). Early maturing hard spring wheat adapted to these regions would benefit total farm productivity and regional food systems.
To identify hard spring wheat suited to WWA and AK, the Nordic region of Europe was identified. The Nordic region is similar to WWA and the AK Interior with high latitudes (>54°N), mixed maritime and continental climates, long days during the growing season, and with a history of breeding wheat for early maturity (Mesdag and Donner, Reference Mesdag, Donner and Donner2000). A disproportionate number of wildtype (wt) NAM-B1 alleles were identified in Nordic wheat compared with global germplasm (Hagenblad et al., Reference Hagenblad, Asplund, Balfourier, Ravel and Leino2012). Asplund et al. (Reference Asplund, Bergkvist, Leino, Westerbergh and Weih2013) speculated wt NAM-B1 was retained in Nordic wheat due to its role in accelerated senescence (Uauy et al., Reference Uauy, Distelfeld, Fahima, Blechl and Dubcovsky2006b). Thus, wt NAM-B1 Nordic germplasm could be a source of short-duration spring wheat. Advantageously, wt NAM-B1 has been correlated with increased grain protein content (GPC) and iron (Fe), manganese (Mn) and zinc (Zn) content with a minor yield penalty on average (reviewed by Tabbita et al., Reference Tabbita, Pearce and Barneix2017).
The aim of the study was to evaluate wt NAM-B1 Nordic germplasm for WWA and the AK Interior. The correlation between time to senescence, used as an indicator of maturity, with yield; GPC; and Fe, Mn and Zn content was evaluated to determine the consequences of selecting for early maturity. The aim was not to determine the effect of wt NAM-B1, but to evaluate this germplasm for breeding material in short-duration alternative wheat-producing regions.
Materials and methods
Germplasm and experimental design
Forty-two accessions of spring wheat varieties or landraces of Nordic origin containing wt NAM-B1 as confirmed by Hagenblad et al. (Reference Hagenblad, Asplund, Balfourier, Ravel and Leino2012) were obtained from the US National Plant Germplasm System or the Nordic Genetic Resource Center. When accessions were not available, the best alternatives according to variety name and pedigree were used (online Supplementary Table S1). The seed was increased under conventional management at the Northwest Washington Research and Extension Center (NWREC), Washington State University (WSU) Mount Vernon in 2014. Ten US, European or Canadian varieties or breeding lines selected from WSU, Mount Vernon variety trials (‘HRS 3419’, ‘SAS 13-69’, ‘Expresso’, ‘SAS 4B’, ‘SAS W4’, ‘Edison’, ‘Dayn’ and ‘JD’) or from Extension recommendations to WWA farmers (‘Kelse’ and ‘Canus’) (Miles et al., Reference Miles, Roozen, Jones, Murphy and Chen2009) served as checks spanning spring wheat classes. In all, 52 accessions were assessed (Table 1, online Supplementary Table S1).
Table 1. Entry information for the Nordic germplasm evaluation in Mount Vernon, WA and Fairbanks, AK

Germplasm is derived from Hagenblad et al. (Reference Hagenblad, Asplund, Balfourier, Ravel and Leino2012), except for variety checks. See online Supplementary Table S1 for additional accession details and wt NAM-B1 status.
a Variety check.
The trials were arranged using a randomized complete block design with three blocks each containing one replicate of each accession. In 2015 and 2016, the study was conducted at NWREC, WSU Mount Vernon, WA (48.439°N, −122.387°W). Mount Vernon is located in the agricultural region of the Skagit Valley in WWA and is characterized as a cool and wet maritime climate. Annual temperatures in Mount Vernon range from a mean minimum of 7.5°C to a mean maximum of 23.2°C (WRCC, 2016). Mean annual precipitation is 822 mm with 114 mm falling between June and August (WRCC, 2016).
In 2016 and 2017, the study was replicated at the Agricultural and Forestry Experiment Station (AFES), University of Alaska, Fairbanks (64.852°N, −147.855°W). Fairbanks is located in the agricultural region of the Tanana Valley of the AK Interior and is characterized as a subarctic continental climate (Quarberg et al., Reference Quarberg, Jahns and Chumley2009; WRCC, 2016). Annual temperatures in Fairbanks range from a mean minimum of −28.3°C to a mean maximum of 22.4°C (WRCC, 2016). Mean annual precipitation is 267.5 mm, with 130.6 mm falling between June and August (WRCC, 2016).
Daily weather data were retrieved for NWREC Mount Vernon at AgWeatherNet (2018) and for the University Experiment Station, Fairbanks at the National Oceanic and Atmospheric Administration Climate Data Online (2018). Minimum and maximum daily temperature and daily precipitation data for 31 March to 31 August are provided for Mount Vernon 2015 and 2016 and Fairbanks 2016 and 2017 (online Supplementary Fig. S1). Daily and cumulative growing degree days (GDDs) are presented in Fig. 1 for each location by year environment. From planting to harvest, Mount Vernon 2015 experienced 1989.5 cumulative GDDs; Mount Vernon 2016, 2193.4 cumulative GDDs; Fairbanks 2016, 1722.4 cumulative GDDs; and Fairbanks 2017, 1598.2 cumulative GDDs.
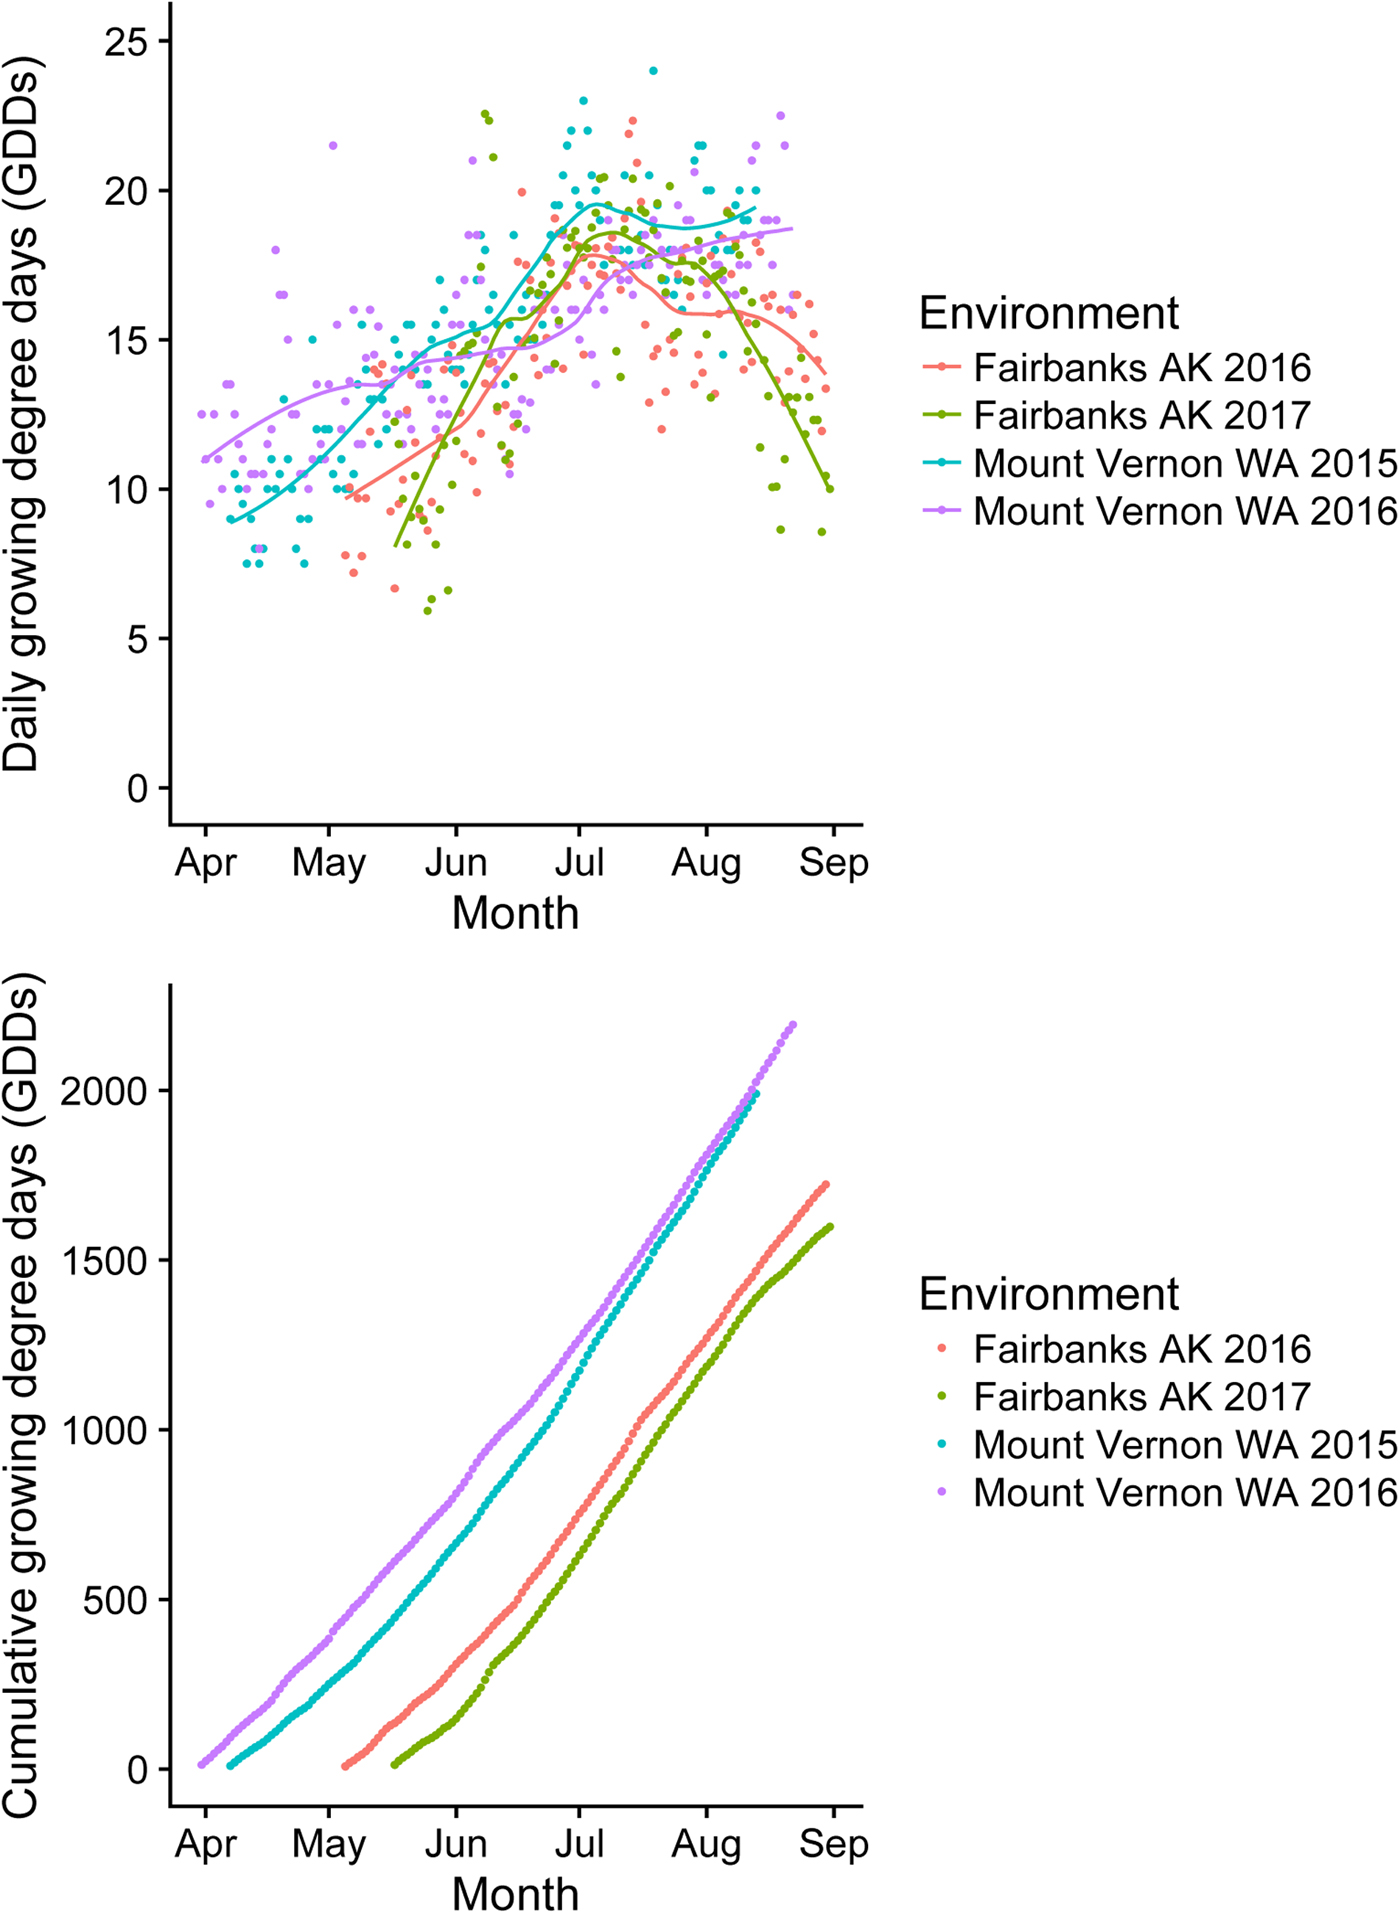
Fig. 1. Summary of growing degree days (GDDs) for each location by year environment from planting to harvest. Top: daily GDDs; bottom: cumulative GDDs.
At Mount Vernon, the seed was planted in seven-row 5 m2 plots on 7 April 2015 and 31 March 2016 at a rate of 100 kg/ha. At Fairbanks, the seed was planted in six-row 8.4 m2 plots on 5 May 2016 and 17 May 2017 at a rate of 100 kg/ha. At each location, plots were trimmed and re-measured for yield calculations. At Mount Vernon, the seed was combine-harvested on 13 August 2015 and 22 August 2016. At Fairbanks, the seed was combine-harvested on 30 August 2016 and 31 August 2017. Both sites were rain-fed and managed under conventional practices following grower best practices for soil fertility, weed pressure and disease, which included control of stripe rust, caused by P. striiformis f. sp. tritici (Pst), via fungicide application in Mount Vernon. At Mount Vernon 80 kg/ha N and at Fairbanks 70 kg/ha N was applied.
Preliminary assessment of susceptibility to stripe rust was evaluated in separate trials under natural infection in 2016 at the Palouse Conservation Field Station, WSU, Pullman, WA and at NWREC, WSU Mount Vernon. Each accession and susceptible checks were planted at 5 g quantity as a 50 cm single row with 20 cm between rows. Trials were planted on 27 April 2016 at Pullman and 18 April 2016 at Mount Vernon.
Data collection
Days to senescence, lodging, yield and test weight were collected on a per plot basis for all replicates in Mount Vernon 2015 and 2016 and Fairbanks 2016 and 2017. Missing values occurred for test weight (n = 577) when yields were low due to genetic background, small plot size, bird predation and year effects in Mount Vernon. Plant senescence was used as an indicator of grain maturity. In Mount Vernon, plant senescence data were collected every other day as a percentage of the plot with peduncles ripened to 5 cm of the spike. Time to senescence is reported as Celsius GDDs from plant emergence to 50% plot senescence, as when 50% of the plot senesced per the peduncle as defined above. In Fairbanks, time to senescence was reported as GDDs from emergence to when 50% of the spikes in a plot senesced. GDDs were calculated according to the Bauer spring wheat model (Bauer et al., Reference Bauer, Fanning, Enz and Eberlein1984) using the calculator provided by IPPC (2016). Lodging was evaluated prior to harvest as a percentage of plot with plants lodged. All plots were harvested at full maturity with sound seed with the exception of five plots (accessions NAMC009, NAMC003 and NAMC006) at Fairbanks in 2017, which were harvested immaturely as necessitated by weather. Following harvest, yield and test weight were evaluated on clean grain on a per plot basis and is reported as kg/ha and kg/hL, respectively.
For protein and mineral analysis, 100 g subsamples from each replicate for each trial were milled in a laboratory mill (LM 3100, Perten Instruments, Hägersten, Sweden) fit with a 0.5 mm screen. Per cent grain protein was determined on 30 g of each flour sample using an infrared reflectance spectrometer (Inframatic 8600 Flour Analyzer, Perten Instruments). Mineral content was determined following Engle-Stone et al. (Reference Engle-Stone, Nankap, Ndjebayi, Allen, Shahab-Ferdows, Hampel, Killilea, Gimou, Houghton, Friedman, Tarini, Stamm and Brown2017) using inductively-coupled plasma optical emission spectrometry (ICP-OES). Approximately 20 mg of each flour was acid digested in 0.25 ml OmniTrace 70% HNO3 (MilliporeSigma, Burlington, MA, USA) for 12–16 h at 60°C with 200 rpm orbital shaking. Afterwards, the acid lysates were diluted to 5% HNO3 with OmniTrace water (MilliporeSigma, Burlington, MA, USA) and analysed on a 5100 SVDV ICP-OES (Agilent, Santa Clara, CA, USA) within 2 h. ICP-OES methods were calibrated using the National Institute of Standards and Technology (NIST) traceable elemental standards and validated using NIST-traceable reference material. The detection limit for Fe, Mn and Zn was 0.005 ppm with inter-assay precision at <8%. Yttrium (5 ppm) was used as an internal standard for all samples. All reagents and plastic ware were certified or routinely tested for trace metal work. Mineral content was determined using native software (ICPExpert) and normalized to flour sample weight.
Stripe rust reactions were evaluated under natural infection in collaboration with USDA-ARS and WSU, Pullman. For each location, Pullman and Mount Vernon, infection type and severity were recorded at flowering, 21 June and stem elongation, 2 June, respectively, and soft dough, 2 June and milk stage, 27 June, respectively. Infection type was scored on a 0–9 scale with scores of 8 and 9 combined to give 8 as the most susceptible reaction. Severity was recorded as the percentage of the flag leaf infected by pustules on a 0–100% scale.
Statistical analysis
Outliers for the mineral analysis when laboratory replicates were not performed were determined using Grubbs' test (GraphPad, 2018), extreme studentized deviate, at α = 0.05 due to a known variation in laboratory replicates. Outliers were repeated using three laboratory replicates and the mean value accepted for analysis. No outliers for GDDs to senescence, yield and protein content were identified
Data were analysed in R (R Core Team, 2017) using mixed-effect analysis of variance (ANOVA), post-hoc multiple comparisons and multiple linear regression. ANOVA was used to test for variation in response variables – GDDs to senescence; grain yield; GPC; and grain Fe, Zn and Mn content – by the main effects, location, year, accession, block and the interaction between location and accession and year and accession for each location. All effects were treated as fixed except block, which was treated as a random effect. When the effects were significant (α = 0.05), post-hoc multiple comparisons were made using Fisher's least significant difference (LSD) test under a Bonferroni adjustment to reduce the type I error rate. Minimum significant difference (MSD) is reported. Differences by accession were evaluated for each location with blocks and years combined as replicates. The analysis incorporated the year by trait interaction and all effects were treated as random. Differences by accession were also analysed for each location by year environment for the trait GDDs to senescence, again using Fisher's LSD at α = 0.05 under a Bonferroni adjustment. Blocks were treated as replicates for each environment.
To test the null hypothesis, days to senescence are not correlated with grain yield; GPC; and grain Fe, Mn and Zn content; multiple linear regression was used to predict each response variable with explanatory variables GDDs to senescence, location, year and the first-order interactions. To evaluate whether soundness of seed influenced GPC and Fe, Mn and Zn content test weight and its first-order interactions with year and location was added to this model as an additional explanatory variable. Missing values for test weight were dropped from the analysis. Additionally, the regression analysis including only GDDs to senescence and the first-order interaction terms was conducted excluding samples without a test weight measurement to assess whether these samples biased the results.
R package ‘nlme’ (Pinheiro et al., Reference Pinheiro, Bates, DebRoy and Sarkar2017) was used for ANOVA and multiple regression analysis. R package ‘agricolae’ (de Mendiburu, Reference de Mendiburu2017) was used for post-hoc multiple comparisons. Figures were produced using ‘ggplot2’ (Wickham, Reference Wickham2009) and ‘cowplot’ (Wilke, Reference Wilke2017).
Results
Combined ANOVA for locations and years showed that location and accession were significant (P < 0.0001) sources of variation for GDDs to senescence; grain yield; GPC; and grain Fe, Mn and Zn content. The interaction between location and accession was not significant for GDDs to senescence (P = 0.2080), GPC (P = 0.9437) and grain Zn content (P = 0.2667). The interaction between location and accession was significant for grain yield (P < 0.0001), grain Fe content (P < 0.0001) and grain Mn content (P = 0.0203). Location was the largest component of variation.
Because of the different response of accession to location for three of the six traits, ANOVA was performed separately for each location. At Mount Vernon (Table 2), year was significant for all traits except grain Zn content; accession was significant for all six traits; and the interaction between year and accession was significant for GDDs to senescence, grain yield, GPC and grain Zn content. Year was the largest component of variation for all traits except for grain Zn content where year was not significant and accession was the largest component of variation. At Fairbanks (Table 2), year and accession were significant sources of variation for all six traits; the interaction between year and accession was only significant for GDDs to senescence, grain yield and grain Fe content. Year was the largest component of variation for each trait.
Table 2. Mixed-effect analysis of variance (ANOVA) results for the fixed effects of the Mount Vernon, WA and Fairbanks, AK trials

Fixed effects are year, accessions (acc), and the interaction between year and accession. Block was treated as a random effect. Traits evaluated include growing degree days (GDDs) to senescence; grain yield; grain protein content; and grain Fe, Zn and Mn content.
a Num df is the numerator degrees of freedom, k−1, where k is the number of groups (years or accessions). The denominator degrees of freedom (N−k) for all effects is 206, where N is the number of observations and k is the number of groups (years and accessions).
***P < 0.0001, **P < 0.001, *P < 0.05, ns is non-significant at P > 0.05.
Post-hoc comparisons confirmed significant variation by accession at each location for all traits (Table 3, online Supplementary Table S2). For the primary trait of interest, GDDs to senescence, accessions ranged in mean value from 1369.73–1612.03 GDDs (MSD = 68.78 GDDs) for Mount Vernon and 1349.63-1506.33 GDDs (MSD = 82.86 GDDs) for Fairbanks (Table 3). Post-hoc comparisons for each location by year environment resulted in significant variation by accession with mean ranges of 1329.00–1567.33 GDDs (MSD = 112.58 GDDs) for Mount Vernon 2015; 1381.30–1667.90 GDDs (MSD = 84.54 GDDs) for Mount Vernon 2016; 1411.27–1554.60 GDDs (MSD = 70.65 GDDs) for Fairbanks 2016; and 1288.00–1464.03 GDDs (MSD = 154.00 GDDs) for Fairbanks 2017.
Table 3. Summary of trait means evaluated over 2 years at Mount Vernon, WA and Fairbanks, AK

The minimum significant difference (MSD) is Fisher's least significant difference at α = 0.05 under a Bonferroni adjustment. Traits evaluated include growing degree days (GDDs) to senescence; grain yield; grain protein content (GPC); and grain Fe, Zn and Mn content. Trait means and MSDs by accession are available online, including additional agronomic traits of lodging and test weight (Supplementary Table S2).
The regression model for GDDs to senescence was significant (P < 0.0001) for each trait evaluated – grain yield; GPC; and grain Fe, Mn and Zn – given location, year and the first-order interactions between GDDs to senescence, location and year (Table 4). The model fit was highest for grain Mn content (R 2 = 0.8345, P < 0.0001) and grain Zn content (R 2 = 0.7358, P < 0.0001) as compared with grain yield (R 2 = 0.3130, P < 0.0001), GPC (R 2 = 0.4742, P < 0.0001) and grain Fe content (R 2 = 0.3744, P < 0.0001). Regression analysis revealed a significant correlation of GDDs to senescence with each response variable except grain Mn content (Table 4), given location, year and the first-order interactions between GDDs to senescence, location and year. Grain yield varied positively with increasing GDDs to senescence (B = 9.1560, P = 0.0002); each other significant correlation was negative: GPC (B = −0.0090, P = 0.0100), Fe (B = −0.0504, P = 0.0028) and Zn (B = −0.0255, P = 0.0405). These results did not change when samples with yields too low to conduct a test weight measurement were removed. When test weight was added to the regression model, it was not a significant predictor for yield (R 2 = 0.3524, P < 0.0001; B = −142.644, P = 0.2168), GPC (R 2 = 0.4886, P < 0.0001; B = 0.0492, P = 0.7814), Fe (R 2 = 0.3650, P < 0.0001; B = −0.4420, P = 0.6117), Mn (R 2 = 0.8292, P < 0.0001; B = 0.3862, P = 0.5468) or Zn (R 2 = 0.7352, P < 0.0001; B = 0.0575, P = 0.9262) content; however, GDDs to senescence remained a significant predictor.
Table 4. Results of the multiple regression analyses for each response variable with the explanatory variables in the model

Response variables evaluated include grain yield; grain protein content; and grain Fe, Mn and Zn content. Explanatory variables treated as predictors for each response variable are growing degree days (GDDs) to senescence, trial location, trial year and the first-order interaction terms. R 2 is the fit of the full model for each response variable.
Note: B is the unstandardized coefficient for GDDs to senescence and is interpreted with respect to the full model: the effect of GDDs to senescence on the response variable given each of the explanatory variables in the model.
SE is the standard error.
a Numerator df = 7, denominator df = 616.
***P < 0.0001, **P < 0.01, *P < 0.05, ns is non-significant at P > 0.05.
Although no statistical analysis was conducted due to limited replication, data from the stripe rust evaluation suggested a range of susceptibility types (online Supplementary Table S3). Checks included in the Nordic evaluation ranged in susceptibility from resistant (infection type 0–3), intermediate (4–6) and susceptible (7–8), depending on location. Whereas only one check was susceptible at the milk stage at Mount Vernon, 33 of the NAM-B1 Nordic accessions were susceptible and only five (‘Stanley’, ‘Tähti’, ‘Fram II’, ‘Trym’ and ‘Luja’) would be classified as resistant at this location and stage. High-temperature adult-plant (HTAP) resistance is suggested for all five of these except Luja, as shown by the difference in susceptibility type at Mount Vernon between stem elongation on 2 June 2016 and milk stage on 27 June 2016. Checks JD, HRS 3419 and SAS 13-69 showed a similar pattern towards HTAP. Maximum daily temperatures required for the expression of HTAP were observed from 4 June to 7 June 2016 at Mount Vernon. This pattern of HTAP resistance was not observed at the Pullman location.
Discussion
The described study sought to characterize a population of Nordic hard red spring wheat containing wt NAM-B1 in two alternative wheat-producing environments, WWA and the AK Interior, both at high latitudes and with short growing seasons. The primary trait of interest for characterization was early maturity, evaluated by plant senescence; however, as early maturity has been reported to be negatively correlated with yield and positively with GPC (e.g. Iqbal et al., Reference Iqbal, Navabi, Salmon, Yang and Spaner2007b), this trait was not studied in isolation from the complex of traits breeders seek to optimize for farmers and end-users. In addition, as wt NAM-B1 has been associated with time to senescence, as well as grain yield; GPC; and grain Fe, Mn and Zn content (reviewed by Tabbita et al., Reference Tabbita, Pearce and Barneix2017), these traits were included in the study to understand the consequences of breeding for early maturing wheat in these two locations.
At both locations the results demonstrated variation in each trait – time to senescence; grain yield; GPC; and grain Fe, Mn and Zn content – by accession suggesting the germplasm is a valuable source for cultivar improvement at the Mount Vernon and Fairbanks locations. For example, at Mount Vernon three accessions (Fram II, ‘Hankkijan Ulla’ and ‘Snøgg II’) matured significantly earlier than all included variety checks by 72.59–242.3 GDDs (MSD = 68.85 GDDs). In Fairbanks, two accessions (‘Kr Finset, Eikesdal’ and Hankkijan Ulla) matured significantly earlier than seven of the 10 checks by 87.22–156.70 GDDs (MSD = 82.86 GDDs). Given each day contributed six to 24 GDDs, the observed differences in maturity were equivalent to 1 week or more.
Fairbanks experienced a shorter growing season with less significant variability in GDDs to senescence by accession compared with Mount Vernon, which could be due to a decreased opportunity for the expression of genetic differences in senescence. Evaluating wt NAM-B1 isolines under dryland conditions in Pullman, WA, Carter et al. (Reference Carter, Santra and Kidwell2012) found no correlation with senescence in field trials and speculated the short growing season and high temperatures prevented expression of the allele prior to initiation of senescence. Mean temperatures in Fairbanks were no higher than in Mount Vernon, and were lower at planting, despite later planting dates, and precipitation amounts were higher during the growing season, which could delay senescence as water stress is avoided (reviewed by Yang et al., Reference Yang, Zhang, Wang, Wang, Zhu and Liu2001; Gregersen et al., Reference Gregersen, Culetic, Boschian and Krupinska2013). The shortened season and decreased variability in GDDs to senescence could be attributed to later planting combined with fewer cumulative GDDs and extremes in daylength experienced in Fairbanks. At planting in Fairbanks in 2016 and 2017, daylength had already exceeded 17 and 18 h, respectively. In comparison, daylength at planting in Mount Vernon was between 12 and 14 h for 2015 and 2016, respectively. Extreme long days at a high latitude that can mask sensitivity to photoperiod (Iqbal et al., Reference Iqbal, Navabi, Salmon, Yang, Murdoch, Moore and Spaner2007a) could have reduced variability in GDDs to senescence at Fairbanks compared with Mount Vernon.
The study showed that decreased GDDs to senescence were negatively correlated with yield and positively correlated with GPC and grain Fe and Zn content. A negative association with yield suggests that breeding for early maturity could result in lower yields. Here, given the effect of trial location, trial year and the interaction between GDDs to senescence with location and year, and the interaction between location and year, each decrease in GDDs was correlated with a decrease in yield by 9.16 kg/ha. The remaining correlations resulted in a higher GPC and grain Fe and Zn content; for hard spring bread wheat, these correlations can be viewed as favourable. Breeding that resulted in a decrease of 100 GDDs to senescence, for example, which falls within the range of significant differences observed at both locations, is predicted by the model to correlate with a decrease in yield by 900.16 kg/ha and increase in GPC by 0.90%, grain Fe content by 5.04 mg/g and grain Zn content by 2.55 mg/g, given the influence of the remaining variables in the model.
Globally, Fe and Zn are among the micronutrients of greatest concern for inadequate dietary intake affecting two billion people, with co-occurrence common (Allen et al., Reference Allen, de Benoist, Dary and Hurrell2006). It is estimated that 24.8% of the global population is affected by anaemia (McLean et al., Reference McLean, Cogswell, Egli, Wojdyla and de Benoist2009) half of which is considered the result of Fe deficiency (Stoltzfus et al., Reference Stoltzfus, Mullany, Black, Ezzati, Lopez, Rodgers and Murray2004; cf. Balarajan et al., Reference Balarajan, Ramakrishnan, Øzaltin, Shankar and Subramanian2011); at least 17.3% of the global population is at risk of inadequate Zn intake with stunting affecting approximately 25% of all children under 5 years of age (Wessells and Brown, Reference Wessells and Brown2012; King et al., Reference King, Brown, Gibson, Krebs, Lowe, Siekmann and Raiten2016). In the USA, approximately 10–20% of women and children are considered deficient in Fe, whereas 10–20% of all adults are deficient in Zn (Moshfegh et al., Reference Moshfegh, Goldman and Cleveland2005). Thus, there is a strong reason to select wheat that maintains high Fe and Zn content, although challenges with Fe bioavailability in wheat limits the return of Fe-biofortified wheat (Bouis and Saltzman, Reference Bouis and Saltzman2017). Significant variation was found in the current study for mineral content by accession, with several accessions at the Mount Vernon location containing mean Zn content that met or exceeded the international breeding objectives for Zn-biofortified wheat under HarvestPlus (37 mg/g) (Bouis and Saltzman, Reference Bouis and Saltzman2017). Additionally, given the positive correlation between Fe and Zn status with the early maturity trait alleviates concerns of unintentional decreases in mineral content when breeding for early maturity under the study conditions.
Early maturity has been shown previously to result in decreased yields and increased GPC in spring wheat (at high latitudes, e.g. see Iqbal et al., Reference Iqbal, Navabi, Salmon, Yang and Spaner2007b), as well as increased micronutrient content on average in regards to senescence specifically (reviewed by Tabbita et al., Reference Tabbita, Pearce and Barneix2017). However, irrespective of maturity time, a negative correlation between grain yield and GPC has been recognized (reviewed by Simmonds, Reference Simmonds1995; for GPC-B1 specifically see Joppa et al., Reference Joppa, Du, Hart and Hareland1997). A similar relationship has been proposed between yield and grain mineral content (McGrath, Reference McGrath1985). This relationship between grain yield, GPC and grain mineral content is often referred to as a ‘dilution effect’ (McGrath, Reference McGrath1985; Garvin et al., Reference Garvin, Welch and Finley2006; Fan et al., Reference Fan, Zhao, Fairweather-Tait, Poulton, Dunham and McGrath2008; Liu et al., Reference Liu, Wang, Li, Li, Yang, Yang, Huang, Liang, Zhao, Mao, Liu and Qiu2014; Guttieri et al., Reference Guttieri, Baenziger, Frels, Carver, Arnall and Waters2015). However, not all research supports the dilution effect (e.g. Murphy et al., Reference Murphy, Reeves and Jones2008).
Whether the negative correlation between early maturity and yield and positive correlation between early maturity and GPC and grain Fe and Zn content observed here resulted from a dilution effect would depend upon the mechanism for increased GPC and grain Fe and Zn content; increased GPC and grain Fe and Zn content could occur as a result of decreased grain size or more efficient remobilization of minerals (Uauy et al., Reference Uauy, Brevis and Dubcovsky2006a). Uauy et al. (Reference Uauy, Brevis and Dubcovsky2006a) concluded that the increased GPC associated with wt NAM-B1 in a study of isogenic lines was due to a combination of both mechanisms. Precaution should be taken when interpreting the results of the current study as GDDs to senescence and GPC and grain Fe and Zn content were shown to have a positive relationship; however, the relationship was not established as causative.
That an overall relationship between GDDs to senescence with grain yield was established does not necessitate a trade-off in breeding efforts between maturity time and grain yield. Using Tukey's post-hoc comparisons of mean accession data by location allows for the selection of accessions exceptional to this overall trend. This result is similar to other studies showing a decrease in yield with earlier maturity (Iqbal et al., Reference Iqbal, Navabi, Salmon, Yang and Spaner2007b). Fram II, one of the three earliest accessions at Mount Vernon, was not significantly different from three of the highest yielding, but latest maturing, checks. In Fairbanks, the earliest maturing varieties, Hankkijan Ulla and Kr Finset, Eikesdal, also did not significantly differ from any of the higher yielding varieties. These three varieties are potential sources of variety improvement for early maturity in WWA or the AK Interior.
Alternative wheat-producing regions often lack breeding programmes or are resource limited and could benefit from sharing resources, trial results and germplasm. For example, in AK, independent breeding and trialling present a challenge as AK lost its last plant breeder in 1999. This study revealed that the interaction between trial location and accession was not a significant effect for GDDs to senescence suggesting data and germplasm could be shared among these alternative wheat-producing regions to achieve earlier maturing spring varieties. However, the significant effect trial location by accession for grain yield suggests that independent breeding programmes, field trials and variety testing are still necessary to select suitable germplasm and varieties beyond maturity time for WWA and the AK Interior; early maturity that does not also consider yield poses a limitation.
If goals are to be met to increase state or regional sufficiency in food supply, including wheat grain for both animal and human consumption, yield, along with traits such as grain protein and quality, and maturity time, need to reach an appropriate level for farmer profitability, land stewardship and end-user affordability. The evaluation of germplasm and traits for multiple alternative wheat-producing regions simultaneously with similar environments and breeding objectives, following the model of the CIMMYT's wheat mega-environments (Rajaram et al., Reference Rajaram, van Ginkel, Fischer, Li and Xin1995), could increase the efficiency and effectiveness of breeding programmes in these areas to aid in the development of appropriate varieties for alternative agriculture and food systems.
Supplementary material
The supplementary material for this article can be found at https://doi.org/10.1017/S147926211900011X
Acknowledgements
The authors acknowledge and thank Dr Xianming Chen and his research team at the USDA-ARS for conducting the stripe rust evaluation trials; the Center for Interdisciplinary Statistical Education and Research at WSU; and Josh Rivers, Kathy Schultz, Kerri Scott and Ella Taagen who assisted in sample preparation and analysis. Thank you to two anonymous reviewers for their comments. The research was supported by funds from the Glen D Franklin Endowed Graduate Fellowship in Cropping Systems, Clif Bar Family Foundation Seed Matters Graduate Fellowship and USDA – Hatch Alaska Capacity Grant (ALK-17-01).


