Human activities such as application of fertilisers and fossil fuel combustion are altering the nitrogen (N) cycle in terrestrial ecosystems (Vitousek et al. Reference Vitousek, Mooney, Lubchenco and Melillo1997a; Cui et al. Reference Cui, Shi, Groffman, Schlesinger and Zhu2013). These have increased the rates of N deposition by about 124 Tg N per year (Gruber & Galloway Reference Gruber and Galloway2008; Schlesinger Reference Schlesinger2009; Cornell Reference Cornell2011). A major part of this N pool is emitted back to the atmosphere via denitrification in the form of nitrogen gases, among which nitrous oxide (N2O) is an important greenhouse gas (Ravishankara et al. Reference Ravishankara, Daniel and Portmann2009). Human pressure on the N cycle is expected to further increase during this century because of the predicted increases in global population and the intensification of land use required to support the increasing food demand. The global population has nearly tripled since 1950 (Worldometers 2015), and has become increasingly urban; the urban proportion has increased from 3% in 1800 to approximately 55% in 2018 (United Nations 2018).
Land use is one of the most severe modifications of terrestrial ecosystem by humans. In this study we view land use as a result of human activity, which is combined with various environmental and biological factors. The percentage of land used for agricultural purposes and urban uses is continuously increasing (Vitousek et al. Reference Vitousek, Mooney, Lubchenco and Melillo1997a) to cause nutrient imbalances such as increases in N in terrestrial ecosystems (Vitousek et al. Reference Vitousek, Naylor, Crews, David, Drinkwater, Holland, Johnes, Katzenberger, Martinelli, Matson, Nziguheba, Ojima, Palm, Robertson, Sanchez, Townsend and Zhang2009a, Reference Vitousek, Aber, Howarth, Likens, Matson, Schindler, Schlesinger and Tilmanb). The excessive input of N in agriculture has led to accelerated N processes and greater emission of greenhouse gases such as N2O (Wei et al. Reference Wei, Rowe, Escobar-Briones, Boetius, Soltwedel, Caley, Soliman, Huettmann, Qu and Yu2010b; Ni et al. Reference Ni, Ding, Zaman, Cai, Wang, Zhang and Zhou2012; Dong et al. Reference Dong, Zhu and Zeng2014). Urban areas continue to expand due to increasing populations and rapid urbanisation (McDonald Reference McDonald2008; Zhu et al. Reference Zhu, Ioannidis, Li, Jones and Martin2011). The greater demands for food and energy in cities have caused the accumulation of excess N waste leading to pollution in rivers, the sea or landfill sites (Deluca Reference Deluca2009). These forms of pollution are not easy to control (Albiac Reference Albiac2009), and contribute to excess N deposition. In China N deposition is the second most important N input for soils following chemical fertilisers (Cui et al. Reference Cui, Shi, Groffman, Schlesinger and Zhu2013). Therefore, identifying the relative importance of urban and agricultural land-uses on potential denitrification derived N2O is critical to quantifying the impacts of human activities on ecosystems.
Three closely related knowledge gaps limit our current understanding of the patterns and mechanisms that control denitrification rates in terrestrial ecosystems. First, we lack an integrative approach for considering the effects of environmental predictors on denitrification. Previous studies have demonstrated that denitrification could be affected by many factors including soil pH (Herold et al. Reference Herold, Baggs and Daniell2012; Pan et al. Reference Pan, Ye, Ni and Yuan2012; Sun et al. Reference Sun, Zhuge, Zhang and Cai2012; Xu et al. Reference Xu, Wang, Li, Yao, Su and Zhu2014), soil moisture (Amha & Bohne Reference Amha and Bohne2011), nitrate concentration (Wang et al. Reference Wang, Feng, Liao, Zheng, Butterbach-Bahl, Zhang and Jin2013), dissolved organic carbon (DOC) (Castaldelli et al. Reference Castaldelli, Colombani, Vincenzi and Mastrocicco2013), soil temperature (Keeney et al. Reference Keeney, Fillery and Marx1979), pollutants and vegetation (Guo et al. Reference Guo, Deng, Qiao, Yao and Zhu2013). However, because of the complexity of the processes, the relative importance of these factors on denitrification remains unclear. Similarly, we lack integrative approaches for identifying the main land-use types affecting denitrification, which is critical for formulating management practices and conservation policies. Secondly, little is known about the specific mechanisms that control denitrification in terrestrial ecosystems. Denitrification is a microbial process, catalysed by a series of reductases including nitrate reductases (reducing nitrate to nitrite, encoded by narG and napA genes), nitrite reductases (nitrite to nitric oxide (NO), encoded by nirK and nirS genes), NO reductases (NO to N2O, encoded by norB gene) and N2O reductases (N2O to N2 (dinitrogen), encoded by nosZ gene), in which nitrite reductases are the key enzymes (Zumft Reference Zumft1997). Thus, nirK and nirS are much more widely used as the molecular markers of denitrification (Braker et al. Reference Braker, Zhou, Wu, Devol and Tiedje2000; Oakley et al. Reference Oakley, Francis, Roberts, Fuchsman, Srinivasan and Staley2007). The gene nosZ is also important because it is the only known natural biological pathway to reduce N2O to N2 and is largely unique to denitrifying bacteria (Scala & Kerkhof Reference Scala and Kerkhof1999). However, although denitrifying communities are responsible essentially for the denitrification process, we know little about the quantitative links between denitrifying communities and the rate of N2O emission. Finally, most of the previous studies evaluating the main predictors of denitrification have focused on the local scale, leading to a lack of knowledge when evaluating the importance of different land-use types at a larger scale (e.g., regional scale).
Potential denitrifying activity (PDA) has been used to characterise soil denitrification (Pell et al. Reference Pell, Stenberg, Stenstrom and Torstensson1996; Guo et al. Reference Guo, Deng, Qiao, Yao and Zhu2013). This index has been previously reported to be strongly related to other measures of denitrification under field and laboratory conditions (Pell et al. Reference Pell, Stenberg, Stenstrom and Torstensson1996; Yin et al. Reference Yin, Fan, Song, Cui, Li and Liang2015) and is a good metric of denitrification at a regional scale due to logistical constraints. In this study we explored the main drivers of PDA – a common proxy of denitrification – via structural equation modelling (SEM) and random forest modelling based on 197 soil samples collected from Ningbo City, China. The main objectives of the research were to (i) identify the main land-use types altering denitrification rates at a regional scale; (ii) assess the main environmental predictors of potential denitrification rates at a regional scale; and (iii) explore the direct and indirect effects of land-use types on potential denitrification rates via microbial abundance, substrate concentration and abiotic factors (pH, heavy metals and moisture). Because of the large human influence on the N cycle in agriculture (e.g., application of inorganic fertilisers) and on urban systems (e.g., N deposition), we hypothesised that agricultural and urban soils will have the highest PDA compared with other land-use types that will be linked to the abundance of functional microbiota.
1. Study area
The studied city (Ningbo) is in the northeast of Zhejiang Province, China. Average annual temperature and rainfall are 16.53°C (15.7–16.9°C) and 1440mm (1316–1425mm), respectively. The area of Ningbo is 9816km2 with a population density of 775personskm–2 while the density in the city centre is much greater (11,728personskm–2). The urbanisation rate (the proportion of people living in an urban area compared to the total population in a region) has increased from 47% (1992) to 68.8% (2012) and the built-up-area has extended from 73.5km2 to 285km2. The study area is about 1116km2 and includes five main administration centres (Haishu District, Jiangdong District, Jiangbei District, Zhenhai District and Beilun District) of Ningbo. There are many soil types in the area including red earth, paddy soil, fluvo-aquic soil, yellow earth but with red soil as the dominant type in the region.
2. Materials and methods
2.1. Soil sampling
We collected soil samples from 197 sites within the Ningbo region (121°24′E to 122°06′E, 29°46′N to 30°02′N) using a 2km×2km grid from 21 December 2012 to 16 January 2013. The samples were classified into six groups according to the sample collecting log and land-use map of Ningbo in 2013, including farm land (n=61), nursery (n=21), rural road (n=26), forest (n=22), urban land (n=51) and barren (n=16). Farmland and nursery both belong to agricultural soil. Furthermore, nursery is less managed in this area, and thus less affected by human activities than farmland. Urban soil mainly includes urban parks, residential gardens and greenbelts along urban roads. The land use map is given in supplementary Figure 1 (available at https://doi.org/10.1017/S175569101800066X). Soil was collected from the top 15-cm layer and sieved with a 2-mm mesh. All the samples were divided into three parts: (i) one part was stored at 4°C for PDA, inorganic N, and soil moisture determination; (ii) the second part was stored at −80°C for DNA extraction to measure microbial parameters; and (iii) the third part was air dried for soil property analyses and heavy metal determination.
2.2. Soil properties
Air-dried soil pH was tested in deionised water suspensions (1:2.5 w/v) using a pH meter (Accumet excel XL 60, Fisher Scientific, Singapore). Soil water content was calculated by weighing the soil before and after being oven dried for 48h at 105°C. Total carbon (TC) and TN were measured with an elemental analyser (Vario MAX CNS, Germany). DOC was extracted with Milli-Q water at a ratio of 1:10 (w/v) and filtered and then analysed using a TOC analyser (Shimadzu TOC-Vcph, Japan). NH4+, NO3– and NO2– were extracted with a 2M KCl solution ratio of 1: 10 and their concentrations were determined using a FIA QC8500 continuous flow injection analyser (LACHAT, USA). Heavy metals (copper (Cu), zinc (Zn), lead (Pb) and cadmium (Cd)) were extracted with a mixture of concentrated nitric acid and perchloric acid following the method described by Lee et al. (Reference Lee, Li, Shi, Cheung and Thornton2006) and their concentrations were determined using an ICP-MS (Agilent 7500cx, Agilent Technologies, Inc., Tokyo, Japan).
PDA was determined according to the acetylene (C2H2) inhibition method as described by Pell et al. (Reference Pell, Stenberg, Stenstrom and Torstensson1996) with a slight modification. Briefly, we changed the soil used for the assay to 10g and added 10mL of a substrate solution containing 1mM glucose and 1mM KNO3. The N2O produced during the incubation with 10% (v/v) C2H2 at 1h and 5h was measured using robot-equipped gas chromatography (GC7890, Agilent Technologies, USA) (Molstad et al. Reference Molstad, Dorsch and Bakken2007). The rate of N2O emission was used as an indicator of PDA.
2.3. DNA extraction and quantitative PCR
DNA was extracted from 0.5g of soil using the FastDNA® SPIN kit for soil (MP Biomedicals, Solon, OH, USA) following the manufacturer's instruction with slight modifications. The DNA was dissolved in 70μL of dissolved eluent solution included in the kit. The concentration of DNA was determined by a UV-Vis Spectrophotometer (ND-1000, Nanodrop Technologies, Wilmington, DE, USA) and then stored at −20°C until used for quantitative polymerase chain reaction (PCR).
Before quantitative PCR all DNA solutions were diluted to 5ngμL–1 as templates. The targeted gene fragments (16SrRNA, nirK, nirS and nosZ) were cloned into pMD19-T Vector (2692bp, Takara, Japanese) to establish standard curves for quantitative PCR. Quantitative PCRs of bacterial 16SrRNA, nirK, nirS and nosZ genes were performed on a LightCycler® 480 (Roche Applied Science, Indianapolis, USA) in a reaction volume of 20μL containing 10μL of Premix Ex Taq™ (Takara, Japan), 0.5μL of both forward and reverse primers (with final concentrations of 0.25μM), 0.25μL bovine serum albumin (BSA) with a concentration of 20mgmL–1 and 2μL DNA templates (10ng). The primers of the studied genes and the details of thermal cycling condition of each reaction are given in supplementary Table 1. The specificity of amplification was indicated by a single peak at a certain melting temperature (T m) for each gene. Reaction efficiencies between 85% and 115% were considered acceptable in this study.
2.4. Statistical analysis
As heavy metal concentrations are highly related to each other, we conducted a principal component analysis (PCA) of the four heavy metals (Cu, Zn, Pb and Cd), and kept the first component of this PCA as a proxy of heavy metal for further analyses. PCA analysis was performed with SPSS version 18.0 (IBM Corporation, Chicago, IL, USA).
The differences in PDA and denitrification genes were evaluated by one-way ANOVA with land-use types as a fixed factor. For multiple comparisons, Duncan and Dunnett's T3 pairwise comparison post hoc tests were used to determine significant differences between different land-use types where the variance is homogeneous and not homogeneous, respectively (P<0.05 was considered significant). Before conducting these analyses, log and square transformations were conducted to improve data normality.
The classification of random forest analysis (RFA; Breiman, Reference Breiman2001) was performed to identify the most important factor in driving potential denitrification rates at a regional scale. We included land-use types, functional genes involved in denitrification, soil pH, moisture, heavy metals (first axis of a PCA with four heavy metals) and substrates (total N, nitrate and DOC) as predictors of PDA (our response variable). Random forest was extended from standard classification and regression tree methods (CART) by creating a collection of classification trees with binary divisions (Wei et al. Reference Wei, Rowe, Escobar-Briones, Boetius, Soltwedel, Caley, Soliman, Huettmann, Qu and Yu2010a). A detailed description of this method is given by Delgado-Baquerizo et al. Reference Delgado-Baquerizo, Gallardo, Covelo, Prado-Comesaña, Ochoa and Maestre2015a. These analyses were carried out with R statistical software, version 3.0.2 (http://cran.r-project.org/) using the random forest package (Liaw & Wiener Reference Liaw and Wiener2002). The cross-validated R 2 and the significance of the model were assessed with 5000 permutations of the response variable (PDA) using the A3 R package (Fortmann-Roe Reference Fortmann-Roe2013). The significance of the importance measures of each predictor on the response variable (PDA) were determined using the rfpermute package for R (Archer Reference Archer2014). All the figures were plotted with Sigmaplot 12.0 (Systat Software, Inc., San Jose, CA, USA).
Finally, we used SEM to clarify the direct and indirect effects of land-use types (via soil pH, soil moisture, substrate, heavy metal and microbes) on PDA (Grace & Kelley Reference Grace and Kelley2006; Delgado-Baquerizo et al. Reference Delgado-Baquerizo, García-Palacios, Milla, Gallardo and Maestre2015b). The land-use intensity model was included as a categorical variable following the order of farmland > urban land > nursery > rural road > barren > forest according to their known effect on the N cycle (Vitousek et al. Reference Vitousek, Aber, Howarth, Likens, Matson, Schindler, Schlesinger and Tilman1997b). Categorical variables were compatible and used (Grace & Kelley Reference Grace and Kelley2006; Delgado-Baquerizo et al. Reference Delgado-Baquerizo, García-Palacios, Milla, Gallardo and Maestre2015b) with structural equation models because the distribution assumptions do not apply to them (Grace & Kelley Reference Grace and Kelley2006). Soil microbial abundance (16S rRNA, nirK, nirS and nosZ) and substrates (DOC, nitrate and TN) were included in our model as composite variables. The use of composite variables does not alter the underlying SEM model but collapses the effects of multiple conceptually related variables into a single composite effect to aid the interpretation of model results. We then checked the overall goodness of fit for structural equation models. There is no universally accepted and applicable index for all situations regardless of data distribution or sample size. As the chi-square test (χ 2 test) is sensitive both to sample size and data distribution, we combined the χ 2 test (the model is acceptable when 2<χ 2/df<3 and 0.01<P<0.05), Bootstrap (the model has a good fitness when P > 0.05) and root mean square error of approximation (RMSEA; the model has an acceptable fit when 0.05<RMSEA≤0.08 and 0.05≤P≤1.00) to test the goodness of the model in this study. The structural equation model was conducted with AMOS software (IBM Corporation, Chicago, IL, USA).
3. Results
3.1. Soil physico-chemical properties in the different land-use types
The differences in nitrate and TC concentrations between different land-use types were not significant (Table 1). DOC in urban and farm soil was higher than the nursery, rural road and forest sites. Farm and nursery soils had significantly (P<0.05) greater ammonium (NH4) than barren soil. Similarly, the farm soil had the greatest moisture (34.1%±1.8%) and TN (0.22%±0.16%) among the selected land-use types. Nursery soil had the lowest C/N ratio, while the other land-use types did not show differences in the C/N ratio. Farm (pH 5.56) and nursery (pH 5.97) soils were slightly acidic while urban soil had the highest pH (7.10) (Table 1). Most of the soils in urban areas were neutral or slightly alkaline and only 7.8% of the soil samples had pH <6, while most of the forest and nursery land-use samples had pH values <6.
Table 1 Soil basic properties in different land uses in Ningbo City, China. Abbreviation: DOC=dissolved organic carbon.

1The significances of differences between different land uses in DOC, NO3–, moisture and C/N were determined with Dunnett's T3 pairwise comparison post hoc test, while those in NH4+, pH, total nitrogen and total carbon were determined with Duncan pairwise comparison post hoc test. P<0.05 was considered to be significant.
3.2. The effects of land-use intensity on PDA and microbial abundances
Among the selected land-use types, farm soil had the highest PDA in this study (Fig. 1). In addition, PDA in urban soil was significantly (P<0.05) greater than the forest soil, while the trend in urban soil had a slightly greater PDA than nursery, rural road and barren soils but these were not statistically significant. Forest soils had the lowest PDA (Fig. 1). As a whole PDA in the studied soils greatly varied and ranged from 0.03 to 39.42ng N2O-Ng–1 dry soil min–1.
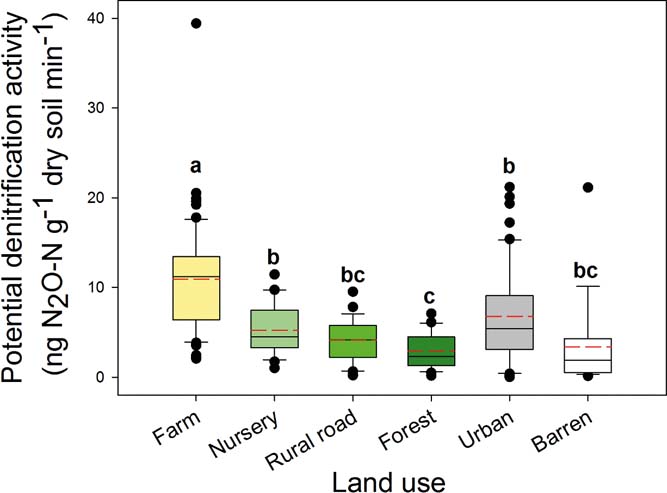
Figure 1 Potential denitrification activities in different land-use soils. The bars were the average of samples in each category. Significant differences between groups are indicated by different letters (P<0.05), which were decided by Dunnett's T3 pairwise comparison post hoc test based on the log transformed data of PDS. The error bar is the standard error.
The abundance of total bacteria in farm soil was significantly (P<0.05) greater than those in urban, rural road and barren soils (Fig. 2a). Except farm soils, urban soils showed no significant difference in total bacterial abundance compared to any other land-use type (Fig. 2a). The abundances of nirK (Fig. 2b) and nirS (Fig. 2c) showed almost similar trends in different land-use groups as observed for total bacterial abundance. A significant difference was observed between barren and farm soils for nirK abundance and between rural road and farm soils for nirS. Nursery soil had the greatest nosZ abundance compared with other land-use types but no significant difference was observed among forest, urban, rural road and barren soils. The abundance of nosZ was the least in barren and rural road soils compared with other soils (Fig. 2d).
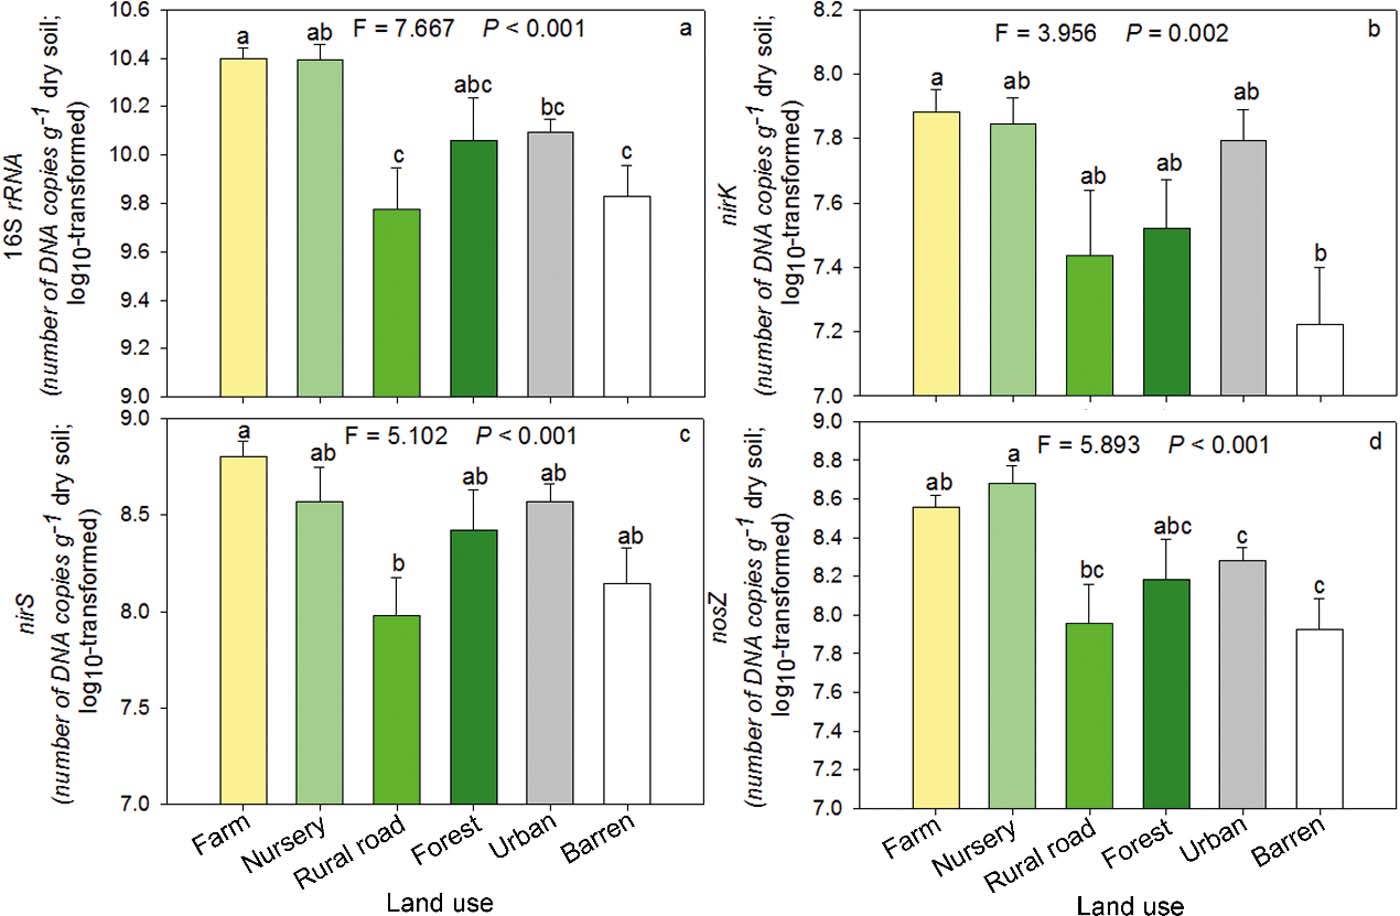
Figure 2 Abundances of total bacteria (a), nirK (b), nirS (c) and nosZ (d) in different land-use soils. The bars were the average of log transformed data of samples in each category. Significant differences between groups are indicated by different letters (P<0.05), which were decided by Dunnett's T3 pairwise comparison post hoc test. The error bar is the standard error.
The ratio of (nirK+nirS)/nosZ can be used to indicate the ratio of N2O/ (N2O+N2) in denitrification products. Nursery soil had the lowest value of (nirK+nirS)/nosZ, while urban soil had the highest (supplementary Fig. 2).
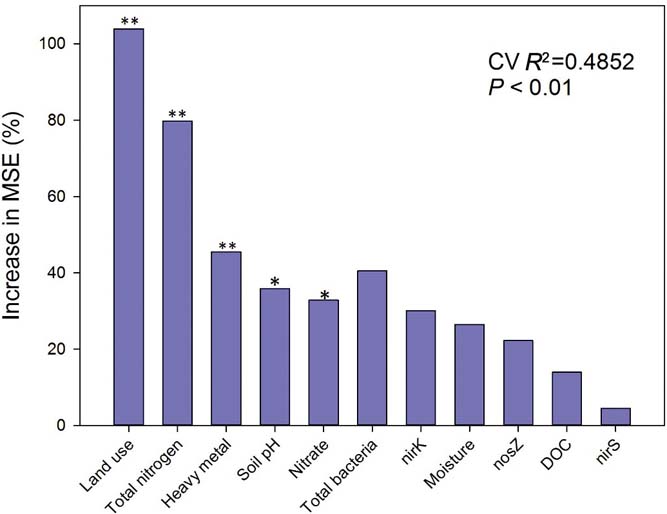
The random forest model showed that land-use types and TN were the most important variables for determining differences in PDA among different groups (Fig. 3). Additionally, heavy metal concentrations, soil pH and nitrate were also important factors for determining PDA differences at a regional scale. Abundance of total bacteria, nirK, soil moisture, nosZ, DOC and nirS showed no significant role in the PDA differences in the random forest model.

Figure 3 Random forest mean predictor importance (% of increase of mean square error) of land use, soil pH, moisture, substrate of denitrification (total nitrogen, nitrate, DOC), microbes (total bacteria, nirK, nirS, nosZ) and heavy metal chosen as studied drivers of the different potential denitrification activities in this study. MSE=mean square error. This accuracy of importance measure was computed for each tree and averaged over the forest (5000 trees). *P<0.05 and **P<0.01 were considered to be significant.
3.3. Direct and indirect effects of predictors on PDA and microbes
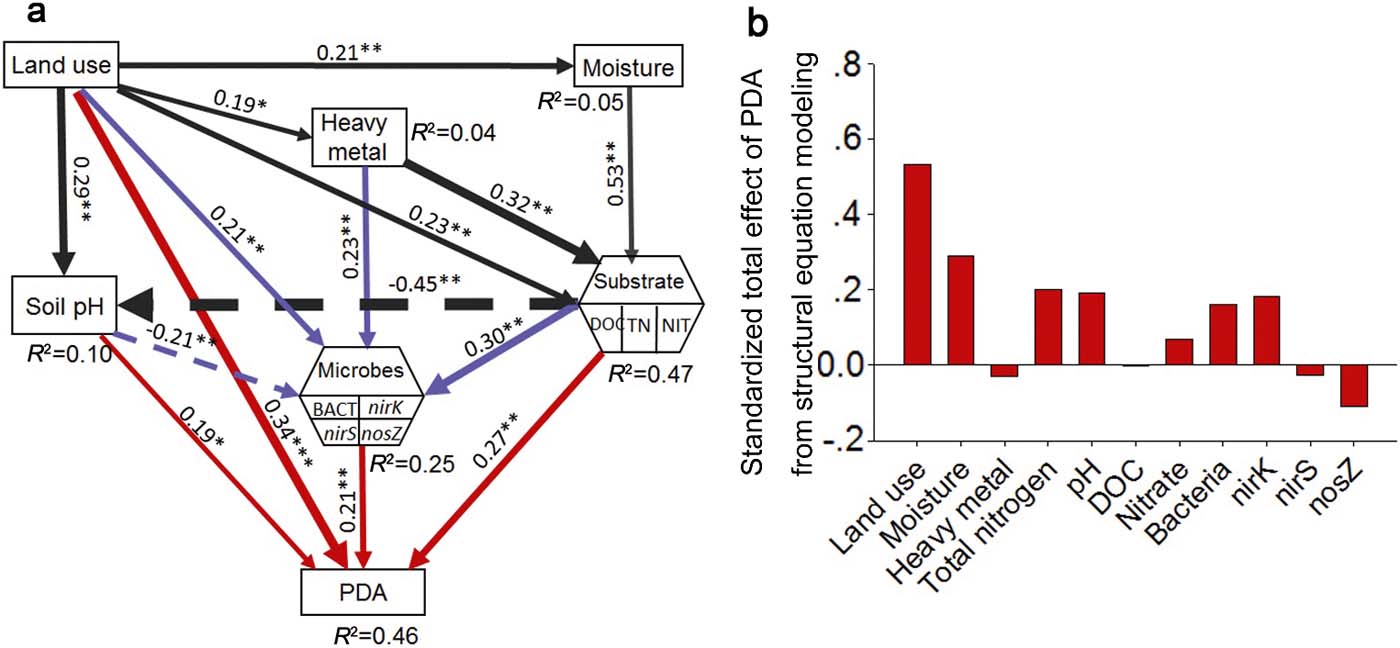
Results from the SEM analysis (Fig. 4a) indicate that land-use, microbial abundance, soil pH and substrates have direct effects on PDA prediction, while moisture and heavy metals have indirect effects via their influence on microbial abundance and substrate availability, respectively, but all of these effects are positive. Additionally, the SEM shows that land-use types, heavy metals and substrates had positive direct effects on microbes, while soil pH affected microbes negatively. The SEM also showed that substrates had a negative effect on soil pH. Land-use types had direct effects on all the factors included in the model.

Figure 4 Structural equation models (SEMs) based on the effects of land use, moisture (soil water content), soil pH, heavy metal, substrate and microbes on soil PDA (a) and standardised total effects of PDA from structural equation modelling (b). Abbreviations: BACT=bacteria; DOC=dissolved organic carbon; TN=total nitrogen; NIT = nitrate. Numbers close to arrows are standardised path coefficients, analogous to partial regression weights and indicative of the effect size of the relationship. Continuous arrows indicate positive relationships, while a dashed arrow indicates negative. Arrow width is proportional to the strength of path coefficients. R 2 indicates the proportion of variance explained and appears above every response variable in the model. Significance levels are as follows: *P<0.05, **P<0.01, ***P<0.001. The SEM models fitted our data, as suggested by χ 2 values and df (χ 2=10.7, P=0.03, df=4), bootstrap P=0.06, and by values of RMSEA=0.09 (P=0.12; Schermelleh-Engel et al. Reference Schermelleh-Engel, Moosbrugger and Müller2003).
The SEM results show that land-use type was the most important predictor (Fig. 4b) regulating PDA via changes in substrate concentrations, microbial abundance and heavy metals. Land-use types were also the most important driver of nirK (supplementary Fig. 3b) and nirS (supplementary Fig. 3c) abundance, while TN was the most important predictor of total bacteria (supplementary Fig. 3a) and nosZ (supplementary Fig. 3d). The most important predictors for PDA were moisture > TN > soil pH > nirK > total bacteria > nosZ. However, heavy metals, nitrate and DOC were of low direct importance to PDA in the used model. Heavy metals were the second most important determinant of both nirK and nosZ abundance, followed by TN and land-use types, respectively. Heavy metals were not so important in nirS determination compared to nirK and nosZ.
4. Discussion
4.1. Land-use influences on denitrification rates at a regional scale
The results from our study provide strong evidence that land use is the main driver of potential denitrification at a regional scale. In particular, farm use followed by urban land use had the greatest influence on PDA. It is well known that soil PDA is often closely related to nitrate or TN (Wang et al. Reference Wang, Feng, Liao, Zheng, Butterbach-Bahl, Zhang and Jin2013). With farm soil, greater nitrogen inputs from inorganic fertilisers stimulate soil denitrification (Dong et al. Reference Dong, Zhu and Zeng2014) and results in greater N2O emission (Wei et al. Reference Wei, Hao, Xue, Shi, Horton, Wang and Zang2010b). Denitrification in urban environments was significantly greater than that in the forest, and although there was no significant difference between urban and the other three land-use types (nursery, rural road and barren), there was a trend towards greater denitrification in urban soil over the other three. The higher PDA in urban soil may be linked to greater nitrogen deposition, which has been reported to be the second most important nitrogen input to soil in China (Cui et al. Reference Cui, Shi, Groffman, Schlesinger and Zhu2013). Also, the neutral or alkaline nature of urban soils (Table 1) can explain the high PDA, which provides optimal conditions for denitrification (Yu et al. Reference Yu, Zhang, Chen, Zhong, Zhu and Cai2014). Because denitrification has been identified as the major process generating N2O in soils (Webster & Hopkins Reference Webster and Hopkins1996; Bateman & Baggs Reference Bateman and Baggs2005; Ostrom et al. Reference Ostrom, Sutka, Ostrom, Grandy, Huizinga, Gandhi, von Fischer and Robertson2010), farm soil was expected to be the most important source for denitrification and N2O emission in this area, followed by urban soil. Owing to the increasing global population and rapid urbanisation (McDonald Reference McDonald2008), the area and intensity of farm and urban land-uses will increase, which will probably further stimulate denitrification activity to thus emit more N2O. Furthermore, the trend that the slightly greater ratio of (nirK+nirS)/nosZ in the urban soil (supplementary Fig. 2), implies that the ratio of N2O/(N2O+N2) of denitrification products may probably be greater in urban soil to pose serious environmental issues concerning the greenhouse effect of N2O.
Denitrification is mainly carried out by microbes. However, in our study, although denitrification functional genes positively correlated with the PDA (Spearman, P<0.5), the total bacteria and denitrification functional genes did not show the same responses as PDA between land-use types. As denitrification is known to be affected by many factors simultaneously, our results suggest that the co-effects of various factors such as TN may be a more important driver of denitrification than single environmental or biotic factors. This co-effect results from human activity and land-use. Although variation in the abundance of genes between land-use types was different from PDA, one-way ANOVA analyses showed that land-use types had significant effects on 16S rRNA (F=7.667, P<0.001), nirK (F=3.956, P=0.002), nirS (F=5.102, P<0.001) and nosZ (F=5.893, P<0.001). Thus, land-use types could not only affect microbes involved with N cycling (Bissett et al. Reference Bissett, Abell, Brown, Thrall, Bodrossy, Smith, Baker and Richardsson2014), but also total bacteria. Provision of inorganic fertilisers in farm soils has been shown to have a stimulant effect on the abundance of denitrification genes (Jin et al. Reference Jin, Li, Liu, Pan, Hussein and Liu2014; Zeng et al. Reference Zeng, Wang, Wang, Bai, Li, Duan, Su and Wu2014). In this study farm soil, which received more inorganic fertilisers than other soils also had the greatest denitrification gene abundance.
4.2. Main predictors of potential denitrification rates at a regional scale
First we used a random forest model to identify the main predictors of denitrification at a regional scale. The results from our random forest model indicated that after land-use types, TN, heavy metals, soil pH and nitrate are the most important predictors of denitrification (Fig. 3). Although it has been proposed for decades that land-use types are important in biogeochemical processes (Houghton et al. Reference Houghton, Hackler and Lawrence1999; Yu et al. Reference Yu, Zhang, Chen, Zhong, Zhu and Cai2014), few studies have provided such substantial evidence (Bouwman et al. Reference Bouwman, Beusen and Billen2009; Havaee et al. Reference Havaee, Ayoubi, Mosaddeghi and Keller2014). Our results suggest that human activity is much more important than any other environmental factor at a large scale. In this study, PDA positively correlated with TN (R=0.504, P<0.001), soil moisture (R=0.332, P<0.001), NH4+ (R=0.497, P < 0.001), nitrate (R=0.357, P<0.001) and DOC (R=0.275, P<0.001, supplementary Table 2), demonstrating that these factors play important roles in potential denitrification processes. Our findings are supported by previous studies (Amha & Bohne Reference Amha and Bohne2011; Sun et al. Reference Sun, Zhuge, Zhang and Cai2012; Castaldelli et al. Reference Castaldelli, Colombani, Vincenzi and Mastrocicco2013; Wang et al. Reference Wang, Feng, Liao, Zheng, Butterbach-Bahl, Zhang and Jin2013). However, in the random forest model, DOC and moisture were shown to be of no significance in predicting PDA. This can be attributed to the method of assessing denitrification. DOC (glucose) and water were added to soil to make the slurry for the PDA assay. In addition PDA also significantly correlated with all the tested gene abundances using Spearman correlation analysis (supplementary Table 2). The insignificant importance of genes, DOC and soil moisture in predicting denitrification in the random forest model can be attributed to the disproportionally greater effects of land-use types and TN on PDA which may have caused most of the variability in our model. However, there may been have been indirect effects from land-use types on potential denitrification.
Our SEM model identifies both direct and indirect positive impacts from land-use types on PDA. The significant direct and dominant effects of land-use types on PDA may be attributed to the abiotic properties not included in this model, such as soil texture, bulk density, quality of soil C, which have been reported to change according to land-use (Havaee et al. Reference Havaee, Ayoubi, Mosaddeghi and Keller2014) to thus play an important part in denitrification (Wollersheim et al. Reference Wollersheim, Trolldenier and Beringer1987; Rochester & Constable Reference Rochester and Constable2000). The indirect effects of land-use types on denitrification are mainly driven by changes in soil moisture, pH, substrate availability (e.g., total N and nitrate) and microbial abundance. In the model, land-use had direct effects on all chosen factors, indicating the dominant role that humans have in ecosystems (Vitousek et al. Reference Vitousek, Mooney, Lubchenco and Melillo1997a). As important factors of denitrification, soil pH (Pan et al. Reference Pan, Ye, Ni and Yuan2012; Sun et al. Reference Sun, Zhuge, Zhang and Cai2012) and substrates, including TN, DOC (Castaldelli et al. Reference Castaldelli, Colombani, Vincenzi and Mastrocicco2013) and nitrate (Wang et al. Reference Wang, Feng, Liao, Zheng, Butterbach-Bahl, Zhang and Jin2013), were shown to be important predictors of PDA in the structural equation model in this study, which are all directly affected by land-use types. As PDA is tested with adding enough water, moisture shows no obvious effect on PDA in SEM.
Heavy metals were identified to be an important factor driving soil denitrification in random forest analysis. However, they had no direct effect on PDA in the structural equation model. This suggests that heavy metals exert influence on denitrification mainly via other factors. Cu is the structural component of enzymes encoded by nirK and nosZ genes, and has been reported to alter soil/sediment denitrification (Magalhaes et al. Reference Magalhaes, Machado, Matos and Bordalo2011). Similarly, Zn, Pb and Cd have been reported to have significant effects on the total N denitrified and can enhance released N2O (Magalhaes et al. Reference Magalhaes, Costa, Teixeira and Bordalo2007), or the bacterial community and denitrification community (Sobolev & Begonia Reference Sobolev and Begonia2008). Therefore, irrespective of biological role, trace metals influence ecosystem functions via microbial abundance and enzyme activities (Fig. 4a).
Although PDA has been widely used to describe denitrification in both the field and the laboratory (Pell et al. Reference Pell, Stenberg, Stenstrom and Torstensson1996; Yin et al. Reference Yin, Fan, Song, Cui, Li and Liang2015), there are some weaknesses from ignoring the effects of moisture, DOC and oxygen on denitrification. Thus, we can conclude that land use is the most important driver of potential denitrification rather than actual denitrification rates at a regional scale. Nonetheless, our study provides evidence on environmental drivers of PDA at a regional scale.
5. Conclusions
Our results provide empirical evidence that land-use type is the main driver of potential denitrification at a regional scale. In particular, farm and urban land-use types had the highest PDA. Our findings further indicate that increasing substrate availability and changes in microbial abundance linked to farm and urban land-use types indirectly resulted in the greatest PDA for these land uses. These results help us with our understanding of the response of ecosystems to increases in land-use intensity and environmental change such as from pollution and climatic change.
6. Acknowledgements
We thank the Strategic Priority Research Program of Chinese Academy of Sciences (Grant NO. XDB15020302), the International Science & Technology Cooperation Program of China (2011DFB91710) and the Natural Science Foundation of China (31270153 and 31272256) for the support of this work. We are grateful to Lars Molstad from the Norwegian UMB-Nitrogen-group (http://www.umb.no/nitrogengroup/) for designing and programming our robotised (incubation) system for gas analysis.
7. Supplementary material
Supplementary material is available online at https://doi.org/10.1017/S175569101800066X