


Introduction
Population ageing is on the brink of becoming an important issue in developing countries, whose populations are expected to age rapidly in the first half of the 21st century. Older people (defined hereafter as those aged 60 and over) living in the developing regions accounted for more than 65 per cent of the world's older population in 2017. The older population of those regions is projected to make up about 79 per cent of the world older population by 2050 (United Nations Department of Economic and Social Affairs, Population Division, 2017). According to the World Health Organization (WHO, 2014), older people face a number of age-specific health issues, among which non-communicable diseases (NCDs) have become major health and development challenges across societies and economies, especially in low- and middle-income countries. In particular, 38 million deaths (68% of deaths) worldwide in 2012 were attributed to NCDs, which are projected to be the leading cause of death by 2050. More seriously, in low- and middle-income countries, NCDs are responsible for approximately three-quarters of deaths and 82 per cent of premature deaths in those economic regions (WHO, 2014). Greater longevity is the result of improvements in health care and nutrition, but on the other hand, living longer has been found to increase the number of healthy years lost to disabilities caused by NCDs, and to increase medical costs (Salomon et al., Reference Salomon, Wang, Freeman, Vos, Flaxman, Lopez and Murray2012).
Viet Nam, as a low-middle-income country, is not an exception to such demographic and health trends: the United Nations Economic and Social Commission for Asia and the Pacific (2017) reports that the advance of population ageing of Viet Nam is projected to be the fastest in that region. According to General Statistics Office of Viet Nam (2016) forecasts, the proportion of older people in Viet Nam will increase from 12 per cent in 2016 (11 million persons) to about 25 per cent by 2050 (27 million persons). At the same time, various studies report that each Vietnamese older person, on average, suffers more than two diseases, and that the disease types have changed swiftly from communicable diseases to NCDs (Dam et al., Reference Dam, Pham, Nguyen, Nguyen, Nguyen, Tran and Vu2010; United Nations Population Fund (UNFPA), 2011; Giang et al., Reference Giang, Pham and Pham2016). Particularly, NCDs caused 73 per cent of deaths and 66 per cent of the total disease burden in Viet Nam in 2012 (Viet Nam Ministry of Health (VNMoH), 2016). In addition, the burden of diseases as measured by Disability-adjusted Life Years (DALY) shows that NCDs are the main cause of increasing DALY among Vietnamese elderly, with cardiovascular disease and cancer accounting for the largest share (VNMoH and Health Partnership Group (HPG), 2018). Kelly et al. (Reference Kelly, Giang and Pham2018) show that all the top diseases for older people, in terms of both health-check frequency and cost, were NCDs (such as neoplasms, diseases of the circulatory system and diseases of the respiratory system). The top diseases account for just under 45 per cent of inpatient admissions and outpatient visits, but for more than 80 per cent of total medical costs.
Such a rapidly ageing population, along with disease trends towards NCDs, present a number of challenges for governments in terms of care for older people. To provide appropriate health-care policy in response to such situations, there is a need for an accurate understanding of the socio-economic factors associated with NCDs for different older population groups, since inequalities in health and health care are widening both among socio-economic groups and between rural and urban areas. It is evident that rural older people are more disadvantaged than urban ones in terms of access to health care and ability to pay high health-care costs (VNMoH and HPG, 2018). Numerous studies have examined NCDs in older people in Viet Nam (see e.g. Hoang et al., Reference Hoang, Dao and Kim2008; Dam et al., Reference Dam, Pham, Nguyen, Nguyen, Nguyen, Tran and Vu2010; Mwangi et al., Reference Mwangi, Kulane and Le2015; Ninh et al., Reference Ninh, Ninh, Khanal and Moorin2015; Giang et al., Reference Giang, Pham and Pham2016). But, those studies generally describe the prevalence of NCDs and identify factors associated with NCDs – none of them examined health inequality in terms of NCDs across socio-economic groups.
This study is an effort to compensate for the limitations of previous studies in Viet Nam so as to (a) determine whether socio-economic-related health inequality in self-reported NCDs exits between older people living in urban and rural areas; (b) identify factors that correlate with probability of reporting NCDs; and (c) decompose association between determinant factors and self-reported NCDs to identify the relative contributions of those determinants to explanation of the inequality in self-reported NCDs between rural and urban older people. Concentration index decomposition analysis is of use here because it has desirable properties in terms of measurement and explanation of inequality in health across the entire distribution of socio-economic status. Particularly, the decomposition analysis translates association between each determinant factor and health variables of interest into percentage contribution to health inequality as a function of the impact of the determinant factors on health variable (elasticity) and the unequal distribution of the determinants across socio-economic groups (O'Donnell et al., Reference O'Donnell, van Doorslaer, Wagstaff and Lindelow2008).
Data and methods
Data
The data analysed here are from the Viet Nam Ageing Survey (VNAS) conducted in late 2011, which was the first-ever nationally representative survey on people aged 50 and over in Viet Nam. The VNAS utilised a sampling frame of the 2009 Population and Housing Census to draw a representative sample of 4,007 respondents from 12 provinces, 200 communes and 400 villages via a stratified multi-stage sampling method. The VNAS contains valuable information on socio-demographic characteristics, household assets and health conditions. That information is a potential resource for application in studies on socio-economic-related health inequality. The VNAS data were collected by means of face-to-face interviews; the response rate of the survey was around 96 per cent.
This study focused on older people only (defined as those aged 60 and older), so the sample was 2,789 older people. The sample was further narrowed due to missing variables of interest (N = 107 equivalent to 3.84% of the total sample). The final sample for this study was 2,682 older people, 1,979 of whom were living in rural areas and 703 in urban areas.
Variable measures
Health variable – dependent variable
The dependent health variable of this study was self-reported NCDs, as indicated by responses to the question, ‘Have you ever been diagnosed or told that you have…?’ with a list of diseases including arthritis, angina, diabetes, chronic lung disease, emphysema, bronchitis, chronic obstructive pulmonary disease, depression, blood pressure problems, oral health, cancer, cataract, heart diseases, liver disease and prostate hyperplasia. In this study, we excluded prostate hyperplasia because it only applied to men. Next, a binary variable of self-reported NCDs was constructed based on the respondents’ self-reported health conditions: 0 indicated ‘having no NCDs’ and 1 indicated ‘having at least one NCD’.
Measurement of wealth index
Socio-economic inequality was measured using the household wealth index proposed by Vyas and Kumaranayake (Reference Vyas and Kumaranayake2006). Principal component analysis (PCA) was applied to construct a wealth index (Wagstaff and Naoko, Reference Wagstaff and Naoko2003). The PCA requires information on household ownership of a wide range of durable assets (e.g. cars, motorbikes, colour television sets, mobile phone, landline telephones, VCD/DVD players); dwelling characteristics (e.g. materials of roof and floor); and access to utilities (e.g. sources of lighting) and sanitation facilities (e.g. type of toilet and sources of drinking water). Households are ranked based on the asset ladder from poorest to wealthiest. Following this, the wealth scores were divided into five quintiles, among which the first quintile indicated the poorest and the fifth was the wealthiest. It has been suggested that this measurement of wealth index is preferred for low- and middle-income countries, where reliable data on income are difficult to collect and much of the income generated is non-monetary, or is from informal resources (WHO, 2013).
Measurement of covariates
Demographic characteristics included an interaction between five age groups and sex, resulting in ten dummy variables (men aged 60–64, 65–69, 70–74, 75–79, 80 and over; women aged 60–64, 65–69, 70–74, 75–79, 80 and over); marital status was dichotomous (married = 0, unmarried = 1); ethnicity was divided into two sub-categories (Kinh people = 0, non-Kinh people = 1); living arrangement was coded into four dummy variables (living alone; living with spouse only; living with spouse and children only; living with others, with or without spouse and child(ren)); place of residence was categorised as rural and urban areas; and region of Viet Nam was divided into six dummy variables (Red River Delta, Northern Midland and Mountainous Areas, Central Coast, Central Highlands, Southeastern, Mekong River Delta).
Socio-economic variables included educational level presented by four dummy variables (no schooling/uncompleted primary school, primary school, secondary, high school and above); employment status of respondents at the time that VNAS was conducted was divided into two categories (currently not working = 0, currently working = 1); subjective measure of income, i.e. perceived sufficiency of income, was dichotomous (insufficient = 0, sufficient = 1); and social health insurance was coded as a binary choice to show holding status (no = 0, yes = 1).
Statistical analysis
A number of studies (see e.g. UNFPA, 2011; Giang and Phi, Reference Giang and Phi2016) have found that older people living in urban and those living in rural areas differ in terms of health conditions, so we provided descriptive analyses of Vietnamese older people's health conditions along with characteristics stratified by rural and urban areas. A chi-square test was utilised to determine whether differences in characteristics were statistically significant for rural and urban areas. In all calculations, we used survey data commands (svy) to make all results representative for Vietnamese older people as a whole, and to account for complex survey designs (e.g. sampling weights and clustering). Model specifications for nonlinear models for both rural and urban areas were checked using Pregibon's link test (Pregibon, Reference Pregibon1980), see supplementary material for further discussion on the model specification. Results of the model specifications showed that the models passed the test. Stata version 15.1 software was used to execute all statistical analyses used in this study and the significance levels were set at p < 0.05.
Measures of inequality
Measurement of inequality is well established in the literature and widely applied in studies on health inequality, as seen in a number of empirical studies across country settings (Wagstaff et al., Reference Wagstaff, Paci and van Doorslaer1991; van Doorslaer et al., Reference van Doorslaer, Wagstaff, Bleichrodt, Calonge, Gerdtham, Gerfin, Geurts, Gross, Häkkinen, Leu, O'Donnell, Proper, Puffer, Rodríguez, Sundberg and Winkelhake1997, Reference van Doorslaer, O'Donnell, Rannan-Eliya, Somanathan, Adhikari, Garg, Harbianto, Herrin, Huq, Ibragimova, Karan, Ng, Pande, Racelis, Tao, Tin, Tisayaticom, Trisnantoro, Vasavid and Zhao2006; van Doorslaer and Koolman, Reference van Doorslaer and Koolman2004; Van de Poel et al., Reference Van de Poel, O'Donnell and van Doorslaer2007). Researchers have proposed several mechanisms for measurement of inequalities in health: the most frequently encountered measures were: the range (Townsend and Davidson, Reference Townsend and Davidson1982); the Gini coefficient (Le Grand and Rabin, Reference Le Grand, Rabin, Culyer and Jonsson1986; Illsley and Le Grand, Reference Illsley, Le Grand and Williams1987; Le Grand, Reference Le Grand1987); the index of dissimilarity (Preston et al., Reference Preston, Haines and Parmuk1981); the slope and relative index of inequality (Preston et al., Reference Preston, Haines and Parmuk1981; Pamuk, Reference Pamuk1985, Reference Pamuk1988); and concentration index (CI) (Wagstaff et al., Reference Wagstaff, van Doorslaer and Paci1989). Wagstaff et al. (Reference Wagstaff, Paci and van Doorslaer1991) propose three fundamental requirements for an appropriate measurement of health inequality: (a) it must reflect the socio-economic dimension of the (ill) health inequality; (b) it must encompass the experience of the entire population, and (c) it must be sensitive to changes in rank across socio-economic groups. Among those inequality indices, only two satisfied the requirements: the relative index of inequality and the CI, which are related. van Doorslaer et al. (Reference van Doorslaer, Wagstaff, Bleichrodt, Calonge, Gerdtham, Gerfin, Geurts, Gross, Häkkinen, Leu, O'Donnell, Proper, Puffer, Rodríguez, Sundberg and Winkelhake1997) argue that the CI has an advantage over the relative index of inequality in terms of immediate visual appeal. Therefore, the CI was adopted here as the measure of inequalities in health. Details of the concentration curve (CC), the CI and decomposition technique of socio-economic inequality are presented below.
Concentration curve (CC)
CC is used to detect socio-economic inequality in the health variables of interest, particularly socio-economic inequality in self-reported NCDs between the sampled rural and urban older people. Technically, the CC plots the cumulative percentage of those living in rural (urban) areas, ranked by socio-economic status (as measured by household wealth), in order from poorest to richest (on the x-axis), against the cumulative percentage of self-reported NCDs (on the y-axis). If the CC lies exactly at the 45° line (known as the line of equality), then self-reported NCDs are equally distributed across wealth. On the other hand, if the CC lies above or below the line of equality, then inequality in self-reported NCDs exists and favours the rich or the poor, respectively. The further the distance between the CC and the line of equality, the greater the degree of socio-economic inequality in self-reported NCDs (Kakwani et al., Reference Kakwani, Wagstaff and van Doorslaer1997).
Concentration index (CI)
The CI, defined as twice the area between the CC and the line of equality, is used to quantify the magnitude of an inequality. The CI with sampling weight can be computed as (van Doorslaer and Koolman, Reference van Doorslaer and Koolman2004):
 $${\rm CI} = \displaystyle{2 \over {N\mu }}\mathop \sum \limits_{i = 1}^N w_{i\;}y_iR_i - 1$$
where N is the sample size; y i is the health variable of interest (here the self-reported NCDs); w i is the sampling weight scaled to sum to 1 and w 0 = 0; μ is the weighted mean of y i; and R i is the weighted fractional rank of the ith individual. In particular, R i indicates the cumulative proportion of the population up to the mid-point of each individual interval (O'Donnell et al., Reference O'Donnell, van Doorslaer, Wagstaff and Lindelow2008):
 $$R_i = \mathop \sum \limits_{\,j = 0}^{i - 1} w_j + \displaystyle{1 \over 2}w_i\;{\rm where}\;w_0 = 0.$$
The values of the CI range from −1 to 1, or from μ − 1 to 1 − μ (Wagstaff, Reference Wagstaff2005) in the case where the health variable is dichotomous, as is the case here. Because the CI and CC are closely related, they share similarities in terms of interpretation. Particularly, there is a perfectly equal distribution of health across socio-economic groups of the population if the CI has a value of zero. Health inequality favours the rich (the poor) if the CI has a negative (positive) value (Kakwani et al., Reference Kakwani, Wagstaff and van Doorslaer1997). Although the standard CI has a number of properties useful for the measurement of inequalities in health, it has been found to have some limitations. Firstly, the CI causes difficulties in comparison of populations in the case of bounded health variables, because the CI could depend on the mean of the health variables (e.g. each population has a different mean of health variables) (Erreygers, Reference Erreygers2009). Secondly, if the health variables of interest are dichotomous, the minimum and maximum values of the CI are not necessarily −1 and 1 (Wagstaff, Reference Wagstaff2005). Thirdly, the CI does not satisfy the ‘mirror property’, since inequalities in health do not mirror individuals with ill-health (Erreygers and Van Ourti, Reference Erreygers and Van Ourti2011). Erreygers (Reference Erreygers2009) proposes a corrected version of the standard CI to address the limitations; the corrected version is known as Erreygers concentration index (EI). Utilising the standard CI calculated from Equation (1), the EI can be computed as:
 $${\rm EI} = \displaystyle{{4\mu } \over {y_{{\rm max}} - y_{{\rm min}}}} \times {\rm CI}$$
where y max and y min are the extremes of the health variable and CI is the standard concentration index. The values of the EI varies between −1 and 1. In addition, the sign of EI indicates the direction of the relationship between the health variable and socio-economic status. The magnitude of EI reflects the strength of the relationship and the degree of variability in the health variable (Erreygers, Reference Erreygers2009). There has been wide application of the EI in cross-sectional studies on income-related and socio-economic-related health inequality across setting contexts (Van de Poel et al., Reference Van de Poel, O'Donnell and van Doorslaer2007, Reference Van de Poel, van Doorslaer and O'Donnell2012; Costa-Font et al., Reference Costa-Font, Hernández-Quevedo and Jiménez-Rubio2014; Gonzalo-Almorox and Urbanos-Garrido, Reference Gonzalo-Almorox and Urbanos-Garrido2016). In this study, we calculated both the CI and EI for self-reported NCDs, and then compared the estimates for rural and urban areas.
Indirect standardised CI with nonlinear models
As suggested by Kakwani et al. (Reference Kakwani, Wagstaff and van Doorslaer1997), total health inequality can be divided into avoidable and unavoidable components. Particularly, biological influences (such as age and sex) can be considered unavoidable components, while factors other than age and sex can be considered avoidable components. With that in mind, we utilised an indirect standardised method for the CI to describe the distribution of self-reported NCDs by wealth, conditional on confounding variables x (age–sex dummies). This standardisation is known as the age–sex standardised health distribution (O'Donnell et al., Reference O'Donnell, van Doorslaer, Wagstaff and Lindelow2008). Furthermore, we included control variables z (e.g. marital status, living arrangement, region, health insurance, education, employment status, household wealth, perceived sufficiency of income). It is important to note that we do not aim to standardise for z variables, rather we aim to estimate partial correlations of z variables with x variables, and to avoid omitted-variables bias (O'Donnell et al., Reference O'Donnell, van Doorslaer, Wagstaff and Lindelow2008). It has been found that least square regression analysis is not suitable for estimation of the indirect standardisation in the case where a health variable is dichotomous. Therefore, O'Donnell et al. (Reference O'Donnell, van Doorslaer, Wagstaff and Lindelow2008) propose nonlinear models to estimate the relationship between a health variable and confounding and control variables. The nonlinear models can be written as:
 $$y_i = G\left({\alpha + \mathop \sum \limits_j \beta_jx_{\,ji} + \mathop \sum \limits_k \gamma_kz_{ki}} \right)+ \varepsilon _i$$
where y i is the health variable (here self-reported NCDs); G takes the particular form for the probit model; α, β and γ are parameter vectors to be estimated; i indicates the individual, k denotes the number of control variables; and ɛi is the error term. The indirect standardisation procedure for self-reported NCDs can be computed as:
 $$\eqalign{\hat y_i^{IS} & = y_i - G\left({\widehat{{\alpha \;}} + \mathop \sum \limits_j \widehat{{\beta_j}}x_{\,ji} + \mathop \sum \limits_k \widehat{{\gamma_k}}\overline {z_k} } \right) \cr & + \displaystyle{1 \over N}\mathop \sum \limits_{i = 1}^N G\left({\widehat{{\alpha \;}} + \mathop \sum \limits_j \widehat{{\beta_j}}x_{\,ji} + \mathop \sum \limits_k \widehat{{\gamma_k}}\overline {z_k} } \right)}$$
where  $\hat y_i^{IS} $ is the indirect standardised self-reported NCDs;
  $\hat \alpha $,
  $\hat \beta $ and
  $\hat \gamma $ are the estimated parameters obtained from the probit models; and
  $\overline {z_k} $ is set to their means. Intuitively,
  $\hat y_i^{IS} $ can be interpreted as the distribution of self-reported NCDs that would be expected to be observed, regardless of differences in the distribution of age–sex across wealth (O'Donnell et al., Reference O'Donnell, van Doorslaer, Wagstaff and Lindelow2008).
Marginal effects
Results of the marginal effects show the association of self-reported NCDs and covariates. Signs of those coefficients indicate directions of the association between self-reported NCDs and covariates. For example, a positive sign indicates a positive association of that variable with the probability of reporting self-reported NCDs, and the inverse is true for a negative coefficient. The magnitude of coefficients provides us with the degree of the association between self-reported health and covariates. Particularly, the larger the coefficients are, the stronger the association is.
Decomposition analysis of socio-economic inequality
We utilised concentration index decomposition analysis, proposed by Wagstaff et al. (Reference Wagstaff, van Doorslaer and Watanabe2003), to determine the relative contribution of each determinant to socio-economic-related health inequality in self-reported NCDs between rural and urban older people. Particularly, a health variable can be written in terms of a linear additive regression model as:
 $$y_i = \alpha + \mathop \sum \limits_k \beta _kx_{ki} + \varepsilon _i$$
where y i is the health variable (here self-reported health); x k are the covariates; and ɛi is the error term. Given the relationship between y i and x ki in Equation (6), the CI of y i can be written as (Wagstaff et al., Reference Wagstaff, van Doorslaer and Watanabe2003):
 $${\rm CI} = \mathop \sum \limits_k \lpar \beta _k\overline {x_k} /\mu \rpar {\rm C}{\rm I}_k + {\rm G}{\rm C}_\varepsilon /\mu $$
where μ is the mean of y;  $\overline {x_k} $ is the mean of x k; CIk is the CI of x k (here defined analogously to CI);
  $\lpar \beta _k\overline {x_k} /\mu \rpar $ is the elasticity of the health variable with respect to the covariates (x k); and GCɛ is the generalised CI for the error term ɛ which is defined as (Wagstaff et al., Reference Wagstaff, van Doorslaer and Watanabe2003):
 $${\rm G}{\rm C}_\varepsilon = \displaystyle{2 \over N}\mathop \sum \limits_1^N \varepsilon _iR_i.$$
In the case where a health variable is binary, a linear regression is inappropriate for application in such decomposition analysis. However, one way to compute estimations of binary variables is through maximum likelihood, estimated by probit models; then decomposition analysis can be carried out if some linear approximations of the probit models are produced (O'Donnell et al., Reference O'Donnell, van Doorslaer, Wagstaff and Lindelow2008):
 $$y_i = \alpha ^m + \mathop \sum \limits_k \beta _k^m x_{ki} + \varepsilon _i.$$
The decomposition analysis of nonlinear models can be written as (O'Donnell et al., Reference O'Donnell, van Doorslaer, Wagstaff and Lindelow2008):
 $${\rm CI} = \mathop \sum \limits_k \lpar \beta _k^m \overline {x_k} /\mu \rpar {\rm C}{\rm I}_k + {\rm G}{\rm C}_\varepsilon /\mu $$
where  $\beta _k^m $ is the partial effect (dy/dx k), which is estimated from the probit models and is evaluated at the sample mean. This study used the EI decomposition technique instead of the CI decomposition one, therefore the former can be computed as (Van de Poel et al., Reference Van de Poel, van Doorslaer and O'Donnell2012):
 $${\rm EI} = 4\bigg( \mathop \sum \limits_k \lpar \beta _k^m \overline {x_k} \rpar {\rm C}{\rm I}_k + {\rm G}{\rm C}_\varepsilon \bigg) $$
where the first term on the right-hand side of Equation (11), known as the ‘explained’ component, provides the contribution of each covariate to health inequality across socio-economic distribution. Particularly, the contribution of each covariate is the product of the elasticity (defined as the impact of each covariate to the health variable) ( $\beta _k^m \overline {x_k} \rpar $ and the degree of unequal distributions of the covariates across socio-economic groups (CIk). A positive (negative) contribution indicates that, if health inequality is determined by that variable alone, then it would favour the poor (the rich) (Wagstaff et al., Reference Wagstaff, van Doorslaer and Watanabe2003). The second term on the right-hand side of Equation (11) is known as the ‘unexplained’ component, i.e. which cannot be explained by variation in x k across socio-economic distribution (Wagstaff et al., Reference Wagstaff, van Doorslaer and Watanabe2003). Following that, the relative contribution of each covariate to health inequality is computed by dividing its contribution to the overall EI, which is calculated using Equation (3).
Results
Descriptive results
Weighted results of the sample characteristics stratified by rural and urban areas are presented in Table 1. On average, approximately 72 per cent of Vietnamese older people surveyed suffered at least one self-reported NCD, with a mean of around 1.6 NCD points. However, the difference in prevalence of self-reported NCDs was not statistically significant between rural and urban areas. The youngest older age group accounted for the largest share of the study sample (30.4%), followed by the oldest older group (22.7%). Women (56.8%) dominated men (43.2%) numerically. Married was the most common marital status among Vietnamese older people (approximately 69%). Co-residing with others, with/without spouse and child(ren) was the most frequent household composition (approximately 61%) and the least frequently seen was living alone (5.8%). The study sample was drawn mostly from the Red River Delta (27.9%) and Southeastern regions (26.7%); together those two sub-regions accounted for more than half of the older people surveyed. The proportion of rural and urban areas in the two sub-regions varied by sub-regions. Kinh people (approximately 90%) greatly outnumbered non-Kinh people. No schooling/incomplete primary school constituted around 50 per cent of the study sample. The proportion of older people with higher education levels (e.g. secondary and higher) for urban areas was significantly greater than that for rural areas. Non-working people significantly outnumbered those currently working (around 61% versus 39%, respectively) for both areas, though the share for urban areas was significantly higher than that for their rural counterparts. This implies that more rural older people than urban ones were engaged in work. Despite a higher proportion of working individuals, rural residents evaluated their income as poorer than urban people did (66.4% versus 49.3%, respectively). Interestingly, the poorest and second poorest quintiles of household wealth were disproportionately concentrated among urban residents, and the second wealthiest and wealthiest quintiles were highly concentrated among rural residents. The majority of older people had social health insurance (around 73%), though the figure was higher for urban areas than for rural ones.
Table 1. Weighted percentages and means of demographic and socio-economic characteristics of Vietnamese older people, by place of residence
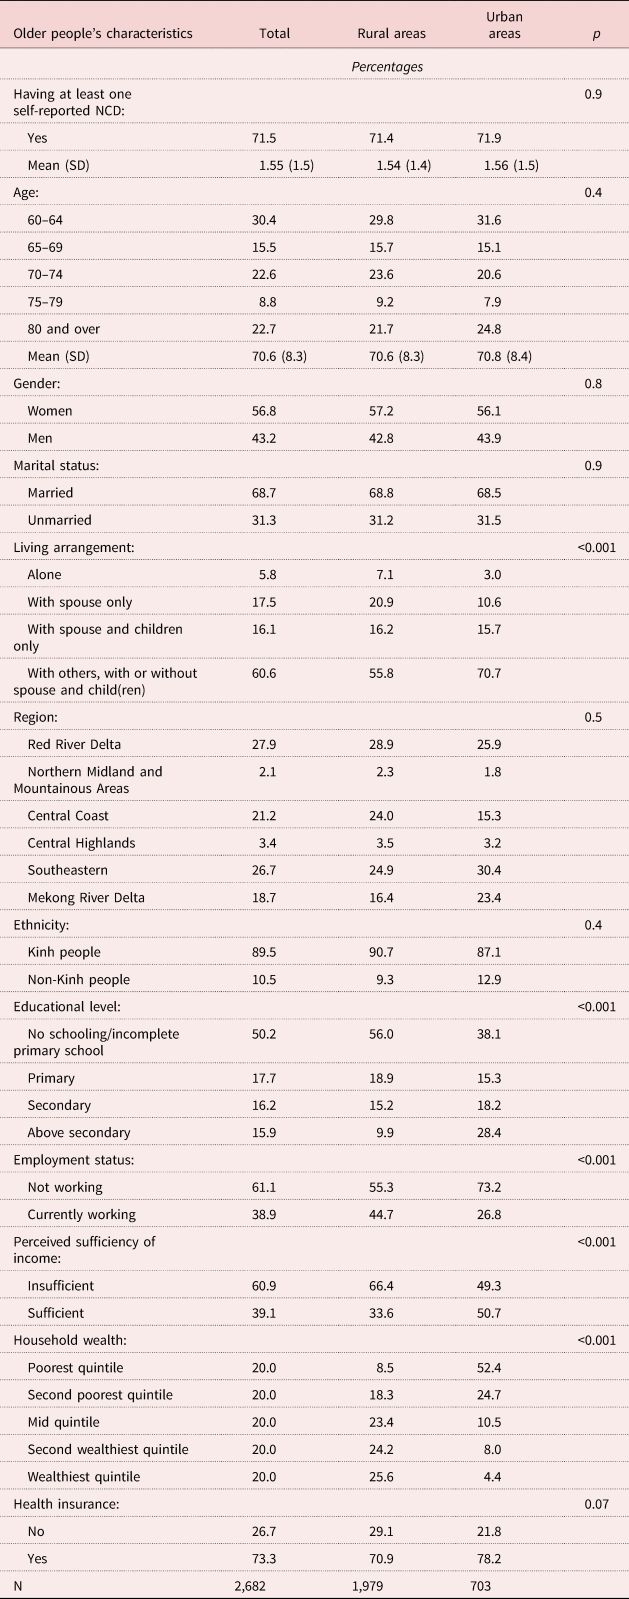
Notes: N = 2,682. NCD: non-communicable disease. SD: standard deviation.
To afford a better representation of the distribution of self-reported NCDs across socio-economic distribution stratified by urban and rural areas, Figure 1 shows the weighted mean of reporting at least one NCD by household wealth in rural and urban areas. In the figure, the socio-economic gradient in self-reported NCDs is clearly visible. In particular, the mean was highly concentrated among those with the lowest wealth, while the opposite was observed among those with the highest wealth in both areas.

Figure 1. Weighted mean of reporting at least one non-communicable disease (NCD) by household wealth for rural and urban areas.
The CCs and CIs
Figure 2 presents the unstandardised CCs and the unstandardised generalised CCs of self-reported NCDs in rural and urban areas. The procedure for plotting the unstandardised generalised CCs is similar to that for the CCs, with the one exception that the health variable is multiplied by its mean (Chantzaras and Yfantopoulos, Reference Chantzaras and Yfantopoulos2018). Both CCs and unstandardised generalised CCs indicated a disproportionate concentration of self-reported NCDs in the poor for both areas.

Figure 2. The concentration curves (CCs) and generalised CCs of unstandardised self-reported non-communicable diseases (NCDs) by wealth for rural and urban areas.
Table 2 shows the results of (a) the unstandardised CI and EI; (b) the indirect standardised CI and EI for the age–sex standardisation; and (c) the indirect standardised CI and EI for the age–sex standardisation and other covariates in both areas. All the standardised and unstandardised CIs and EIs were negative, which confirms the CC results and indicates that prevalence of self-reported NCDs was more highly concentrated for the poor in both areas. In addition, the magnitude of socio-economic-related health inequality in self-reported NCDs was larger for urban areas than for rural ones (all the indices were statistically significant). However, the indirect standardised indices revealed differences between rural and urban areas when the effects of age–sex standardisation and other covariates were taken into account. In particular, standardising CIs and EIs seems to offset the inequality in urban areas, since the values of CIs and EIs decreased relative to the unstandardised indices. In contrast, the inequality was greater when the indirect standardised procedure was applied for rural areas.
Table 2. The concentration index (CI) and Erreygers concentration index (EI) of reporting at least one non-communicable disease among Vietnamese older people living in rural and urban areas

Notes: Standard errors are in parentheses. Covariates included marital status, ethnicity, living arrangement, region, education, employment status, socio-economic status (wealth index), perceived sufficiency of income and health insurance.
Significance levels: * p < 0.05, ** p < 0.01.
Marginal effects
Table 3 shows the results of the marginal effects of the determinants on self-reported NCDs for rural and urban areas obtained with the probit models. People with higher household wealth living in the Southeast and currently working were negatively associated with the probability of reporting at least one NCD, whereas being female and older and having social health insurance increased the probability of reporting at least one NCD in older rural areas. Among these determinants, household wealth was the strongest predictor, e.g. those in the second wealthiest and wealthiest quintiles, with other variables held constant, would have 10.9 (95% confidence intervals (CI) = −0.212, −0.008) and 21.2 (95% CI = −0.349, −0.076) percentage points lower probability of reporting at least one NCD, respectively, than those in the poorest quintile. The pattern of the determinants in urban areas was similar to that for rural ones. In particular, the increased probability of reporting at least one NCD was social health insurance. The protective factors were living in the Southeast and higher household wealth, with household wealth being the strongest predictor.
Table 3. Marginal effect coefficients of the determinants of self-reported non-communicable diseases among Vietnamese older people, by place of residence

Notes: Standard errors are in parentheses. Ref.: reference category.
Significance levels: * p < 0.05, ** p < 0.01.
Decomposition analysis
Results of the EI decomposition analysis are presented in Table 4, including the results for the elasticity, the EI of each determinant and the relative contribution of each determinant to the overall inequality in self-reported NCDs. The elasticity reflects the impact of each determinant on self-reported NCDs: the larger the elasticity of self-reported NCDs with respect to the determinants, the larger the contribution of these determinants to the inequality. Intuitively, the degree of contribution largely depends on how much sensitivity the determinants have on self-reported NCDs. For example, CIk of perceived sufficiency of income was relatively large (−0.398), but there was little sensitivity of self-reported NCDs to variation of this variable (−0.019). Therefore, contribution of that variable to the overall inequality in self-reported NCDs was relatively low. Regarding the CIk values, a negative (positive) value indicates that the variable has pro-poor (pro-rich) distribution. In both areas, for instance, working was more highly represented among the rich (0.114 and 0.166 for rural and urban areas, respectively). As for contribution, as a product of the elasticity and the CIk, a positive sign means that if socio-economic-related health inequality in self-reported NCDs is determined by that variable alone (i.e. holding other variables in the model constant), then the inequality would favour the rich and vice versa. For example, the overall contribution of both areas was negative (−0.045 for rural and −0.056 for urban areas), which implies that self-reported NCDs were more highly concentrated among the poor, and that the degree of inequality was greater for urban than for rural areas. The unexplained components (the residual shown in the last row) were −0.065 and −0.14 for rural and urban areas, respectively. The contribution was then converted into the relative contribution of each determinant to the overall socio-economic-related health inequality in self-reported NCDs. A negative sign means that the combined marginal effects of the determinants and the determinants’ unequal distributions with respect to wealth decrease the socio-economic-related health inequality in self-reported NCDs, and that the inverse is true for a positive sign. In rural areas, socio-economic-related health inequality in self-reported NCDs was largely explained by household wealth (36.8%), which implies that the overall inequality was increased due to lower wealth among the poor, followed by a negative relative contribution of living arrangement (−15%). The relative contribution of region and social health insurance to the overall inequality in self-reported NCDs was similar (10.7 and 10.6%, respectively). This fact is due to combination of two reasons: (a) the large elasticity of self-reported NCDs with respect to these variables as shown in Table 4 and (b) the unequal distributions of these variables across household wealth range. Interestingly, the order of the major contributors to the overall inequality in self-reported NCDs was reversed for urban areas relative to rural ones. In particular, the main drivers of socio-economic-related health inequality in self-reported NCDs for urban areas were social health insurance (16.6%), followed by region (14.6%), living arrangement (−8.9%) and household wealth (8.3%).
Table 4. Decomposition analysis of socio-economic-related health inequality in self-reported non-communicable diseases among Vietnamese older people, by place of residence

Notes: CIk: concentration index of k covariate. Ref.: reference category.
Probability of reporting at least one NCD among disadvantaged groups
Policy makers and public policy often target groups of disadvantaged individuals for mitigating health inequality because disadvantaged individuals often have poorer socio-economic status and lower access to health-care services than their reference counterparts. The results of marginal effects and decomposition analyses indicate that living arrangement, household wealth and social health insurance were the main determinants (except living arrangement) and drivers to explanation of socio-economic-related health inequality in NCDs for both rural and urban areas. Interesting questions are whether respondents with disadvantaged characteristics (i.e. individuals living alone, with lowest household wealth and without social health insurance) have a higher likelihood of reporting at least one NCD than those with better characteristics and that whether differences in the probability of reporting at least one NCD among those types of respondents are statistically significant. With that in mind, we examined four types of respondents as follows:
• Group 1: individuals living alone, with lowest household wealth and without social health insurance.
• Group 2: individuals living alone, with lowest household wealth and with social health insurance.
• Group 3: individuals living alone, with highest household wealth and without social health insurance.
• Group 4: individuals living alone, with highest household wealth and with social health insurance.
In this exercise, we did not account for effects of age and gender because those two variables were not the determinants of NCDs and also were not attributable to explain health inequality in NCDs for both rural and urban areas in this study. Here, we are particularly interested in older people living alone, since a majority of the literature have documented well that individuals living alone are more vulnerable to health issues in later life than those co-residing with spouse/partner or children, especially in the event of care being needed. Analysis strategy for such an exercise is that we first re-executed probit models separately for rural and urban areas, controlled for a set of covariates used in this study, then saved the regression estimates. Next, we utilised mtable and mlincom commands, developed by Long and Freese (Reference Long and Freese2014), to compute the probability of reporting at least one NCD for each group (mtable command) and to examine significant difference in the probability of reporting at least one NCD across groups (mlincom command). The motivation of mtable and mlincom commands is originated from margins command in Stata, therefore those two commands can do what margins command does and are equipped with most of the options that margins command provides (Long and Freese, Reference Long and Freese2014).
The exercise's results presented in Table 5 show that, for those with the same characteristics in both areas, the probability of reporting at least one NCD was higher for rural areas than urban ones across the four groups, i.e. the probability of reporting at least one NCD for rural older people living alone, with lowest wealth and with social health insurance was 0.96, while it was 0.85 for those with the same characteristics living in urban areas. Importantly, having social health insurance increased the probability of reporting at least one NCD across the four groups for both rural and urban areas. Table 6 shows that differences in the probability of reporting at least one NCD were statistically significant across group comparisons, except comparison of Groups 1 and 4 for both areas and comparison of Groups 1 and 2 for urban areas only.
Table 5. Probability of reporting at least one non-communicable disease among disadvantaged groups

Note: The 95 per cent confidence intervals are in parentheses.
Significance level: *** p < 0.001.
Table 6. Testing significant differences in the probability of reporting at least one non-communicable disease across disadvantaged groups

Note: The 95 per cent confidence intervals are in parentheses.
Significance levels: * p < 0.05, ** p < 0.01, *** p < 0.001.
Discussion
To the best of our knowledge, this study is the first to identify the determinants of socio-economic-related health inequality in self-reported NCDs, and the first to evaluate the relative contribution of each determinant to the overall health inequality in self-reported NCDs among Vietnamese older people. This study contributes to a growing body of research using the frequently applied concentration index decomposition technique to explain socio-economic-related health inequality in developing countries. The findings of this study add to the existing empirical evidence of socio-economic factors associated with the probability of reporting NCDs among older people in developing settings. The results of this study are important in various aspects. Firstly, we analyse socio-economic-related health inequality in NCDs with a focus on older people who are commonly affected by socio-economic gradients in later life. Secondly, we identify factors associated with NCDs among rural and urban older people. Thirdly, this study utilises the nationally representative VNAS, rather than simply focusing on rural older people, as in previous studies in Viet Nam. Therefore, the estimations of this study are nationally representative for Vietnamese older people as a whole. Finally, the results of concentration index decomposition, which is a preferred technique in health inequality studies, provide informative evidence for policy makers to support their design of effective interventions for mitigating inequalities in health.
This study finds the overall frequency of occurrence of reporting at least one NCD to be higher than that reported in previous studies on Vietnamese older people. This could be explained by the fact that previous studies investigated some common NCDs (such as cancer, hypertension, diabetes, and so on) and examined only rural older people (Hoang et al., Reference Hoang, Dao and Kim2008; Mwangi et al., Reference Mwangi, Kulane and Le2015; Ninh et al., Reference Ninh, Ninh, Khanal and Moorin2015).
The degree and direction of health inequality in NCDs (the sign and value of the overall CIs and EIs) among older people vary across settings. In particular, some studies find the inequality to be more highly concentrated among the rich (Vellakkal et al., Reference Vellakkal, Subramanian, Millett, Basu, Stuckler and Ebrahim2013; Tenkorang and Kuuire, Reference Tenkorang and Kuuire2016; Kunna et al., Reference Kunna, San Sebastian and Stewart Williams2017), whereas several others indicate that the inequality is more prevalent among the poor (Yiengprugsawan et al., Reference Yiengprugsawan, Lim, Carmichael, Sidorenko and Sleigh2007; Kunna et al., Reference Kunna, San Sebastian and Stewart Williams2017; Costa et al., Reference Costa, Flores, Wendt, Neves, Tomasi, Cesar, Bertoldi, Ramires and Nunes2018). The results of this study support the latter finding, i.e. that socio-economic-related health inequality in self-reported NCDs was significantly concentrated among the poor for both rural and urban areas. Moreover, this study also finds that the magnitude of socio-economic-related health inequality in self-reported NCDs was larger for urban areas than for rural ones. This finding could be explained by the fact that the rich (4th and 5th quintiles) in urban areas were less likely to have NCDs than the rich in rural areas, while the prevalence of NCDs among the poor (1st and 2nd quintiles) in rural and urban areas is relatively similar (see e.g. Figure 1). As a result, gaps in NCDs between the rich and the poor in urban areas is larger than that of rural areas. In addition, as compared to urban individuals, rural older people face multiple barriers (such as long commute to health care centers, low income, and poor health care facilities) to accessing health, health-care services and quality of health care (Giang and Phi, Reference Giang and Phi2016; Giang et al., Reference Giang, Pham and Pham2016). This may explain why rich individuals in urban areas have better health than their rural counterparts. Notably, standardising for effects of age–sex and other covariates used in this study increased the magnitude of the inequality among rural older people, whereas the opposite was observed for their urban counterparts. The results also show that the values of EIs (CIs) for age–sex standardisation were not much different than those for age–sex standardisation and other covariates for both rural and urban areas, which implies that there is little heterogeneity in age–sex effects (O'Donnell et al., Reference O'Donnell, van Doorslaer, Wagstaff and Lindelow2008).
Demographic characteristics (e.g. age, gender and region) have been identified as strong predictors of NCDs (Yiengprugsawan et al., Reference Yiengprugsawan, Lim, Carmichael, Sidorenko and Sleigh2007; Hoang et al., Reference Hoang, Dao and Kim2008; Mwangi et al., Reference Mwangi, Kulane and Le2015), and socio-economic status (as measured by employment status and household wealth index) has been well documented as a significant determinant of NCDs and health status among older people across settings (Yiengprugsawan et al., Reference Yiengprugsawan, Lim, Carmichael, Sidorenko and Sleigh2007; Kunna et al., Reference Kunna, San Sebastian and Stewart Williams2017; Le et al., Reference Le, Nekehia and Vipan2019). Our results are consistent with those findings. Health insurance is commonly used as a predictor of health outcomes and health service utilisation among older people (Basu and King, Reference Basu and King2013; Yang et al., Reference Yang, Huang, Zhou, Wang, Tong, Wang, Wang and Lu2014; Guevara and Andrade, Reference Guevara and Andrade2015; Hoang et al., Reference Hoang, Oh, Kim, Nguyen, Nguyen, Tran, Nguyen, Dinh, Lee and Luu2018). Our results for both rural and urban areas indicate that older people with social health insurance have a significantly higher probability of reporting at least one NCD than do those without social health insurance. This finding contrasts with that of a relevant study in Ecuador, which finds no association between health insurance and NCDs (Guevara and Andrade, Reference Guevara and Andrade2015). A possible explanation for that finding might be the ‘reverse selection’ phenomenon, which means that the sick are more likely to buy health insurance than are the healthy (VNMoH and HPG, 2018).
In terms of the probability of reporting at least one NCD among disadvantaged groups, older people living alone, with lowest wealth and with social health insurance had highest probability of reporting at least one NCD for both rural and urban areas, followed by those living alone, with lowest wealth and without social health insurance. This finding marks a significant contribution of social health insurance to increasing the probability of reporting at least one NCD for both disadvantaged and non-disadvantaged groups. We argue that, together with findings from the marginal effects and cross-tabulation frequency checks (not shown here), individuals with social health insurance were more likely to report at least one NCD because they may do health check-ups more often than those without social health insurance, especially in the context of Viet Nam, where health examination is not a common practice. Consequently, individuals with social health insurance may be more aware of their true health conditions (due to results of regular health examinations) and then may report their health conditions more accurately than those without social health insurance. Future studies are encouraged to examine the depth of the association between NCDs and social health insurance.
The decomposition results identified four main drivers of socio-economic-related health inequality in self-reported NCDs for rural and urban Vietnamese older people, namely (a) household wealth, (b) living arrangement, (c) region and (d) social health insurance. Household wealth appeared to be the largest contributor to inequality for rural areas, but the smallest one for urban areas. This finding is in line with evidence of relevant studies in Thailand, China and Ghana, which indicate that wealth makes a relatively large contribution to socio-economic-related health inequality in NCDs (Yiengprugsawan et al., Reference Yiengprugsawan, Lim, Carmichael, Sidorenko and Sleigh2007; Kunna et al., Reference Kunna, San Sebastian and Stewart Williams2017). A number of cross-sectional studies on older people in Viet Nam also find that less economically affluent individuals have a significantly higher probability of reporting NCDs than affluent people (Hoang et al., Reference Hoang, Dao and Kim2008; Mwangi et al., Reference Mwangi, Kulane and Le2015). Such findings could be explained by the fact that affluent individuals might have relatively better access to adequate health-care services/information, and have greater financial resources for covering health-care costs, than poor individuals.
Health insurance plays an important role in health-care coverage and health-care financing, in that it increases the rate of health-care access and reduces health finance burdens on government and individuals, especially among older people who bear higher medical treatment costs than younger individuals (Kelly et al., Reference Kelly, Giang and Pham2018). The government of Viet Nam has taken significant actions to improve social health insurance coverage nationwide, as seen in a number of social health insurance-related decrees (such as Decree 299/1992, Decree 58/1998 and Decree 63/2005) and the 2008 Law on Health Insurance and its 2014 amendment, as well as Decree 146/2018. Recently, the notion of universal health insurance has been widely advocated by VNMoH and other stakeholders, with targets including 75 per cent enrolment by 2015 and 85 per cent by 2020, and reduction of the out-of-pocket share of total expenditure to less than 35 per cent by 2020. However, fragmentation of social health insurance implementation has been found in the context of vulnerable groups, such as older people. In particular, estimations from the 2016 Vietnam Household Living Standard Survey indicate that about 17 per cent of older people did not have social health insurance cards, though the share for urban and non-poor groups was higher than that for their rural and poor counterparts (Giang and Phi, Reference Giang and Phi2016). Giang and Phi (Reference Giang and Phi2016) show that out-of-pocket expenditure, though decreasing over time, was still disproportionally high among poorer, rural and ethnic minority groups of older people. The unequal distribution of access to social health insurance across socio-economic groups of Vietnamese older people, as discussed above, could be one reason for the increased socio-economic-related health inequality in self-reported NCDs found in this study.
In this study, although the partial effects of living arrangement did not establish statistical significance, that variable made a relatively large contribution to decreased health inequality in self-reported NCDs. It should be noted that the CI estimations were computed based on the CCs, since the CI is defined as twice the area between the CC and the line of equality. As a result, the unstandardised CI estimations are not affected by the coefficients in the probit models. It has been suggested that living arrangement is an important factor of older people's health because having a spouse or living with adult children mark significant advantages for older people, as compared to those living alone, especially in the event of illness when care-giving is needed (Knodel and Nguyen, Reference Knodel and Nguyen2015). Traditionally, adult children are the main sources of financial and care support for Vietnamese older people (VNMoH & HPG, 2018). However, rapid urbanisation and economic development have swiftly changed this traditional practice, since a large number of young adults are moving from rural to urban areas to seek better jobs and lives. This rural-to-urban migration has caused losses of both financial and care resources among rural older people. Such migration even places considerable economic and familial burdens on rural older people, especially those living alone or in ‘skipped-generation’ families. Therefore, the rural-to-urban migration among young adults could be a plausible explanation for the larger contribution of the region to socio-economic-related health inequality in self-reported NCDs for rural areas than for urban ones.
Socio-economic-related health inequality in self-reported NCDs could also be explained by variations in region, which increase inequality due to a higher proportion of self-reported NCDs amongst the less-affluent individuals. Insufficient or inappropriate health-care infrastructures specialising in older people's health issues could partly explain variations in self-reported NCDs across sub-regions in Viet Nam. Although the government of Viet Nam and VNMoH have made considerable efforts to place geriatric departments in provincial general hospitals nationwide, such departments are still unavailable in some provinces (VNMoH and HPG, 2018). In several other provinces, geriatric departments appear in combination with other departments, without proper guidelines on geriatric departments’ implementations from the VNMoH. As a result, the structure of geriatric departments is inconsistent across sub-regions, causing ineffective operation (VNMoH and HPG, 2018). Another possible explanation could be variations in economic development across sub-regions in Viet Nam. In particular, the Northern Midland and Mountainous Areas, and the Central Highlands are far less economically developed than others because they have a majority of economically disadvantaged ethnic minority groups. On the other hand, the Red and the Mekong River Deltas are the most economically developed sub-regions, as most key economic zones of Viet Nam are located there (World Bank and Ministry of Planning and Investment of Vietnam, 2016).
Conclusions
Significant socio-economic-related health inequality in self-reported NCDs was found among Vietnamese older people; this indicates that health inequality in self-reported NCDs was more highly concentrated among the less economically affluent individuals in both rural and urban areas. Moreover, it was found that the magnitude of health inequality in self-reported NCDs was larger for urban areas than for their rural counterparts. Therefore, it is advisable for the Government of Viet Nam to make more effort to design appropriate policies to mitigate inequalities in health and wealth. Such policies should focus on the most socio-economically disadvantaged groups, especially in rural areas where the majority of older people reside and experience lower socio-economic status than do those in urban areas (e.g. lower levels of education and wealth) and encounter multiple barriers to support for health-care issues. Also, our findings point to important contributions of household wealth and social health insurance to explain socio-economic-related health inequality in self-reported NCDs in urban and rural areas, respectively. The unequal distribution of these two variables across socio-economic groups increased the inequality that disfavoured the poor in both rural and urban areas. Therefore, public policies aimed at narrowing the wealth gap and expanding and improving principle roles of social health insurance should prioritise the most disadvantaged groups in the work to achieve health equality. Furthermore, social health insurance expansion and health-care promotion activities for older people (i.e. encourage older people to do health examinations frequently) are increasingly needed so that latent diseases can be detected at an early stage.
We would like to note some limitations of this study. First, we did not attempt to examine causality; rather, this study examined the association between self-reported NCDs and their determinants, and evaluated the relative contribution of each determinant to overall socio-economic-related health inequality in self-reported NCDs among Vietnamese older people. Longitudinal data are essential if we are to infer causality. We acknowledge the possibility of reporting bias because the self-reported NCDs examined in this study might underestimate disease prevalence. Future research is encourage to include both subjective and objective measures of NCDs so that estimations are validated and grounded. Prevalence of NCDs could be influenced by risky health behaviours such as smoking, alcohol consumption, lack of physical exercise, and low vegetable and fruit intake, but this study did not control for such factors. Future studies combining qualitative and quantitative research methods are encouraged as a means of achieving a better understanding of the association between NCDs and their determinants.
Supplementary material
The supplementary material for this article can be found at https://doi.org/10.1017/S0144686X19001843.


