INTRODUCTION
Climate change is increasingly affecting a range of marine ecosystems through loss of habitat and the movement of species to areas newly within their thermal tolerance range (Cheung et al., Reference Cheung, Lam, Sarmiento, Kearney, Watson, Zeller and Pauly2010), with those at the poles and the equator being disproportionally affected due to the truncation and expansion of thermal limits (MacNeil et al., Reference MacNeil, Graham, Cinner, Dulvy, Loring, Jennings, Polunin, Fisk and McClanahan2010). In the Arctic Ocean, climate effects are predicted to generate ice free summers within the next century, severely limiting the growth of ice algal mats, an important source of primary production and essential omega-3 (n-3) long-chain polyunsaturated fatty acids (LC-PUFA) that may be surpassed by increased open-water production within decades (Overpeck et al., Reference Overpeck, Strum, Francis, Perovich, Serreze, Benner, Carmack, Chapin, Gerlach, Hamilton, Hinzman, Holland, Huntington, Key, Lloyd, MacDonald, McFadden, Noone, Prowse, Schlosser and Vörösmarty2005). Such major changes in ecosystem function and the consequent availability of prey will disrupt the Arctic food web to an unknown degree, with potentially important consequences for upper trophic level species responding to a changing prey base. Understanding the consequences of large-scale disturbances such as ocean warming in Arctic marine food webs requires quantitative approaches that can track contemporary changes in predator diets through time, using accurate, well-defined methods.
Empirical tools that accurately characterize long-term dietary trends should include the ability to quantify changes in trophic level if they are to help test predicted effects of a shifting prey base. Stomach contents have traditionally been used to analyse marine predator diets, however these methods are biased towards species containing durable hard parts that are less likely to degrade during digestion than those comprised mainly of soft tissue (Hyslop, Reference Hyslop1980), generating bias toward recent meals (Lea et al., Reference Lea, Cherel, Guinet and Nichols2002). In addition, some consumers are only available for sampling at specific times of year, restricting the window of opportunity for gut content sampling. These problems have been widely recognized and, as a result, there has been considerable interest in bulk stable carbon and nitrogen isotopes for characterizing short- and long-term trophic relationships (Gannes et al., Reference Gannes, O'Brien and del Rio1997). Stable carbon isotopes give information about the primary production source while stable nitrogen isotopes inform about the trophic level. Although bulk isotopes provide valuable trophic information, they are not typically useful for estimating consumer diets (Hobson, Reference Hobson1993). However, fatty acids (FA), which are fundamental components of lipids that get absorbed into the fat stores, or adipose tissues, from consumed prey with little modification, have been successfully used to estimate the relative composition of marine predator diets (Iverson et al., Reference Iverson, Field, Bowen and Blanchard2004).
If fatty acids of large conspicuous Arctic consumers are able to differentiate spatial and temporal change, then they may provide reliable information in the context of environmental change, such as ocean warming. Despite this potential, strict assumptions on standard multivariate techniques make analysing FA data difficult in practice. Specifically, modern analysis can produce data for over 60 individual FA and ensuring log-normality of this number of FA is a challenge. Further, a fatty acid profile, defined as a vector containing the proportion of each fatty acid present in an individual, is compositional in nature (i.e. it sums to 1) and has a dimension that is often larger than the sample size, violating multiple statistical assumptions that can lead to spurious or false correlations (Aitchison, Reference Aitchison1986).
Previously, Quantitative Fatty Acid Signature Analysis (QFASA) has been used to quantify diets of Arctic predators such as seals (Iverson et al., Reference Iverson, Field, Bowen and Blanchard2004), polar bears (Thiemann et al., Reference Thiemann, Iverson, Stirling and Obbard2011) and seabirds (Iverson et al., Reference Iverson, Springer and Kitaysky2007). However, the application of QFASA requires a prey database that is costly and time-consuming to produce and frequently unavailable for a given predator of interest. Yet where only predator FA profiles are available, a significant difference in FA signatures among predators can provide a strong indication of diet differences (Stewart et al., Reference Stewart, Iverson and Field2014). Identifying such differences requires a statistical technique that can cope with the restrictions of compositional data, low sample sizes and numerous zeros present in fatty acid data. One such approach is permutational multivariate analysis of variance (MANOVA, formerly non-parametric MANOVA; McArdle & Anderson, Reference McArdle and Anderson2001), which has been used previously to understand the effects of gastropod grazing on intertidal estuarine assemblages (Anderson, Reference Anderson2001). In permutational MANOVA, a pseudo-F statistic is calculated using distances between vectors for the sum of squares components instead of the data itself permitting the use of any distance measure desired. For example, Aitchison or χ2 distances between vectors of FA among individuals can be used, allowing for low sample sizes relative to FA dimension. Because a non-Euclidean method is used, assumptions of log-normality are not required and therefore many kinds of ecological data sets can be readily analysed using, for example, a χ2 distance measure that is capable of handling zeros. Given these properties, this MANOVA approach should prove useful for quantifying change in predator diets using FA among a variety of marine and freshwater organisms.
Here, we test for seasonal and inter-annual differences in FA profiles among a key apex predator in the Arctic Ocean, the Greenland shark (Somniosus microcephalus), between two spatially isolated populations near Svalbard, Norway and Cumberland Sound, Canada. Portions of the FA data compiled for the present study have been included in previous published studies focused on the diet of Svalbard Greenland sharks (McMeans et al., Reference McMeans, Arts, Lydersen, Kovacs, Hop, Falk-Petersen and Fisk2013), FA differences among multiple shark tissues and prey (McMeans et al., Reference McMeans, Arts and Fisk2012), and the structure of (McMeans et al., Reference McMeans, Arts, Lydersen, Kovacs, Hop, Falk-Petersen and Fisk2013) and mercury biomagnification in the Cumberland Sound food web (McMeans et al., Reference McMeans, Arts and Fisk2015). Evidence was found for dietary differences in Greenland sharks between these locations; specifically, that Svalbard sharks consumed relatively less Greenland halibut, based on lower C20 and C22 monounsaturated FA compared with Cumberland Sound sharks (McMeans et al., Reference McMeans, Arts, Lydersen, Kovacs, Hop, Falk-Petersen and Fisk2013). However, only a small set of presumably dietary-derived FA (i.e. the 9 FA that constituted >1% of shark FA and that explained the greatest difference among prey FA) were compared between locations. Further, data from only a single season were available for each location. Here, we analyse a larger data set that includes a greater number of FA (i.e. 37 FA) and samples from additional seasons and years in each location to further explore FA variation in Greenland sharks over time and space.
MATERIALS AND METHODS
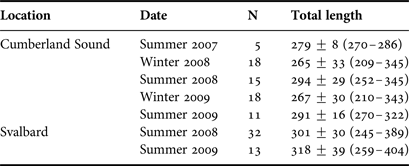
Greenland sharks were sampled over two years using bottom long-lines in (1) Kongsfjorden, Svalbard, Norway during June 2008 and 2009 as previously described (Leclerc et al., Reference Leclerc, Lydersen, Haug and Bachmann2012), and (2) Cumberland Sound, Canada during August 2007–2009 and April 2008 and 2009 (see Table 1 for sample size in each location and season). Cumberland Sound Greenland sharks were sampled identically as per previously described for the April 2008 samples (McMeans et al., Reference McMeans, Arts and Fisk2012). Greenland sharks were captured alive and sacrificed immediately before sampling using methods described in Leclerc et al. (Reference Leclerc, Lydersen, Haug and Bachmann2012). Maximum sampling depths were ~300 m in Kongsfjorden (the approximate maximum depth of this area) and ~400 m in Cumberland Sound (although portions of Cumberland Sound have depths extending beyond 1000 m). In all cases for both locations, dorsal white muscle (~5 g, posterior to the first dorsal fin) was sampled from each Greenland shark, placed into a cryovial and frozen at −80°C for subsequent FA analysis. June (Svalbard) and August (Cumberland Sound) samples can be considered as summer samples because waters are generally free of ice during these months. April samples in Cumberland Sound are considered winter samples because they were collected in waters that were still fully ice covered (i.e. before ice break up had begun).
Table 1. Sample size (N), mean ± SD total length (cm) and size range (in parentheses) of Greenland sharks from each location and season sampled.
Fatty acids were analysed as previously described by McMeans et al. (Reference McMeans, Arts and Fisk2012). In short, 2:1 chloroform: methanol was used for lipid extraction of homogenized muscle samples. A 1:100 sulphuric-methanol solution was used for the generation of fatty acid methyl esters (FAME). FAME were then analysed on a Hewlett Packard 6890 GC and separated on a Supelco SP-2560 column. Known standards (Supelco 37-FAME mix) were used for FA identification and quantification (using calibration curves). All FA are reported on a proportional basis (expressed as a per cent), relative to the sum total of all measured FA.
The permutational MANOVA techniques used are based on an appropriate measure of distances between profiles in order to obtain values that mimic standard sums of squares, allowing for compositional data and large numbers of variables relative to sample size. The details and code (written in R; R Core Team, 2015) to perform these analyses are included as supplemental information (Appendix S1).
As these techniques yield pseudo-F statistics, P-values can be calculated using permutations that yield P-values with significance <0.05. Due to the differing sample sizes (see Table 1), we conducted 1000 permutations to compute a three-way unbalanced permutational MANOVA on the FA signatures of Greenland shark to assess the existence of seasonal, inter-annual and spatial effects which are calculated by testing for each effect after the other two are fitted (partial F-test). Although there are only summer samplings for Svalbard Greenland sharks, the permutational MANOVA technique treats the absence of winter samples as missing values, so that interpretation can still be inferred on the seasonal changes as a whole.
In order to understand the drivers of potential variability between years and locations, relative differences between mean FA were examined. We decided, based on the simplicity of interpretation, that relative difference was the most appropriate measure here but we needed a method to handle zeros. Therefore, zeros were set to half of the analytical precision (0.05%) in order to eliminate undetermined and infinite values in the relative differences. As we were interested primarily in the diets of Greenland shark, we first used a subset of FA which can only originate from the diet (dietary FA, N = 20) and compared those results with a larger subset of FA that also included fatty acids which originate from both diet and biosynthesis (extended dietary FA; N = 37; Table 2). Box plots of relative differences of the FA from both subsets were explored to highlight potential outlying FA contributing to the significant differences between years. The distributions of these FA were examined for shifts and large variations to identify key FA driving the differences. Other measures such as standardized differences using pooled standard deviations, Aitchison's, and χ2 distances between mean FA profiles were used to explore any significant effects identified.
Table 2. Dietary and extended dietary fatty acids used in the analysis of Greenland shark FA signatures.
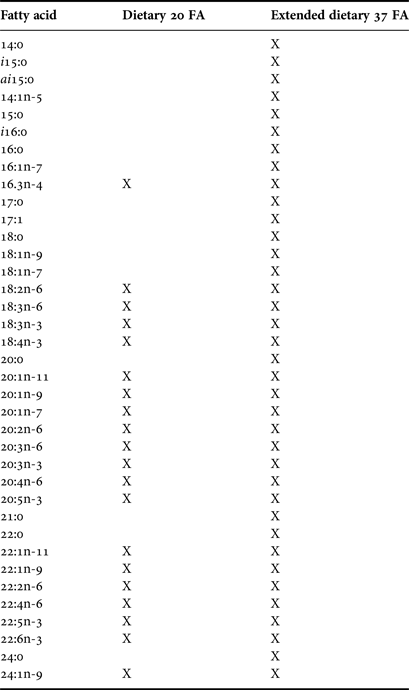
“X” indicates the fatty acid is present in the specified list.
RESULTS
A three-way permutational MANOVA was performed to test for seasonal, spatial and inter-annual effects on FA profiles among Greenland sharks. Using both dietary (20 FA) and extended-dietary (37 FA) subsets of FA, all three effects yielded a P-value less than our specified value of 0.05 and, therefore, were found to be significant with pseudo F-statistics of 6.968, 9.152 and 13.532 for location, seasonal and inter-annual effects respectively for the extended-dietary subset, and 9.267, 17.121 and 20.304 for the dietary subset. The pseudo-F statistics reveal that inter-annual effects were the largest observed, in close agreement with the Aitchison's distances and χ2 distances between yearly and location mean FA signatures (Table 3; Stewart et al., Reference Stewart, Iverson and Field2014). Distances between years tended to be larger than distances between locations, supporting the largest inter-annual effects found by MANOVA.
Table 3. Aitchison distances and χ2 distances as recommended in Stewart et al. (Reference Stewart, Iverson and Field2014) between means of untransformed fatty acid profiles of Greenland sharks in Cumberland Sound (CS) and Svalbard (Sv) between summer 2007 (S07), summer 2008 (S08), summer 2009 (S09), winter 2008 (W08) and winter 2009 (W09).
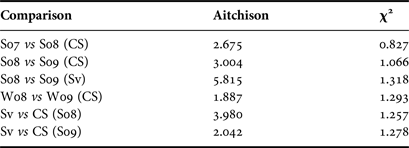
A large Aitchison and χ2 distance means the difference between FA profiles is strong.
Inter-annual influence
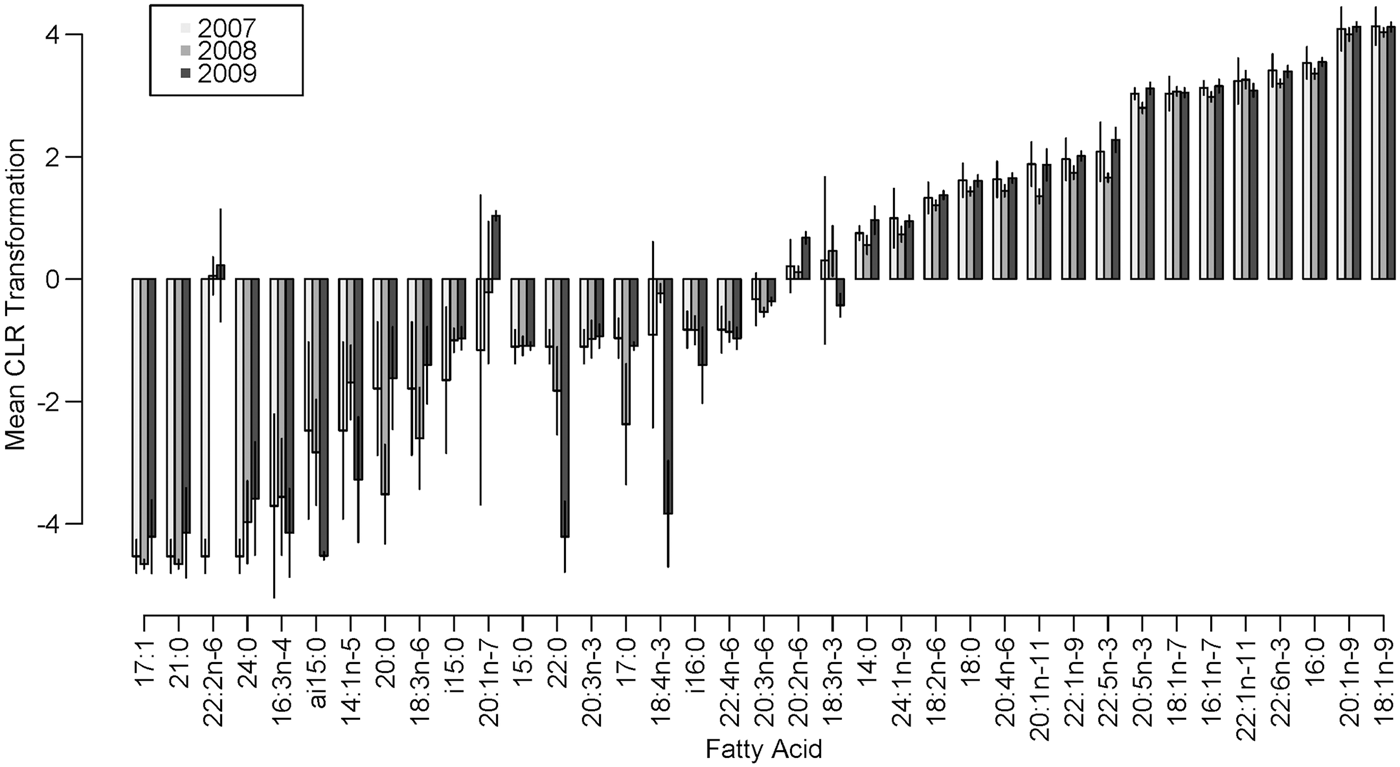
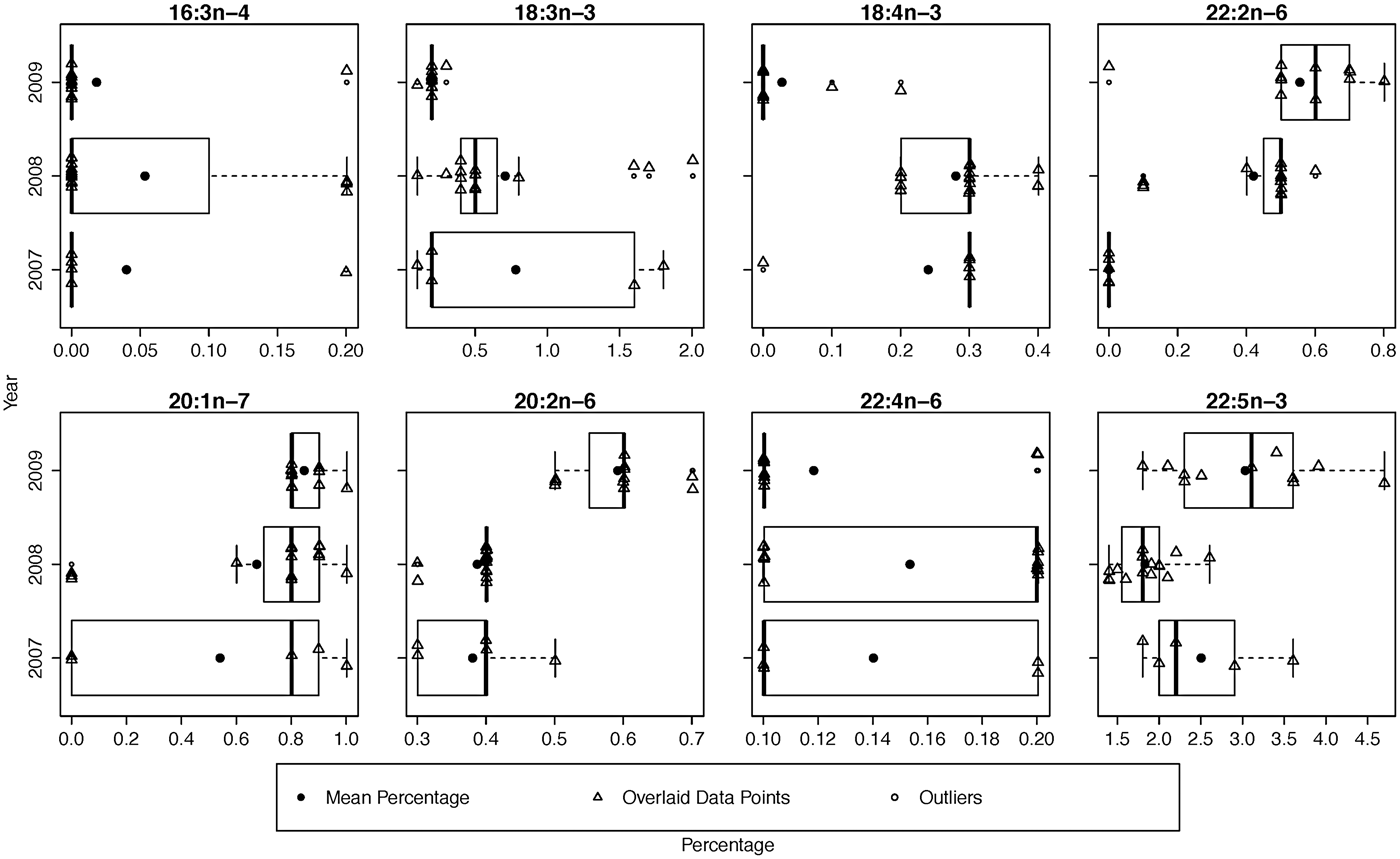
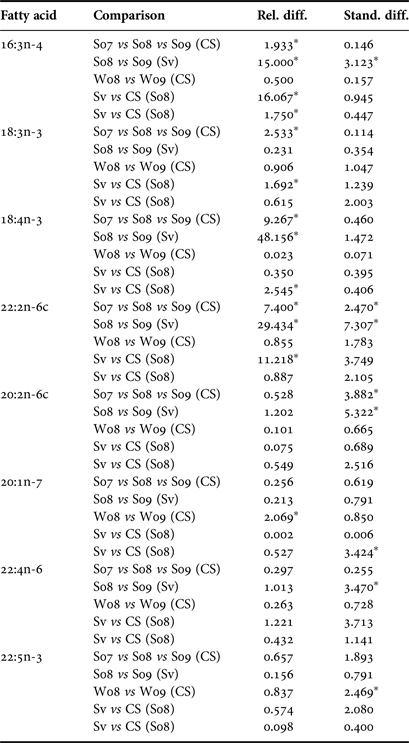
While the MANOVA approach compares all FA at once and tests for yearly effects after fitting location and season, small P-values indicate inter-annual differences over the entire set of FA. It does not, however, specify which FA display the most pronounced differences. To determine which FA could be driving these effects, we examined boxplots of relative and standardized differences and searched for outlying FA. This exploration of FA between years revealed that the distances among sampling occasions tended to be larger between years than between locations (Table 4). This was expected based on the MANOVA results and can be seen clearly in both relative and standardized differences for 18:4n-3, 22:2n-6 and 20:2n-6. Upon examining these relative and standardized differences further, five FA appeared to contribute largely to the MANOVA results based on different comparisons between years: 16:3n-4, 18:3n-3, 18:4n-3, 22:2n-6 and 20:1n-7. These outlying relative differences between yearly means in season/location combinations indicates that the means are vastly different from year to year, with the FA in 2007 and 2009 being most similar and 2008 significantly different from the other years (Figure 1). The distributions of eight outlying FA (in summer, Cumberland Sound; Figure 2) showed shifting distributions annually, further emphasizing that these FA are the main contributors to inter-annual variability. Some of these FA show large variances for both types of distance measures, and therefore, 22:2n-6 seems to be the main contributor to the large yearly effect, followed by 18:3n-3, 18:4n-3 and 20:2n-6.

Fig. 1. Mean centred log-ratio transformation of FA present in Greenland shark muscle tissue in summer in Cumberland Sound, Canada, from 2007–2009, with bars representing ± 2 standard deviations on the transformed scale.

Fig. 2. Yearly box plots of the eight outlying fatty acids that contribute largely to the inter-annual variability with means and data overlaid. These fatty acids are from Cumberland Sound sharks in summer from 2007–2009.
Table 4. Distances of outlying FA of Greenland sharks in Cumberland Sound (CS) and Svalbard (SV) for summer 2007 (S07), summer 2008 (S08), summer 2009 (S09), winter 2008 (W08) and winter 2009 (W09).

These measures are based on relative or standardized distances between the comparisons specified. An asterix (*) indicates that these distances were outliers.
Location influence
The presence of location effects in FA profiles suggested important differences in shark diets between locations. Using methods employed for inter-annual effects to extract outlying FA, three FA were discovered that have outlying relative differences between locations in summer 2008 (16:3n-4, 18:3n-3, 22:2n-6), and two more in summer 2009 (16:3n-4, 18:4n-3). This indicates that these dietary FA, 16:3n-4, 18:4n-3, 18:3n-3 and 22:2n-6, were those most likely driving the observed differences between locations. When standardized differences were explored for comparisons between locations, there were no outlying FA. The mean percentages of outlying FA in summer 2008 or summer 2009 showed that there were large differences not only in common FA (such as 22:2n-6 and 18:3n-3), but also among less common ones (16:3n-4).
DISCUSSION
Climate warming in Arctic ecosystems increases the likelihood of major food-web restructuring over the coming decades (MacNeil et al., Reference MacNeil, Graham, Cinner, Dulvy, Loring, Jennings, Polunin, Fisk and McClanahan2010; Søreide et al., Reference Søreide, Leu, Berge, Graeve and Falk-Petersen2010) that may particularly affect top predators, such as Greenland shark (McMeans et al., Reference McMeans, Arts, Lydersen, Kovacs, Hop, Falk-Petersen and Fisk2013). Strong inter-annual variability in diet composition detected in our study, however, may indicate that Greenland shark can adapt to a changing prey base. Despite these differences being driven by minor FA, they reveal significant differences in their diet among locations and through time that support previous evidence of their being a generalist predator (McMeans et al., Reference McMeans, Svavarsson, Dennard and Fisk2010; MacNeil et al., Reference MacNeil, McMeans, Hussey, Vecsei, Svavarsson, Kovacs, Lydersen, Treble, Skomal, Ramsey and Fisk2012). However there remain substantive spatial differences in Greenland shark feeding habits that may generate locally different responses across the Arctic. Importantly, our statistical approach provides a method to robustly analyse and monitor for shifts in predator FA profiles through space and time.
Previous literature was used to determine if the FA contributing to changes between years are indicative of certain prey or conditions in the environment. The application of FA as dietary tracers in sharks and other elasmobranchs is still an emerging technique and few experimental studies have been performed that explicitly link dietary with resultant predator FA. Generally speaking, however, the FA profile of predators is considered sensitive to dietary changes (Budge et al., Reference Budge, Iverson and Koopman2006) such that, where movement is known or restricted to a given area, changing FA profiles among predators should reflect a changing prey base (Pethybridge et al., Reference Pethybridge, Daley, Virtue and Nichols2010, Reference Pethybridge, Daley and Nichols2011). While many individual FA appear to influence spatial and inter-annual differences many of them contribute only marginally (i.e. they are found in very low amounts) to the total pool of Greenland shark FA or are of unknown origin with respect to individual prey sources in arctic ecosystems. Specifically 18:3n-3 was shown to be proportionally higher in Greenland halibut than other main prey in Cumberland Sound, while 22:5n-3 tends to be high in seal blubber (McMeans et al., Reference McMeans, Arts, Lydersen, Kovacs, Hop, Falk-Petersen and Fisk2013). As two of the six major drivers of inter-annual variation in FA profiles, this strongly suggests that shifting contributions of Greenland halibut and seal blubber are driving the inter-annual changes in Greenland shark diet. The proportional contributions of these FA in each year suggest that 2007 was a high-Greenland halibut year, while 2009 had a higher marine mammal contribution. However, as a top predator, the cause of the Greenland shark's spatial movement or changing FA signatures could be linked to the movement or changing FA of their prey, and not due to changes in the predator itself. For this reason, careful tracking of prey species and their FA profiles is needed to ensure changes in the predators are not misinterpreted.
The environmental conditions known to affect the distribution of seal and Greenland halibut populations in the Arctic include the North Atlantic Oscillation (NAO; Dennard et al., Reference Dennard, MacNeil, Treble, Campana and Fisk2010), ambient bottom temperatures (Kihara & Shimada, Reference Kihara and Shimada1988), and extent of annual sea ice (Wyllie-Echeverria & Wooster, Reference Wyllie-Echeverria and Wooster1998). Conditions in 2006–07 included a weaker NAO (http://www.cpc.ncep.noaa.gov/products/precip/CWlink/pna/nao_index.html), and reduced sea-ice extent (http://nsidc.org/arcticseaicenews/), that have been positively associated with increased Greenland halibut (Wyllie-Echeverria & Wooster, Reference Wyllie-Echeverria and Wooster1998; Devine et al., Reference Devine, Zuur, Ieno, Smith, Zuur, Ieno and Smith2007). Conversely, conditions in 2008–09 coincided with a moderately positive NAO and a relative increase in sea ice, both of which are favourable conditions for arctic seals (Friedlaender et al., Reference Friedlaender, Johnston and Halpin2010; Kovacs et al., Reference Kovacs, Moore, Overland and Lydersen2011). Although our results support predicted relationships between environmental observations and Greenland shark prey, a key step in monitoring inter-annual change in Arctic food webs will be to closely monitor changing availability of both Greenland halibut and marine mammals alongside annual changes in shark FA profiles.
Location-specific diets of Greenland shark were reflected primarily in 16:3n-4, 18:4n-3, 18.3n-3 and 22:2n-6, however these FA have not previously been linked to consumption of specific prey by Greenland sharks. Since animals cannot insert the n-3 double bond, the first three FA are considered essential and are largely made by algae (and some aquatic fungi). In aquatic environments, 18:3n-3 is quite common; so much so that, when it is oversupplied it is simply catabolized. However 18:4n-3 appears higher in Svalbard than in Cumberland Sound prey (McMeans et al., Reference McMeans, Arts, Lydersen, Kovacs, Hop, Falk-Petersen and Fisk2013), which may be due to underlying differences in primary producer communities. For example the algae Phaeocystis pouchetii appears to contribute to high levels of 18:4n-3 in zooplankton from Norwegian arctic waters (Kattner et al., Reference Kattner, Hirche and Krause1989).
In the present study, the FA responsible for both spatial and temporal differences made very low contributions to total Greenland shark FA. Specifically, other than 18:3n-3 and 22:5n-3, the FA that were important for spatial and temporal differences contributed <1% to total FA (Figure 2). These FA were not included in the analysis of McMeans et al. (Reference McMeans, Arts, Lydersen, Kovacs, Hop, Falk-Petersen and Fisk2013), which instead focused only on the nine FA that contributed >1% to Greenland shark total FA (with the exception of 18:4n-3 due to its known capacity to differ between locations in the North Atlantic) and that explained the most variation among prey species to meet the assumptions of MANOVA. The permutational MANOVA employed here included a greater number of FA and suggests that uncommon FA are also important for driving spatial and temporal differences in the FA profile of marine predators. It is therefore important and fruitful for future explorations to uncover the potential dietary sources or physiological roles of these as yet poorly understood FA. We suggest that such an effort to develop location-specific FA tracers that are linked to specific resources or physiological conditions could be applied to monitor for shifting spatial prey distributions through changes in the FA profiles of their predators. Our permutational MANOVA provides a robust method for comparing these large suites of FA through space and time.
Understanding the dynamics of predator–prey interactions through time is a difficult, data-intensive and time-consuming process, typically accomplished through regular stratified random governmental surveys. However few annual surveys are conducted in the Arctic, meaning that little long-term baseline information is available with which to understand the food web implications of a warming Arctic. By developing FA tracers now, studies such as ours provide critical linkages that can be monitored through time. Doing so enables early detection of a changing prey base among top predators that should be informative for ecosystem-based management of new, and potentially high-yield Arctic fisheries (MacNeil et al., Reference MacNeil, Graham, Cinner, Dulvy, Loring, Jennings, Polunin, Fisk and McClanahan2010) that are currently closed in both the Canadian and US Arctic due to a lack of baseline information.
Currently it is not clear how FA might be integrated into ecosystem-based management programs. Detailed initial surveys are required to understand intra-annual trends and to tailor sampling to the most informative time periods. However we envision that as specific FA are linked to specific prey and secondary production pathways, the levels of these FA in top predators such as Greenland shark could provide important additional information about the relative abundance of certain fish and mammal stocks in both space and time. We suggest that a non-parametric approach such as that applied here, which is a novel way to analyse FA data, could provide a robust method for monitoring for significant changes in the FA profile of mobile marine predators through space and time. Few metrics such as this have become formally incorporated into traditional fisheries management, however the Arctic environment may be an appropriate ecosystem in which to develop such indicators within the framework of ecosystem-based management.
FINANCIAL SUPPORT
This work was supported by the National Sciences and Engineering Research Council of Canada (Alexander Graham Bell Canada Graduate Scholarship).
SUPPLEMENTARY MATERIAL
The supplementary material for this article can be found at https://doi.org/10.1017/S002531541600148X