


INTRODUCTION
Volumetric-modulated arc therapy (VMAT) is a radiation treatment technique that is capable of delivering a highly conformal dose distribution to a target volume for local tumour control, with minimum radiation dose to surrounding healthy tissues in order to minimise toxicity. It delivers treatments within a relatively shorter period of time and with fewer monitor units compared with the traditional intensity-modulated radiation therapy (IMRT) technique.Reference Shaffer, Morris and Moiseenko 1 – Reference Kjr-Kristoffersen, Ohlhues, Medin and Korreman 7 RapidArcTM (Varian Medical Systems, Palo Alto, CA, USA) is a commercially available method of delivering VMAT treatments, in which the dose distribution is delivered in one or more arcs with continuously variable gantry speed, field shape and dose rate during gantry rotation. There have been several investigations that demonstrate the advantage of the VMAT technique compared with IMRT.Reference Shaffer, Morris and Moiseenko 1 – Reference Kjr-Kristoffersen, Ohlhues, Medin and Korreman 7 However, due to the increased degree of modulation in VMAT delivery, a robust pre-treatment patient-specific quality assurance (QA) procedure is required to make sure that the planned dose distribution for the patient is deliverable by the machine and therefore, the dose delivered to the patient will agree with the planned dose. Several studies have investigated different methods for pre-treatment QA of VMAT treatment plans, including the use of a two-dimensional (2D) ion chamber array, 2D diode array, ArcCHECKTM (Sun Nuclear Corp., Melbourne, FL, USA), MAPCheckTM (Sun Nuclear Corp., Melbourne, FL, USA), Delta4TM (ScandiDos AB, Uppsala, Sweden) and MatriXXTM (IBA Dosimetry GmbH, Schwarzenbruck, Germany).Reference Stojadinovic, Ouyang, Gu, Pompoš, Bao and Solberg 8 – Reference Bailey, Kumaraswamy, Bakhtiari, Malhotra and Podgorsak 12 A lot of interest has been shown in the use of electronic portal imaging devices (EPIDs) for pre-treatment patient-specific treatment plan verification due to its simplicity.Reference Vieillevigne, Molinier, Brun and Ferrand 11 – Reference Greer and Popescu 19 The EPID offers a high-resolution digital image that can be compared with the predicted portal dose image calculated based on the actual fluence distribution for every treatment field.Reference Greer and Popescu 19
There are a number of different methods to compare the measured and predicted dose distribution such as the dose difference (DD), the distance to agreement (DTA) and the gamma (γ) index.Reference Low, Harms, Mutic and Purdy 20 The dose difference method is very sensitive in high dose gradient regions in which a small spatial shift will result in a large DD between the measured and the calculated distributions.Reference Low, Harms, Mutic and Purdy 20 On the other hand, the DTA method is sensitive in low-dose gradient regions. A small dose difference in low-dose gradient regions could result in large DTA values.Reference Bladh-Jonasson 21 A very common method to quantitatively compare a measured and calculated dose distribution that is routinely used for QA of VMAT and IMRT treatment plans is the evaluation of the gamma index.Reference Stojadinovic, Ouyang, Gu, Pompoš, Bao and Solberg 8 – Reference Darko, Kiciak, Badu, Grigorov, Fleck and Osei 22 The gamma index is a dimensionless metric introduced by Low et al.Reference Low, Harms, Mutic and Purdy 20 that incorporates both the DD (∆D) and DTA (∆d) criteria. A γ value≤1 indicates that the measured and the calculated dose point is within the acceptance criteria for DD and DTA (e.g., 3%/3 mm) and is considered as a pass.Reference Low, Harms, Mutic and Purdy 20 The opposite is true for a γ value larger than unity. The goodness of agreement between the measured and calculated dose distributions is measured through the evaluation of the gamma passing rate (%GP) which is the percentage of dose points per beam that satisfy the defined gamma criterion (∆D/∆d).
There are two techniques for normalising the dose difference in the gamma calculation: global and local.Reference Stojadinovic, Ouyang, Gu, Pompoš, Bao and Solberg 8 For the global gamma calculation, the dose difference is normalised to the maximum reference dose. The normalisation in the local method is done with the reference dose at the currently evaluated point.Reference Stojadinovic, Ouyang, Gu, Pompoš, Bao and Solberg 8 There are several parameters that need to be set for gamma evaluation: the dose difference criterion, the distance to agreement criterion, the gamma calculation method (local or global), the choice of a reference (either the measured or calculated dose distribution), and the low-dose threshold or the region of interest (ROI).
In clinical practice a common gamma criterion of 3%/3 mm and a gamma passing rate of 90% have typically been used for both IMRT and VMAT QA.Reference Stasi, Bresciani, Miranti, Maggio, Sapino and Gabriele 23 , Reference Ezzell, Burmeister and Dogan 24 The American Association of Physicists in Medicine Task Group 119 proposed using global gamma criterion of 3%/3 mm with a low-dose threshold of 10% of the maximum dose and a %GP of 90% for per beam analysis and 88–90% for composite irradiations.Reference Ezzell, Burmeister and Dogan 24 However, according to Stasi et al.,Reference Stasi, Bresciani, Miranti, Maggio, Sapino and Gabriele 23 a survey indicated that when institutions use the 3%/3 mm gamma criterion, the gamma passing rate action level most commonly used was 95%. Some studies have raised the question of whether or not such criterion for patient-specific VMAT QA is adequate or a stricter criterion of for example, 2%/2 mm should be used clinically instead.Reference Kim, Park, Kim, Kim, Ye and Park 25 – Reference Steers and Fraass 28 Heilemann et al.Reference Heilemann, Poppe and Laub 26 showed that gamma index criterion of 3%/3 mm to analyze VMAT plans is not sufficient and suggested using a stricter criterion of 2%/2 mm with a passing rates of >90% for both IMRT and VMAT plans. Kim et al.Reference Kim, Park, Kim, Kim, Ye and Park 25 suggested using gamma criterion of 2%/1 mm with passing rates of 90% and 80% for patient-specific VMAT QA for stereotactic body radiation therapy when using MapCHECK2TM and EBT2TM (Ashland Inc., Covington, KY, USA) film, respectively. Therefore, there is variability in the literature concerning the choice of gamma criterion and gamma passing rate for VMAT plans. As mentioned by Steers and Fraass,Reference Steers and Fraass 28 defining appropriate gamma criteria for IMRT or VMAT QA is complicated by the variety of QA measurement devices and their gamma implementation technique, and the complexity of different treatment site. They suggest that the gamma settings and acceptance criteria should be specific to the measurement device, delivery technique and the treatment site.Reference Steers and Fraass 28
Therefore, the aim of this study is to evaluate and report the percentage of dose points with gamma values ≤1.0 (%GP), maximum gamma (γ max), average gamma (γ ave), maximum dose difference (DDmax) and the average dose difference (DDave) for various gamma parameters. The results were based on analyzing 232 portal dose images from 100 prostate cancer patient’s VMAT plans. The absolute gamma analyses were performed using measurements from the Varian EPID on TrueBeam Linacs (Varian Medical Systems). The findings of this study will enable us to establish new guidelines for action levels in QA of prostate VMAT plans.
MATERIALS AND METHODS
We retrospectively re-evaluated 232 EPID dosimetry pre-treatment QA measurements of 100 prostate cancer patients treated at our Center from July 2014 to June 2015. We used the integrated Varian solution (RapidArcTM planning, EPID and Portal dosimetry system) for planning, delivery and QA analysis. All patients’ plans were delivered on Varian TrueBeamTM machines equipped with 120-leaf Varian Millennium multileaf collimator (MLC) and an amorphous silicon (aS1000) panel with the capability of integrated dose acquisition modes. The support arms of the EPID are the portal vision exact arm attached directly to the linear accelerator and can be positioned with high accuracy and reproducibility. The PortalVisionTM aS1000 flat-panel EPID has a 40×30 cm2 detecting surface with a matrix of 1,024×768 pixels (0·392 mm pixel resolution). The mechanical calibration of the exact arms is done by our in-house service personnel and the EPID dosimetry configuration and calibration is done by medical physicists.
Prostate treatment planning
All the patients’ treatment planning was performed using the EclipseTM Treatment Planning System (TPS; Varian Medical Systems). When the CT images had been uploaded onto the treatment planning system, the prostate gland (i.e., the CTV) was contoured by the radiation oncologist. The planning target volume (PTV) was drawn by expanding the CTV by 7 mm on the posterior aspect and 10 mm in all other directions. The organs at risk, which included the rectum (from the level of the inferior ischial tuberosity to the rectosigmoid flexure), bladder and femoral heads, were also contoured. A RapidArcTM plan was generated using 6 MV photon beams and consisted of two arc fields and was either prescribed to a dose of 7,800 cGy in 39 fractions for the treatment of intact prostate or 6,600 cGy in 33 fractions for prostate bed treatment. Some treatments were delivered in two phases. For phase 1, the treatment was delivered to the pelvis area, followed by phase 2 to the prostate or prostate bed. In the two phase treatment plans, the patients were treated with a total prescription of 7,800 cGy, delivered at 4,600 cGy in phase 1 and 3,200 cGy in phase 2. The corresponding two phase doses for the 6,600 cGy prescription are 4,400 cGy and 2,200 cGy for phase 1 and phase 2, respectively. The acceptable minimum and maximum doses to the PTV were 95 and 105%, respectively, of the prescribed dose. Dose constraints employed for the rectum, bladder and femoral heads were consistent with our institutional prostate cancer treatment planning guidelines.
Portal dosimetry QA
Portal dose prediction
The portal dose prediction (PDP) for each treatment beam was calculated by superposing the patients’ treatment beams onto the portal imager’s geometry at 100 cm source-to-imager distance (SID) using the EclipseTM TPS. A separate PDP was calculated for each arc field using the planned gantry angles, collimator rotation, field size, dynamic MLC sequence, dose rate and number of monitor units as the original field used for the patient treatment. The basis of Portal Dosimetry is that, for each treatment field, a predicted image is calculated in the EclipseTM TPS. The TPS calculates the expected fluence from EPID for the plan in terms of absolute pixel values. The ‘verification plan’ is subsequently delivered with an integrated image acquisition mode via the ARIATM system on a TrueBeamTM Linac similar to any clinical plan but delivered in the QA mode.
Portal dose measurements
All the data were acquired at the same SID of 100 cm as used during the absolute calibration of the imager with no additional build up on the imager. Data were acquired with the gantry rotating (arc motion), while the EPID itself was static with reference to the gantry. During the ‘verification plan’ delivery on the Linac, integrated images are acquired with the calibrated EPID. Daily QA is performed on all Linacs to ensure consistency in output, symmetry and flatness. The EPID was calibrated according to the vendor’s specifications, with dark field, flood field (FF) and absolute dose calibration. EPID response was scaled such that 1 Calibrated Unit corresponds to 100 MU delivered by a 10×10 cm2 open field at 100 cm SID. The diagonal profile correction (used to scale the off-axis pixel response after FF flattening) was performed as recommended by Varian. The beam intensity profile was measured at d max in water for a 40×40 cm2 open field. This profile correction and absolute dose calibration is applied upon each integrated image acquisition.
Portal dose analysis
The dedicated ARIATM Portal Dosimetry Review workspace within the EclipseTM TPS was used to evaluate the agreement between predicted and measured images. Dosimetric analysis of PortalVision dose images was performed via Varian EclipseTM TPS including Portal Dosimetry Version 11.0. The gamma index concept in the portal dosimetry system was used for quantifying the results. The assumption is that if there is agreement between the predicted and the measured images, then the treatment plan is dosimetrically deliverable by the treatment machine. The absolute gamma analyses were performed to obtain the %GP, γ max, γ ave, DDmax and the DDave. The local, improved, and combined improved and local (improved+local) gamma calculation options in the Portal Dosimetry system were evaluated. The global gamma calculation algorithm was replaced by improved gamma calculation algorithm in Portal Dosimetry Version 11.0. In the previous algorithm (global), when searching for distance to agreement, the system would only consider integer pixel positions around the pixel being evaluated. According to Varian Portal Dosimetry reference guide 29 ‘this sampling limitation may result in an overestimation of the gamma value at the evaluation point’. Thus the improved option allows the evaluation to interpolate between neighbouring pixels when searching. When both the local and improved options are selected, the dose difference reference value is the local value but allows interpolation when searching for distance to agreement.
We calculated several gamma parameters for each arc field and for different regions of interest (Field, Field+thresholds, multileaf collimator complete irradiation area outline (MLC CIAO)). The regions with doses higher than 5, 10 and 15% of the maximum dose (low-dose threshold) and also the area of MLC CIAO were included to investigate the influence of low doses on the gamma parameters. We also investigated the influence of different gamma criteria: 3%/3 mm, 2%/2 mm and 1%/1 mm on the gamma passing rate.
RESULTS AND DISCUSSION
Gamma passing rate (%GP)
Table 1 shows the means, standard deviations (SD) and ranges of the gamma passing rate for three gamma criteria of 3%/3 mm, 2%/2 mm and 1%/1 mm, for different regions of interest (Field, Field+5, 10, 15% and MLC CIAO), and for three gamma calculation techniques of improved, local and improved+local. Figure 1 represents the histogram of average %GP with 1 SD for various gamma criteria and ROIs for three gamma calculation techniques.
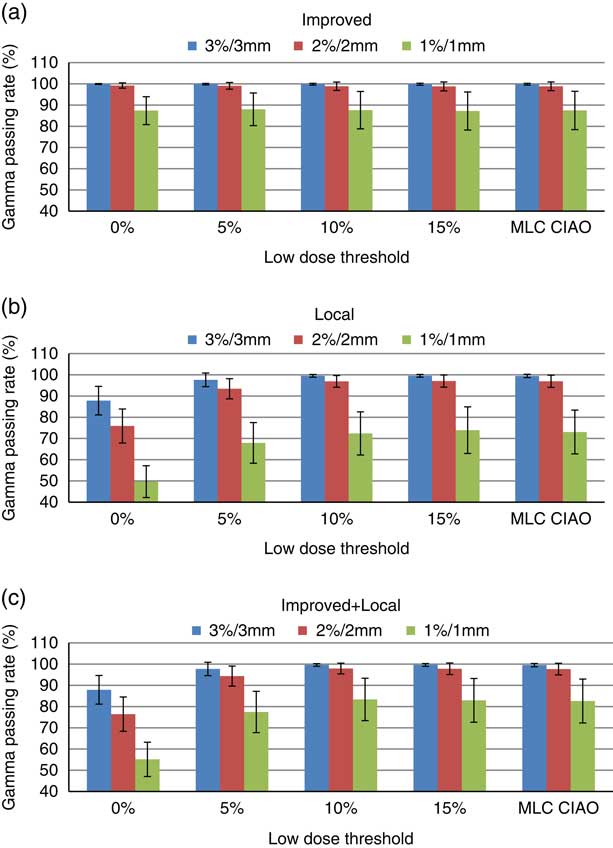
Figure 1 Average gamma passing rate and 1 SD for the 3%/3 mm, 2%/2 mm and 1%/1 mm criteria for (a) improved (b) local and (c) improved+local gamma calculation methods for various regions of interest (ROIs). ROIs with low-dose thresholds of Field+0, Field+5%, Field+10%, Field+15% and MLC CIAO.
Table 1 Average gamma passing rate with 1 SD for improved, local and improved+local gamma calculation techniques with different acceptance criteria and various regions of interest

Note: The minimum and the maximum %GP values are presented in brackets.
Using the improved gamma method (Figure 1a), the mean %GP was above 99·8, 98·8 and 87·2% for the 3%/3 mm, 2%/2 mm and 1%/1 mm criteria, respectively. The average %GPs changed by <0·5% as the low-dose threshold increases from 0 to 15% for all gamma criteria. The %GP does not seem to depend on the low-dose threshold values irrespective of the gamma criteria used. This is because the normalisation of dose difference in improved gamma calculation was with the maximum reference dose which is relatively higher than the dose difference in the low-dose region.Reference Song, Kim and Park 17 The SD values increase by increasing the threshold and tightening the acceptance criteria from 3%/3 mm to 1%/1 mm. The 1%/1 mm criterion shows a higher SD in the %GP compared with the other two criteria. This is because the sensitivity becomes closer to the resolution of the detector.
The values of %GP are lower using the local gamma method (Figure 1b) compared with those obtained by the improved method. However, they go above 95% at thresholds of 5 and 10% for the 3%/3 mm and 2%/2 mm criteria, respectively. As the threshold increases from 0 to 15%, the mean %GP increases by 13, 27 and 47% for the 3%/3 mm, 2%/2 mm and 1%/1 mm criteria, respectively. This is due to the fact that the dose difference is normalised to the currently evaluated pixel for local gamma calculation and therefore, the pixels in low-dose regions usually fail the acceptance criteria.Reference Song, Kim and Park 17 After a threshold of 10%, the %GP does not seem to depend on threshold irrespective of the gamma criteria used. The SD values decrease by increasing the threshold from 0 to 10% for the 3%/3 mm and 2%/2 mm criteria, respectively, while the opposite is observed for the 1%/1 mm criterion.
The mean %GP values obtained using the improved+local method were higher than those using the local method, especially for the 1%/1 mm criterion but the trends of change with the low-dose threshold were similar in both techniques. This could be caused by the interpolation in the calculation algorithm that was mentioned in the previous section. Similarly after a threshold of 10%, the %GP does not seem to depend on threshold irrespective of the gamma criteria used. The mean and SD values of %GP at MLC CIAO were similar to those at 10 and 15% low-dose thresholds for all three criteria and gamma calculation methods.
Maximum gamma (γ max)
Figure 2 represents the average and SD of maximum gamma for various gamma criteria and calculation techniques for different ROIs. For the improved gamma technique (Figure 2a), the means and the SDs of γ max values decreased by about 21 and 25%, respectively, as the threshold increased from 0 to 15% for all criteria. Using the local gamma technique (Figure 2b), the mean γ max values decreased by 47, 48 and 38% with the threshold for the 3%/3 mm, 2%/2 mm and 1%/1 mm criteria, respectively. The SD of γ max decreased by 60, 65 and 18% for the 3%/3 mm, 2%/2 mm and 1%/1 mm criteria, respectively. The smallest mean and SD values for γ max were observed at MLC CIAO for all three criteria and gamma calculation methods. This shows that higher gamma values are located in regions towards the periphery and by tightening the ROI these regions with high gamma values are being ignored and therefore, the maximum gamma values are reduced which is in agreement with the results presented by Howell et al.Reference Howell, Smith and Jarrio 18 The results of maximum gammas are similar for both the improved+local (Figure 2c) and local (Figure 2b) gamma methods. The mean γ max increases at stricter gamma criteria (150–200% increase from 3%/3 mm to 1%/1 mm) for all thresholds and gamma calculation methods.
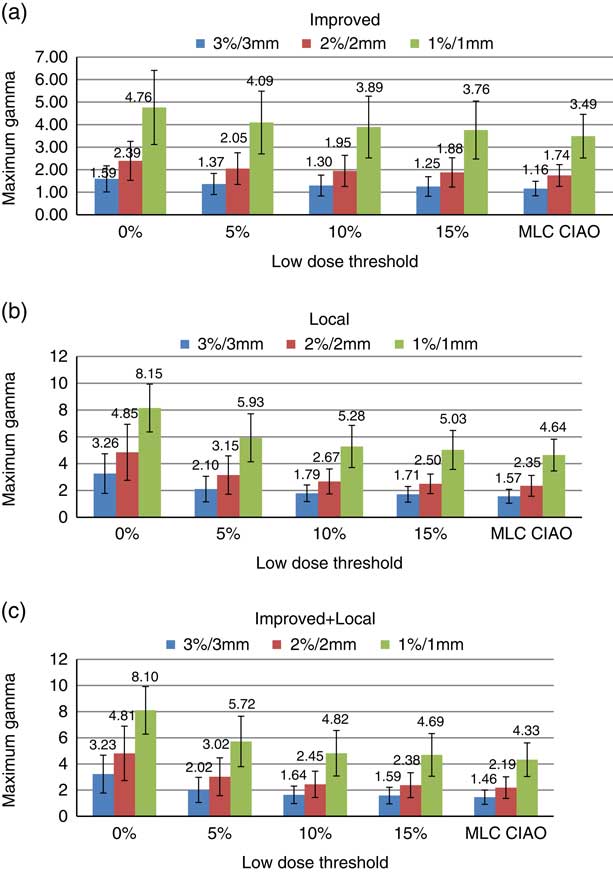
Figure 2 Distribution of average γ max with SD for 3%/3 mm, 2%/2 mm and 1%/1 mm criteria for (a) improved, (b) local and (c) improved+local gamma calculation methods within different regions of interest of Field+0, Field+5%, Field+10%, Field+15% and MLC CIAO.
Average gamma (γ ave)
Figure 3 represents the average and SD of γ ave for three gamma calculation methods and acceptance criteria and five different ROIs. For the improved gamma technique (Figure 3a) and for all criteria, there is no overall change in the mean γ ave with change in the low-dose threshold. The SD of γ ave values decrease by 66, 60 and 50% from a threshold of 0 to 15% for 3%/3 mm, 2%/2 mm and 1%/1 mm criteria, respectively. Using the local gamma technique (Figure 3b), the mean and SD of γ ave were reduced by about 45% with the threshold. However, it does not change with low-dose threshold after 10%. As shown in Figure 3c for the improved+local gamma technique, the mean and SD values of γ ave have been reduced by about 55 and 43%, respectively, with the threshold and a plateau was reached at 10% low-dose threshold for all the criteria. The mean γ ave values are smaller in improved+local method compared with the local method but the trends of change with the low-dose threshold are similar in both techniques. The mean and SD of γ ave at MLC CIAO were very similar to those at 10 and 15% low-dose thresholds for all three criteria and gamma calculation methods.
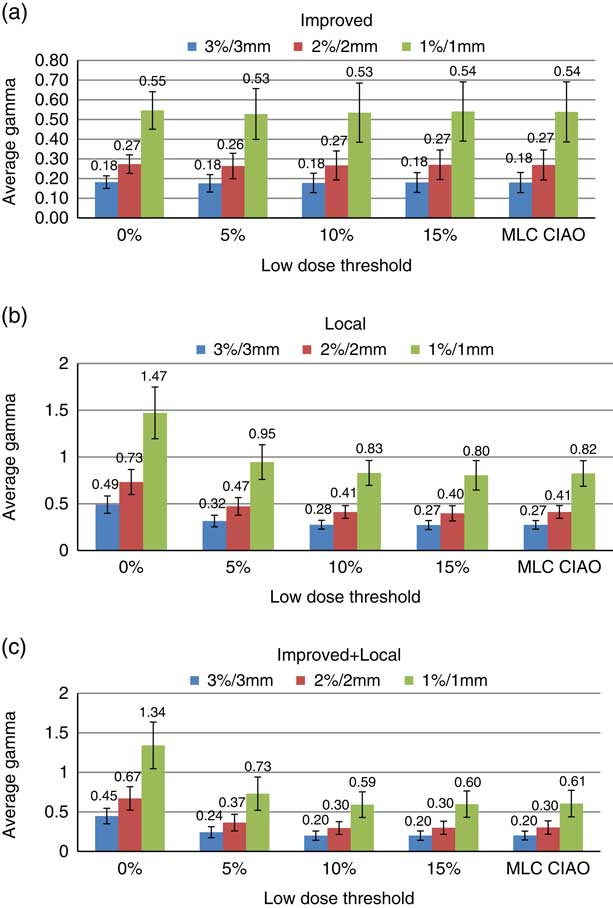
Figure 3 Distribution of histogram representation of average γ ave with SD for (a) improved, (b) local and (c) improved+local gamma calculation techniques within different regions of interest (Field+0, Field+5%, Field+10%, Field+15% and MLC CIAO).
Maximum dose difference (DDmax) and average dose difference (DDave)
Table 2 represents the average and SD of maximum dose difference for various ROIs. The mean and the SD values of DDmax was unaffected by the change in threshold. The mean and the SD of DDave have increased by 58 and 73%, respectively, as the threshold increases from 0 to 15%. The increase plateaus at 10% for both the mean and SD values. There is a slight drop in the results within MLC CIAO compared with those within 10 and 15% thresholds.
Table 2 The average and SD of maximum dose difference (DDmax) and average dose difference (DDave) for different low-dose thresholds

DISCUSSION
We have performed detailed gamma analysis on 232 portal dose images from 100 prostate cancer patient’s VMAT plans. The gamma passing rate, maximum gamma, average gamma, maximum dose difference and the average dose difference were obtained for three gamma criteria (3%/3 mm, 2%/2 mm and 1%/1 mm), five ROIs (Field+0, Field+5%, Field+10%, Field+15% and MLC CIAO) and three gamma calculation techniques of improved, local and improved+local using the integrated Varian solution (RapidArcTM planning, EPID and Portal dosimetry system). Using the improved gamma technique, a small change (<0·5%) was observed in the %GP as the low-dose threshold increased. Song et al.Reference Song, Kim and Park 17 reported a decrease of 0·2, 2·6 and 18% in %GP for 3%/3 mm, 2%/2 mm and 1%/1 mm criteria, respectively, in prostate cases using the global gamma technique. They studied the effect of the low-dose threshold (0, 5, 10 and 15%) on %GP in global and local gamma analysis on ten head and neck, ten brain and ten prostate cancer cases using Varian EPID on Clinac iX linear accelerator and portal dosimetry version 10.0. Using local gamma method, Song et al. observed an increase of 6·2, 11·5 and 14·3% in %GP for 3%/3 mm, 2%/2 mm and 1%/1 mm criteria, respectively, from 0 to 15% threshold for prostate cases.Reference Song, Kim and Park 17 We observed that as the threshold increases from 0 to 15%, the mean %GP increases by 13, 27 and 48% for the 3%/3 mm, 2%/2 mm and 1%/1 mm criteria, respectively.
At the low-dose threshold of 10%, the gamma passing rates for the acceptance criteria of 3%/3 mm, 2%/2 mm and 1%/1 mm were 99·61±0·32, 95·55±1·98, 67·19±6·44% in global and 97·7±1·2, 88·19±3·68, and 51·18±7·14% in local gamma methods, respectively, as reported by Song et al.Reference Song, Kim and Park 17 However, we observed %GP values of 99·8±0·4, 98·9±2 and 87·6±8·8% in improved and 99·5±0·6, 96·9±2·7, and 72·4±10·1% in local gamma methods for 3%/3 mm, 2%/2 mm and 1%/1 mm criteria, respectively, at 10% threshold. Therefore, we obtained higher gamma passing rates, especially at more stringent criteria. The differences in %GP values and the percentage change in %GP with low-dose threshold between the two studies could be due to two reasons. First, the number of prostate VMAT treatment plans we studied was 23·2 times larger. Second, in our study, the treatments were planned, delivered and analyzed using Varian Eclipse TPS and portal dosimetry version 11.0 on a Varian TrueBeamTM machine, whereas Song et al. used Clinac iX linear accelerator and Eclipse TPS and portal dosimetry version 10.0. In our clinic, we use the 3%/3 mm improved gamma criterion with a passing rate of 95% as the action level for all sites VMAT plan QA. However, our findings suggest that stricter gamma passing rates can be achieved without increased resources (additional measurements or configurations) for prostate cancer cases. Therefore, we will implement a stricter 3%/3 mm improved gamma criterion with a passing rate of 97% or the 2%/2 mm improved gamma criterion with a passing rate of 95%, regardless of the applied low-dose threshold for a VMAT prostate pre-treatment QA and using the Varian EPID.
CONCLUSIONS
Since 2013 we have been using a 3%/3 mm improved gamma criterion with a gamma passing rate of 95% for QA of all VMAT plans. However, based on current data analysis, stricter gamma criteria with higher gamma passing rates can easily be implemented for QA of prostate treatment plans. A stricter 3%/3 mm improved gamma criterion with a passing rate of 97% or the 2%/2 mm improved gamma criterion with a passing rate of 95% can be achieved without increased resources. However, studying the sensitivity of such criteria to detect errors in the planning and delivery of prostate VMAT plans is currently being investigated.
Acknowledgements
The authors wish to acknowledge Klaudia Steckel and Ryan Ferguson for their assistance in data extraction.
Financial support
This work was supported through research grant provided by the TELLUS Ride For Dad and the Prostate Cancer Fight Foundation.
Conflicts of Interest
None.


