


1. INTRODUCTION
Human capital is a fundamental determinant of economic growth. One of the first to make this observation was Uzawa (Reference Uzawa1965), who, like Mankiw et al. (Reference Mankiw, Phelps and Romer1995), explained the growth of economies in terms of the accumulation of human capital. Nelson and Phelps (Reference Nelson and Phelps1966) focused more on the mechanism of human capital and growth, suggesting that education accelerates the process of technological diffusion, whose externalities generate economic growth. Of the long-term analyses aligned with this idea, that of Goldin and Katz (Reference Goldin and Katz2008), claims that the higher the level of education, the greater the individual productivity rate and the higher the aggregate growth rate. «That the 20th Century was both the American Century and Human Capital Century is no historical accident» (Goldin and Katz, Reference Goldin and Katz2008), given the strong connection between the role of education and the development of a great technological process that stimulated economic growth. Therefore, focusing on the analysis of educational policies will allow us to understand the role of educational systems in economic growth (Hanushek and Woessmann, Reference Hanushek and Woessmann2012).
If we focus on Latin American education throughout the 20th century, we can see considerable contradictions. On the one hand, significant efforts have been made resulting in substantive improvements to educational levels. On the other hand, in the longer term these efforts seem to have been slow and insufficient, Latin America having been at a clear disadvantage in comparison with other parts of the world (Bértola and Ocampo, Reference Bértola and y Ocampo2013). Since colonial times, education in Latin America has sought to preserve the established social order, having initially been promoted by Catholic missions to indoctrinate the native population in the Catholic religion, while «academic» education was only focused on the elites. Modern educational systems in the region are the creations of independent states, associated with the emergence of political parties and industrial groups. However, significant progress is only observed in primary school enrolment until the first part of the 20th century (Bértola and Ocampo, Reference Bértola and y Ocampo2013). In this process of expanding educational coverage in the early 20th century, Colombia fell quite a long way behind those states that achieved high rates of educational coverage early, namely Argentina, Chile, Costa Rica and Uruguay (Bulmer-Thomas, Reference Bulmer-Thomas2003). In the same way, many territorial differences in the enrolment rates in Colombia appeared in the first half of the 20th century (Helg, Reference Helg2001). Even today great differences in the coverage and the quality of education are observed (Galvis and Meisel Roca, Reference Galvis and y Meisel Roca2010). In that frame, the present study seeks to contribute to the debate regarding territorial differences and patterns of the persistence of poverty and underdevelopment in the periphery in Colombia from the identification of patterns of low coverage in the first half in the 20th century for both primary and secondary education.
Education was one of the main concerns of the Colombian state at the beginning of the 20th century. As a consequence, a national and centralised educational program was established, the financing of which had to be assumed by each of the departments until at least the end of the 1950s. The differences in regional incomes and local decisions on levels of spending on education in turn caused large and persistent differences which persist today. Although territorial differences in educational coverage have been reduced in recent decades, differences in quality have become the central problem. In this respect, the departments with the lowest coverage rates at the beginning of the 20th century, such as Chocó and La Guajira, still show the worst results regarding mathematical and language skills, even though educational coverage has improved considerably (Meisel Roca, Reference Meisel Roca2011).
Likewise, these territorial differences are also observable in incomes and have become persistent in the longer term (Galvis and Meisel Roca Reference Galvis and Meisel Roca2013; Meisel Roca Reference Meisel Roca2011), especially between the departments located at the centre and on the periphery of the country respectively. Nowadays, these departments have the lowest gross domestic product (GDP) per capita and the largest numbers of people living in poverty (García, Reference García2008). In this regard, long-term studies of territorial disparities are scarce due to the lack of reliable data on departmental incomes in the first half of the 20th century, although there are a few exceptions. These include Bonet and Meisel (Reference Bonet and y Meisel Roca2002), who study the distribution of long-term incomes and the process of regional convergence for the period 1926-95.
As well as being suggested by the economic literature, the accumulation of human capital is one of the main determinants of the competitiveness of regional economies and levels of income, meaning that solving these problems is a sine qua non for achieving convergence in incomes between regions and thus improving the productivity of the economy. Therefore, the identification of patterns of low educational coverage in the first half of the 20th century can help to understand the origin of the persistent patterns of poverty in some territories. For this purpose, series of the enrolment rates of primary and secondary education for all the territories in the country have been constructed for the 1904-58 period. This period appears to be one of the most determining factors in the origin of educational coverage differences in Colombia due to the decentralised nature of education funding.Footnote 1 In the same way, deepening the analysis of educational expenditure by territories, policies of national and local scope, and the country’s urban transformation, may help to analyse the historical origins of these differences. The results of this paper suggest that the decentralisation of education financing contributed to increase differences in education coverage as there is a high correlation between regions’ fiscal capacity and enrolment rates. Also, the urbanisation process allowed a greater enrolment of children in the most densely populated territories.
Previous studies of education in Colombia have used historical perspectives centred mainly on the departments in the centre of the country (Ramírez and Salazar, Reference Ramírez and y Salazar2007; Ramírez and Téllez, Reference Ramírez and y Téllez2007), but there are still gaps in the literature on long-term educational outcomes in the peripheral territories. It has not been possible, until the present, to carry out analyses of the decentralisation or the urbanisation processes that take into account all of Colombia's territories for the first half of the 20th century.
Finally, the results of this work, as can been seen in other studies of incomes (Meisel Roca, Reference Meisel Roca2011), show a tendency towards the formation of an educational cluster in the centre and the existence of a human capital trap in the periphery of the country during the whole period, which in the 1950s was much more marked in both primary and secondary education. The results also suggest that there is a high correlation between the budgetary capacity of the territories and enrolment rates between 1904 and 1958. Finally, it can also be observed that the territories with the highest enrolment rates can be correlated with high urban enrolment rates from the beginning of national urbanisation.
The next section presents different debates on territorial differences in educational provision. Section 3 tackles the history of the development of education in Colombia while section 4 describes the methodology and sources used. Section 5 presents results and section 6 provides a conclusion.
2. DETERMINANTS OF INVESTMENT IN EDUCATION
The determinants of the differences in regional development have stimulated an interest in the literature on economics. Using information from 110 countries and 1,500 territorial and subnational divisions, Gennaioli et al. (Reference Gennaioli, La Porta, Lopez-de-Silanes and Shleifer2012) found that education is the factor that best explains the differences in per capita income levels between regions and that, conversely, local institutions have minimal influence. In the case of Latin America, Bejarano (Reference Bejarano2007) found that human capital in itself represents approximately half of the differences in GDP per capita between municipalities in a group of countries.
The question is what makes the regions of a given country have different levels in the accumulation of human capital. Within the different derived hypotheses, many authors see the decentralisation of education as the main cause, although some authors argue that decentralisation has positive impacts on the level of educational expenditure because it tends to provide better education (Goldin, Reference Goldin2001; Goldin and Katz, Reference Goldin and Katz2008; Lindert, Reference Lindert2003). In contrast, other authors argue that decentralisation may create inefficiencies in the provision of education (Vollrath, Reference Vollrath2013), in many cases causing underprovision or even a human capital trap (Cappelli, Reference Cappelli2016).
As for the Latin America experience, Newland (Reference Newland1991) explains that from the Declarations of Independence, many countries inherited a decentralised education model from the colonial institutions. However, the tendency towards centralisation was strengthened in all Latin American countries, especially those in which economic growth was strong. In countries such as Argentina, Venezuela or Mexico, national agencies were created to exercise control of education, while in most countries centralisation was initiated when the national state began to finance education. The main problem of the decentralised model was, on the one hand, that primary education was not a priority, hence spending on education was very low during a significant part of the 20th century; on the other hand, education was more focused on the elite of each country. Arroyo (Reference Arroyo Abad2016), in line with the previous idea, affirms on the movement of centralisation in 1905 in Peru, that their centralised model resulted in a suboptimal provision of educational services because of the lack of political representation and the more restrictive nature of the electoral process in which the indigenous population was not allowed to participate.
Regarding the 20th century, the reforms carried out in Latin America during the 1980s to modify the paternalistic role of the state resulted in the adoption of decentralised models of education; many studies emerged from the 1990s when some countries established decentralised education systems. Prawda (Reference Prawda1993) and Di Gropello (Reference Di Gropello1997), in a comparative analysis on the different effects of decentralised education in several Latin American countries, found that certain errors of implementation and design of educational reforms generated great divergences in the quality indicators between the different geographical areas. As for the recent literature, Habibi et al. (Reference Habibi, Huang, Miranda, Ranis, Sarkar and Stewart2003) on Argentina, found that decentralisation had a positive impact on human development across all regions and led to a significant reduction in regional disparities. On the contrary, although Galiani, Gertler and Schargrodsky (Reference Galiani, Gertler and Schargrodsky2008) confirmed that decentralisation had an overall positive impact on student test scores, they also said it did not reach the poor areas because of a lack of ability to defend their preferences as a community.
In the absence of a centralised system, other factors acquire special weight, such as the heterogeneity of local economic and institutional characteristics or preferences. Following this line of reasoning, some authors have found that differences in public spending are associated with ethnic diversity. Several studies at the subnational level argue that the more fragmented and ethnically diverse a region, the lower its provision of public goods, including education (Alesina, Glaeser, and Glaeser, Reference Alesina, Glaeser and Glaeser2004; Stichnoth and der Straeten, Reference Stichnoth and Der Straeten2013).
Another element that has aroused much interest within the institutional literature is the relationship between the concentration of land and the provision of education. In this line, Frankema (Reference Frankema2009) points out that Latin America’s historical legacy of a high concentration of landownership might have restricted the expansion of public education. Similarly, in an empirical work on Brazil during the 19th and 20th centuries, Wegenast (Reference Wegenast2010) found that provinces where slave or cheap labour was prevalent had lower enrolment rates in the long term. He attributed this to the fact that Brazil’s politically influential agrarian elite had no interest in promoting schooling, as not only would extending education cost more through taxes, it might also lead rural workers to seek better-paid jobs.
In another approach, Lucas (Reference Lucas1988) recognised the role of large cities in human capital accumulation. He argues that large cities foster spillovers of knowledge that drive economic growth. The size and persistence of wage gaps between rural and urban workers provide incentives for investments in education. Therefore literacy rates and average educational attainment levels tend to be higher in urban areas than in rural areas (Williamson, Reference Williamson1988).
Nonetheless, the literature on the origin of the disparities in education in Colombia is scarce, with only a few works taking a long-term view. One of the main such examples is Ramírez and Salazar (Reference Ramírez and y Salazar2007), who go back to the 19th century and point out that, due to the geographical and political fragmentation of that time, creating either a state or a standard and consolidated educational system was very difficult. During the 19th century, all states in the country had meagre enrolment rates except for Antioquia and Cundinamarca. The authors found that those territories with high school-enrolment rates had also made the most significant investments in education, whereas low enrolment rates were correlated with critical financial situations and low incomes. Institutional factors were also decisive. Thus, Antioquia played a significant role in the expansion of coffee cultivation, its agrarian structure being based on small-scale coffee-growers and landowners, who had a great incentive to become educated in order to manage their lands and farms.Footnote 2
Bearing in mind that the educational system has its origins in legislation defined in the early years of the 20th century, few works address the first decades of that century. The most important such work is by Ramírez and Téllez (Reference Ramírez and y Téllez2007), who, focused mainly on the departments in the centre of the country. Based on an initial analytical analysis of the subnational level in the longer term, they identify some of the causes of subnational differences in the provision of education. These authors point out that the high rates at the beginning of the 20th century were associated with higher levels of industrialisation, higher incomes, higher educational expenditure and higher teaching salaries.
3. BACKGROUND: TERRITORIAL DISPARITIES IN COLOMBIA AND EDUCATION POLICIES BEFORE THE FIRST HALF OF THE 20TH CENTURY
Colombia is a middle-income country similar in size of income to Brazil, Mexico, Peru and Venezuela (Bértola and Ocampo, Reference Bértola and y Ocampo2013), with almost fifty million inhabitants and a land area of about 1.2 million km2. Today Colombia is made up of thirty-two departments and Bogotá, the capital district, which is treated as a department (Figure 1). Departments are subdivisions of the country similar to the French system, each of them in turn being subdivided into municipalities, which are further subdivided into corregimientos in rural areas and comunas in urban areas.

FIGURE 1 TERRITORIAL ORGANISATION OF COLOMBIA BY DEPARTMENTS.
Colombia has many regions with very different racial, ethnic, social and geographical characteristics, whose processes of colonisation have conditioned their present-day cultural and socioeconomic factors. In the centre of the country, we find what might be called the «Andean trapezium» (Trapecio Andino), which includes the area traditionally known as the «golden triangle» (Bogotá-Medellin-Cali), with an offshoot to Santander, and more specifically to Bucaramanga and its metropolitan area. In 2001, 53% of Colombia’s total national population was concentrated in the trapezium, which constitutes a centre-periphery structure in the distribution of economic activity in Colombia (Galvis, Reference Galvis2001). Moreover, Barranquilla (Atlantic), located on the Caribbean coast, is the fourth most populous city in the country and, as an important centre of industry and development, it is an exception in the Caribbean area. Conversely, departments located in the periphery of the country, whose population is mostly black or indigenous, such as Chocó, Guajira, Magdalena and Nariño, have the highest rates of poverty and the worst indicators of human development in the country, as we see in Figure 2.

FIGURE 2 HUMAN DEVELOPMENT INDEX (HDI) AND SHARE OF PEOPLE LIVING IN POVERTY IN COLOMBIA BY DEPARTMENTS, 2005.
These differences between centre and periphery are not only spatial but also temporal (Galvis and Meisel Roca, Reference Galvis and y Meisel Roca2010). Works on regional differences in Colombia have found persistent patterns of long-term poverty in the periphery of the country associated with institutional determinants such as the colonial legacy (Bonet and Meisel Roca, Reference Bonet and y Meisel Roca2007) and the initial level of human capital (Meisel Roca, Reference Meisel Roca2011).
3.1. Roots of the Colombian Educational System and Policies During the First Half of the 20th Century
Although the greater part of Colombia’s present-day educational system reflects the reforms carried out at the beginning of the 20th century, the roots of the reform date back to 1870, when liberal governments under the direction of General Eustorgio Salgar introduced a system of public education with national coverage. Until 1886, Colombia was a federal state composed of nine states, and until that date the design and financing of education had been their responsibility.Footnote 3 As Ramírez and Salazar (Reference Ramírez and y Salazar2007) point out, under the 1870 reform public primary education became free and mandatory for all children between 6 and 14 years, being secular, centralised and supervised by the national government. This reform was not very successful, mainly due to opposition from the Church and its influence over the population, one of the leading causes of the civil war between 1876 and 1877.Footnote 4
Years later, the conflict between Church and state ended with the introduction of Colombia’s new Constitution of 1886 establishing an alliance between them. Likewise, a new territorial organisation was created and maintained until 1991 in which the federated states became departments, subdivided into smaller units called municipalities (municipios). However, administrative entities called national territories (territorios nacionales) were retained for the more peripheral areas.Footnote 5 These territories were located very far from Bogota and had low levels of population, lacked the capacity for self-government and depended on the central government for their administration.
This new territorial organisation was framed by a model of political centralism combined with administrative decentralisation. In 1887, a Concordat was signed whereby the state gave the Church control over various administrative and educational procedures and explicitly supported private Catholic education. Likewise, as part of the new constitutional background, education in the national territories was handed over to different Catholic missions, whose primary objective, beyond encouraging literacy among the indigenous groups living there, was to catechise them.
Between 1899 and 1902, conflicts between the Conservative Party and the Liberal Party unleashed the Thousand Days' War, which destroyed a large part of the transport infrastructure, preventing many children from attending school. National reconstruction after the war was supported by coffee exports, which allowed enough capital accumulation to initiate a process of industrialisation in Colombia, led in particular by the textile industry in Antioquia (Bejarano, Reference Bejarano2007). In 1903 Panama separated from Colombia with the support of United States, becoming an independent state.
After the war, under the Conservative General Rafael Reyes, a policy of economic reconstruction was carried out in which several laws were issued to regulate and organize public administration in the country (Ramírez and Téllez, Reference Ramírez and y Téllez2007). In education, Law 39 of 1903 and Decree 491 of 1904 defined the new characteristics of the education system. Education ceased to be compulsory, and public education was organised and directed by the Catholic Church in primary and secondary schools. Primary education was distributed between urban, rural and night schools, each governed by different standards. The night schools were created to fight against working-class illiteracy, but they only gave basic notions of primary education. The urban primary education programme lasted for 6 years and offered the most complete education, while rural primary education lasted only 3 years. In both rural and urban schools, the responsibility for women's education was given to each community; it was to be free and to be run by women from the same community. The secondary school system was very heterogeneous, while most high schools were private, many of them were technical and vocational schools. Technical education focused on classes for the poor and was taught in supplementary schools, night schools, arts and crafts schools and technical schools. In the same way, commercial and agricultural schools were founded, some of them offering higher education, while others offered intermediate alternatives between primary and secondary education. In all cases, in both primary and secondary education, the central government designed educational programmes in broad terms, leaving some freedom for their adaptation to local preferences.
Regarding financing, the new legislation mainly gave the responsibility for hiring, supervision and the cost of primary education, which had the highest costs of any level of education, to the departments. Moreover, each department was free to decide what percentage of its income it invested in education. Also, the construction of schools was handed over to the municipalities. Conversely, the central government merely undertook inspections, provided teaching materials and school supplies to primary schools and funded a secondary school in each department. Regarding secondary education, the central government financed one school for boys and one for girls in each department. In the event that the demand for secondary education was higher, the departments were obliged to provide additional schools themselves.
By the same token, the decentralised system fostered great discrepancies in the allocation of educational resources between departments, causing significant educational inequalities (Ramírez and Téllez, Reference Ramírez and y Téllez2007). Very few departments had large enough economies to provide the resources to promote universal access to education. In this respect, the main sources of departmental income were the taxes on the consumption of meat, alcohol and tobacco. Departmental governments had a monopoly on the production of alcohol, which became the main source of income for several departments such as Antioquia, Santander and Caldas (Ocampo, Reference Ocampo1999). The case of Antioquia is surprising, as its income at the beginning of the 1910s was more than double that of the second-ranking department, and it had up to ten times more income than some other departments.Footnote 6
In 1930, the Liberal Enrique Olaya Herrera won the presidential elections, ending 44 years of Conservative governments. In 1934, the new government of López Pumarejo claimed that decentralisation was the leading cause of educational backwardness and of the considerable inequalities between departments, so he prioritised solving the issue. Not only did the differences between departments begin to increase, so did those between urban and rural education. This was partly because rural schools received much less finance for their operations. Helg (Reference Helg2001) states that, between 1932 and 1936, rural areas received only 37% of departmental educational resources, while urban areas obtained 63%. In 1938, a Municipal Development Fund (Fondo de Desarrollo Municipal) was created, followed in 1944 by a National School Fund (Fondo Nacionale de Educación), which the government used to try to channel more state resources to the less favoured regions.
By 1945, a different dynamic of growth and structural change had emerged which continued for the next four decades. As Ocampo (Reference Ocampo1999) explains, the transition from a rural to an urban and semi-industrial economy had a significant impact on the agricultural sector, causing a substantial reduction in its participation in the international economy. Mortality rates fell, and the population growth rate greatly accelerated, especially between the fifties and sixties, when the population increased by 2.5% per year. The major cities grew from housing 31% of the population in 1938 to 52% in 1951, this growth being mainly concentrated in the cities of Bogota, Medellin, Cali and Barranquilla.Footnote 7 These concentrations in urban areas also generated large differences between the quality of urban and rural education, the best qualified teachers being concentrated in the cities. While in 1950, 82% of teachers in rural primary schools had no teaching certificate, in urban schools only 49% were uncertified (Ramírez and Téllez, Reference Ramírez and y Téllez2007).
These demographic changes, together with a greater national fiscal effort, meant that from 1950 until the mid-1970s educational indicators saw unprecedented improvements. Likewise, the new education policies obliged municipalities and departments to allocate a fixed percentage of their income to education, which was reflected in an unprecedented growth in primary- and secondary-school enrolment rates (Ramírez and Téllez, Reference Ramírez and y Téllez2007).
By 1958, an electoral coalition between Conservatives and Liberals signed a stability pact, the Frente Nacional, with the goal of ending the dictatorship of Rojas Pinilla. This political pact introduced many changes to how the legal framework for education was financed, perhaps the main one being a move towards centralizing the financing of education. One aspect of this was the fact that central government assumed greater responsibility for financing the salaries of primary education teachers (Arvone, Reference Arvone1978).
4. METHODOLOGY AND SOURCES
Annual data were collected on the number of students enrolled in primary and secondary education and on spending on education between 1900 and 1958 for each department and the country as a whole. Previous research on education for this period mainly provided national data, and although there were also some departmental data, not all departments or national territories in the country were taken into account (Ramírez and Téllez, Reference Ramírez and y Téllez2007). The main contribution of this work has been the construction of long-term series for all departments and national territories in Colombia, including both continental and insular territories, resulting in nineteen territorial entities as shown in Figure 3. For the construction of the series of students enrolled and spending on education, data from the Yearbooks of the Ministry of Education (Memorias del Ministerio de Educación) from 1910 to 1958 and the Colombian Statistical Yearbooks of the National Administrative Department of Statistics (Departamento Administrativo Nacional de Estadísitica, hereafter DANE) were used; and for the estimates of children of school age, population censuses between 1905 and 1964 were used. The tables in Appendix 1 present the summary of all the series built for all the territories and the notes explain in more detail the construction of these series, the primary sources used as well as a discussion of the definition of the internal borders and the country’s foreign borders.
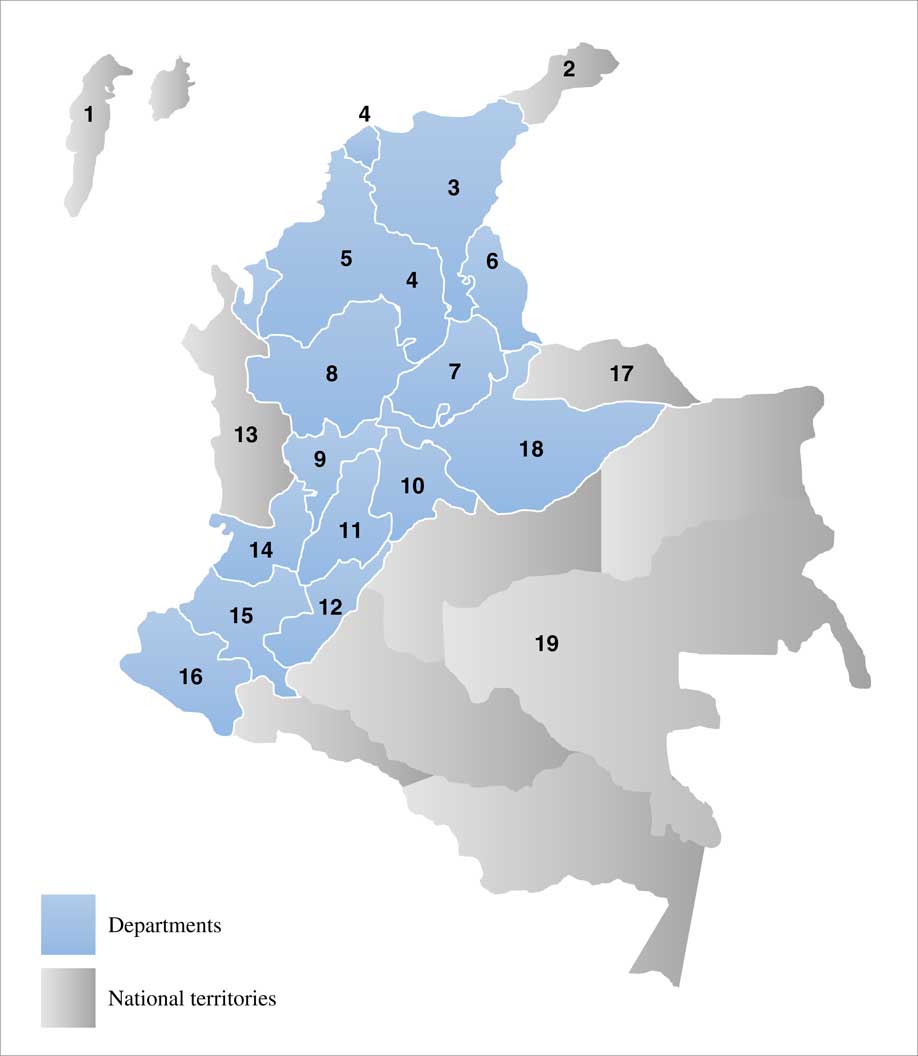
FIGURE 3 COLOMBIAN TERRITORIAL ORGANISATION BY DEPARTMENTS AND NATIONAL TERRITORIES IN 1942.
Moreover, the data have been disaggregated between primary and secondary education, and primary education has been disaggregated further into rural and urban education. As for spending on education, some previous series already existed, elaborated by Ramírez and Téllez (Reference Ramírez and y Téllez2007) for departments located in the centre of the country between 1925 and 1950. Here I have completed their series with data for 1918-25 and 1950-58, and all Colombian departments (including those in the periphery) have been included. As a result, long-term series was created for the departments of Antioquia, Atlántico, Bolívar-Córdoba, Boyacá, Caldas, Cauca, Cundinamarca, Huila, Magdalena, Nariño, Santander, Norte de Santander, Tolima and Valle del Cauca and the national territory of Chocó.
My analysis of this information is mainly descriptive and does not seek to compare causalities, so the results should be read with caution. Rather, the objective has been to identify regional patterns that help explain the differences in the enrolment rates between territories. Hence, to help identify spatial patterns, maps have been drawn based on enrolment rates by territory. Likewise, in order to identify patterns of convergence, box plots have been used for primary and secondary education. For analyses related to investment in education and the urbanisation process, cross-sectional plots have been used. Lastly, to complement the quantitative analysis, qualitative information has been used from the Ministry of Education Yearbooks.
5. TERRITORIAL DISPARITIES: ANALYSING PATTERNS
Figures 4 and 5 show the geographical distribution of enrolment rates in primary and secondary schools in the country for 6 years selected between 1905 and 1958. The findings suggest the formation of an educational cluster in the centre of the country, which already existed at the beginning of the 20th century, but which became much more noticeable in the middle of the century in both primary and secondary education. Likewise, the results show a strong correlation between the backwardness in the Gross Enrolment Rate (GER) and the fact that it was a national territory. Therefore, according to enrolment rates the country tended to be divided into centre and periphery, or rather into departments and national territories. This geographical pattern of educational backwardness in the periphery and high enrolment rates in the centre of the country coincides with the levels of development reached in the later years in the «Andean Trapezium», (Trapecio Andino) defined by Galvis (Reference Galvis2001). Hence, one could also speak of the existence of an «Andean educational Trapezium» during the first half of the 20th century. In relation to secondary education, a pattern of correlation is observed between enrolment rates and a high level of industrial development. As in the cases of Antioquia, Atlántico, Cundinamarca, Santander and Valle del Cauca, which in 1936 accommodated 70% of the country's industrial centres, together with Caldas, in 1932 they accounted for about 60% of the country's coffee production, as well as having the highest enrolment rates in the entire period (Ocampo, Reference Ocampo2015).Footnote 8

FIGURE 4 PRIMARY SCHOOL ENROLMENT RATES BY DEPARTMENTS AND NATIONAL TERRITORIES, 1904-1958.

FIGURE 5 SECONDARY SCHOOL ENROLMENT RATES BY DEPARTMENTS AND NATIONAL TERRITORIES, 1904-58.
Figures 6 and 7 illustrate in box plots the evolution of the distribution of the GER before mid-century for both primary and secondary schools. In the box plots, the median is represented by the line in the box, the box indicates the degree of dispersion (spread) and represents 50% of the data, and finally the whiskers represent the ranges for the bottom 25% and the top 25% of the data values, excluding outliers. The results indicate a clear pattern of convergence in the primary school series, so territorial differences tend to be smaller the closer we come to the mid-20th century. Also, there was an increase in the value of the median between 1905 and 1915, with slight upward and downward fluctuations until 1945, and again a considerable increase in 1955, indicating significant improvements in aggregate enrolment at the end of the period. This increase in enrolment rates after 1950 responds to the demographic expansion that occurred after the mid-1940s (Ramírez and Téllez, Reference Ramírez and y Téllez2007). Not many outliers are observed in the whole period, the whiskers indicating that most of the distribution is concentrated around the median. Regarding secondary education, we see a very different scenario. On the one hand, average enrolment rates in secondary schools begin an upward trend at the beginning of the century, while a second period of growth started in the 1930s. On the other hand, the box plot shows large interquartile ranges indicating high levels of dispersion in all selected years, with a positive asymmetry in all cases. Whiskers located far from the median show many atypical values in the distributions. For most years we find outliers, corroborating the idea that there were consistent asymmetries in the levels of enrolment in secondary education during the first half of the 20th century (Helg, Reference Helg2001; Ramírez and Téllez, Reference Ramírez and y Téllez2007).

FIGURE 6 NATIONAL PRIMARY SCHOOL ENROLMENT DISTRIBUTION, 1905, 1915, 1925, 1945, 1955.

FIGURE 7 NATIONAL SECONDARY SCHOOL ENROLMENT DISTRIBUTION, 1905, 1915, 1925, 1945, 1955.
Since the main objective of this work is to identify regional patterns in the evolution of enrolment rates, in Tables 1 and 2 the observed patterns were categorised according to the changes in the positions of the ranking of enrolment rates in 1905 and 1958. The first pattern refers to those territories that maintained high enrolment rates, the second to those that maintained low enrolment rates, the third to those who improved them, and finally the fourth to those cases where they deteriorated. The results show that Antioquia and Cundinamarca are among those with high enrolment rates in both primary and secondary education, while Guajira, Magdalena and Chocó are among those with low enrolment rates. The question that arises from these results is what these patterns can be associated with.
TABLE 1 PATTERNS OF ENROLMENT FOR PRIMARY SCHOOL BY DEPARTMENTS AND NATIONAL TERRITORIES ACCORDING TO THE 1905 AND 1958 RANKINGS
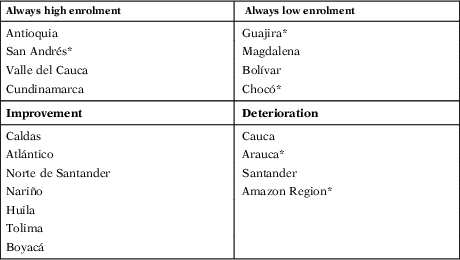
Notes: *Indicates national territories. Under «Always High Enrolment» are those territories that remained among the six first positions. Under «Always Low Enrolment» are those territories that remained between the last positions. Under «Improvement» are those territories that advanced at least one position. Under «Deterioration» are those territories that retreated at least one position.
Source: See text.
TABLE 2 PATTERNS OF ENROLMENT FOR SECONDARY SCHOOL BY DEPARTMENTS AND NATIONAL TERRITORIES ACCORDING TO THE 1905 AND 1958 RANKINGS

Notes: See Table 1.
Source: See text.
5.1. Educational Expenditure: «Following the Money»
As Lindert (Reference Lindert2010) argues, the key to Latin America’s poor schooling was the failure to supply it with money from taxes, not gender discrimination or any shortfall in the market demand for skills. Therefore, to understand the patterns in the differences in educational supply between territories, the origins of the financing of education should be examined.
As mentioned above, the educational policies introduced at the beginning of the 20th century depended on a decentralised financing model which shared educational expenditure among the three levels of government: national, departmental and municipal. In Figure 8, we see that, until the end of the 1950s, the greatest weight of financing was assumed by the departmental governments, followed by national government, with only a small share coming from the municipalities. There was also an increase in national spending from the beginning of the 1920s, which coincides with the Dance of the Millions (La Danza de Los Millones), money received as compensation for the separation of Panama from the United States and the boom in loans and exports. Once these resources had been spent, and after the crisis of the 1930s, there was a significant decline in national spending on education. Indeed, departmental spending remained constant, as a counterweight to the decrease in national expenditure. Only after 1936 did national spending tend to increase, and even then, it did not reach departmental expenditure levels until the late 1950s. After 1950 significant increases in education expenditure can be observed. These years are considered to have been a period of economic prosperity when the annual growth in GDP was 4.3%, and tax revenues rose from 5.7% to 7.1% as a share of GDP (Rincon and Junguito, Reference Rincon and y junguito2007).

FIGURE 8 NATIONAL, DEPARTMENTAL AND MUNICIPAL EXPENDITURE ON EDUCATION, 1918-60.
If we go back to the distribution patterns of the enrolment rates, we see that the lowest enrolment rates are mainly the national territories, those financed exclusively by the national government. According to the Memoir of Education of 1921, the national budget dedicated to education in the national territories was less than 13% of the total budget, which was already low in itself. Moreover, if we analyse the differences in the levels of educational expenditure per child of school age and department, as shown in Figure 9, we see a clear pattern that links the high enrolment rates with a greater level of investment in education. Earlier studies showed that in most cases educational spending as a share of total spending fluctuated between 10% and 30%, and the departments that presented the highest percentages were those that decided to allocate a higher percentage of their total budgets to education, such as Antioquia, Cundinamarca and Valle del Cauca (Ramírez and Téllez, Reference Ramírez and y Téllez2007).

FIGURE 9 DEPARTMENTAL DIFFERENCES IN PUBLIC EDUCATION SPENDING PER CHILD IN SCHOOL-AGE FROM 5 TO 14 AND GER, 1920, 1930, 1939, 1950, AND 1958.
This greater investment in education in some departments reflects the local interest in improving educational indicators. After 1912 in Antioquia, for example, as reflected in the Memoir of Education of 1915, it was decided by departmental decree to invest 6% of the tax revenues from alcohol, tobacco and animal slaughtering in the construction of schools. In 1920 Antioquia was already devoting more than a third of its income to primary education, which corresponded to almost half of what the national government was spending on education.Footnote 9 Conversely, other departments had great problems in supplying their schools with the teachers needed to run them, forcing the recruitment of totally unskilled teachers and even the closure of many schools.Footnote 10
As mentioned above, the central government had committed itself to providing at least one secondary school for boys and one for girls in each department, but only co-educational schools for boys and girls were financed in Antioquia, Boyacá, Cauca and Cundinamarca. In other departments, only boys’ schools were established, and in some cases none at all, so each department was obliged to provide them. This did not pose great problems for departments with large budgetary capacities such as Atlántico, but in others like Bolívar, whose budget was very low, several schools had to close due to the impossibility of maintaining them.Footnote 11 Other departments such as Cauca or Chocó had to ask for support from Catholic communities to set up schools.Footnote 12
Money, however, does not explain everything, as local educational policies also had a great impact on levels of enrolment, as well as on the demand for education. In Caldas, for example, because much of its population worked in coffee cultivation, since the late 1920s and in the 1930s the National Federation of Coffee Growers was encouraged to support agricultural education and coffee cultivation, while in Cauca this type of project was rejected (Helg Reference Helg2001, 99). Policies focused on demand can also be observed in Valle del Cauca, where the local government, aware of the need to train human capital for industrial development within the department, financed industrial schools in several rural areas from a very early period, teaching the manufacture of straw hats and tobacco cultivation.Footnote 13
Finally, another important point that explains the patterns of success in the expansion of education in some departments was adaptation to changes in the demand for rural and urban education. In Antioquia, for example, educational policies in the first two decades of the century fostered rural education, and a large number of schools were founded in very remote rural areas, reaching almost half the total number of primary schools.Footnote 14 In 13 years from the 1940s to the 1960s, the urban population increased by 500% on average in almost all departments, while the rural population only grew by 35%. However, only Antioquia, Atlántico, Cundinamarca, Valle del Cauca and Caldas managed to absorb the demand for urban education, as shown in Figure 10.Footnote 15 This high increase in the enrolment rate in urban education may be associated partly with the larger budgetary capacity and partly with the increased demand for education. The task of increasing the qualified human capital of new industries and services also explains the higher enrolment rates in secondary education in these departments.Footnote 16

FIGURE 10 URBAN AND RURAL PRIMARY SCHOOL ENROLMENT RATES BY DEPARTMENT AND NATIONAL TERRITORIES, 1904-58.
6 CONCLUSIONS
The existence of poverty traps in some Colombian regions has been a persistent and long-term problem (Bonet and Meisel Roca, Reference Bonet and y Meisel Roca2002). Several authors consider differences in the provision of education to be one of the main causes of poverty traps over time (Galvis and Meisel Roca Reference Galvis and y Meisel Roca2010). This research seeks to contribute to the debate on the origin of differences in regional incomes in Colombia by understanding the causes of regional differences in educational outcomes and thus examining educational provision. As Lindert (Reference Lindert2010) argues, to test the chain of alleged causation from inequalities in schooling, one must follow public money, or lack of it, in as many contexts as the data will allow. Therefore, understanding the patterns of the differences in educational supply between territories in Colombia can be taken further by examining the origins of financing at the beginning of the 20th century, when the principles of the current educational system were established and when a decentralised model of financing was adopted that lasted until the late 1950s.
This model of financing education placed the burden for the provision of education almost entirely on the departments, the central government only contributing in the provision of school materials and the setting up of one secondary school for boys and one for girls in each department. Subsequently, the decentralised model of education was adapted to the territorial organisation of the country. At that time, Colombia was organised territorially into departments and national territories. The departments had a high degree of budgetary autonomy and a certain, if limited, degree of freedom in the design of educational policies. Conversely, the national territories, which were located on the peripheries of the country and whose population was mostly indigenous, did not have budgetary autonomy and depended entirely on the state for both the financing of education and the design of educational programmes. From this point on, this paper argues that, under this territorial division, the adoption of a decentralised model of financing education generated great differences in the provision of education between the territories from the beginning to the middle of the 20th century and slowed the convergence between them due to the great differences in the budgetary capacities of the different territories and the appropriateness of local educational policies.
Therefore, the results of using primary and secondary school enrolment rates as a reference point in analysing territorial differences in the provision of education show, on the one hand, that the highest enrolment rates in primary schools during the first half of the 20th century were correlated with departments that had much higher budgetary capacities, which at that time were those that led the coffee boom at the beginning of the century. Similarly, these departments sought to encourage the demand for education through the adaptation of national education programmes to local needs, such as the promotion of rural education or the teaching of coffee cultivation in coffee-growing areas. Finally, it can also be observed that the departments with the highest education rates managed to absorb the demand for urban education from the 1940s, a period of population explosion and urbanisation in the country.
On the other hand, results related to secondary education show a similar pattern as for primary education, in which high enrolment rates occur in departments with high fiscal capacities. From this point of view, the qualitative information collected in the Memoirs of Education confirms that the lack of commitment on the part of the central government in establishing secondary schools meant that departments with more modest budgets had to close many schools, or in many cases had to resort to the Catholic missions to set up secondary schools. Last, there was a pattern of high enrolment rates in secondary education linked to the area with the most significant industrial development, the «Andean Trapezium».
To conclude, the issue of regional disparities remains central to both the economic history of Colombia and current public policy. Many works have discussed the need to address the lagging behind of certain territories in respect of education as a mechanism for achieving greater levels of development (Meisel Roca Reference Meisel Roca2011). From this point of view, the present work suggests that improving the financing of education and adapting educational policies to local needs can improve educational outcomes and therefore break the persistence over time of interregional inequalities.
ACKNOWLEDGEMENTS
This paper is part of the author’s PhD Dissertation, under the supervision of Sergio Espuelas Barroso and Anna Carreras Marín to whom the author is grateful. Earlier versions of this paper were presented at the Seminario de la Unidad de Historia Económica at Universitat Autònoma de Barcelona; the Inter-University PhD Workshop in Economic History at Universidad Carlos III de Madrid; the Seminario de Estudiantes de Doctorado de Historia Económica at Universitat de Barcelona; and First GLOCREd Workshop (Valencia). This research has also benefited from comments made by Gabriele Cappelli, Germán Forero, Andrea Montero, Monserrat Llonch, Carmen Sarasúa, Antonio Tena Junguito, Juan Carmona, Marc Badía, Yolanda Blasco, Daniel Tirado and the anonymous reviewers who helped me to improve the work greatly. I am also grateful to María Teresa Ramirez for sharing the database of the research project «La educación primaria y secundaria en Colombia en el siglo XX». Finally, the author acknowledges financial support from the Colombian government through the Colciencias Scholarship Program No. 728. All errors are the author’s own.
APPENDIX 1. DISCUSSIONS OF SOURCES
In order to provide internationally comparable data, I have adapted data on the Colombian education system in the first half of the 20th century to the International Normalized Classification of Education (ISCED) of 2011. The classificatory criteria of ISCED’s formal education programmes and Colombia’s educational laws and decrees between 1904 and 1958 were analysed. Although the first of the criteria used was the name of the programme, using it alone can prove misleading. Similar programmes may have different names in different countries, while access and certification requirements between programmes with the same name may not be equivalent (Goldin, Reference Goldin2001). As a result, subsidiary criteria have been adopted here. Whenever the name of a programme was not explicit, the criterion that was chosen was the age of admission. If this information was not available, the decisive criterion was the certificate of access required.
In order to facilitate the analysis, due to the numerous changes in internal borders and in the autonomy levels of each department between 1905 and 1958, I use the territorial order that existed in 1942 because this was what prevailed throughout most of the period. Some territories dating back to before 1942 were excluded because they had disappeared in border wars with Panamá, Brazil and Perú before that date. Since then, there have only been minor changes to internal borders.Footnote 17 In addition, as a data-grouping criterion, in cases when a territory was divided into two or more units the largest territorial division was always the one that was retained, its students and population being added in a single data point.
Also, because the national territories of Meta, Vichada, Putumayo, Caquetá, Vaupés and Amazonas changed their borders many times during this period, it was not possible to treat them independently. For the purposes of this research, therefore, I have grouped them into a single territory I call the Amazon Region, resulting in nineteen observations.
The school-age population has been estimated to be between 5 and 14 years old for primary schools and 15 and 19 for secondary schools, based on the population censuses of 1905, 1912, 1918, 1928, 1938, 1958 and 1964. Exponential growth curves have been estimated based on the three points of the years indicated for each department in order to obtain annual records of the school census. For the territories where ages are not available for the population of school age, or in which the data were suspect, the proportions of children of school age in the 1938, 1951 and 1964 censuses per department have been used in order to obtain an average. This age range was calculated based on the total of population in each department according to the total population in the censuses of 1905, 1912, 1918 and 1928.
Additionally, other data have been collected to perform complementary analyses. I used the Memoir of the Ministry of Finance of 1918 for tax revenues data of 1918, and the Colombian Statistical Yearbooks of 1936 to obtain the number of industrial establishments by department.
The War of a Thousand Days between 1899 and 1902 prevented any data being collected for the first years of the 20th century. As a result, the first Statistical Yearbook for public education did not appear until 1911.Footnote 18 Similarly, the institutional instability of the country did not allow the publication of statistics for some years and territories, so that Ministry of Education Yearbooks are lacking for 1948, 1950, 1952 and 1957. Regarding primary education, it was not possible to collect data anywhere in country in 1900-03, 1924, 1926, 1929 or 1938. In the same way, the available sources only allowed urban education to be disaggregated from rural education from 1927 to 1958. In the case of secondary schools, it was not possible to collect data for 1900-03, 1918-20, 1924-32, 1935 or 1951, nor for 1948 for any department, nor educational expenditure for Chocó for 1932-36 or 1939-48.
Another problem was the lack of homogeneity in the data due to the constant changes made to the legal framework. Likewise, departmental statistics vary greatly from year to year, generating some doubt about the reliability of some data. For several years for which data were missing, figures were interpolated from the numbers of students that did not present many variations between the previous year and the following one, and I also discarded data which seemed to be unreliable.Footnote 19
Finally, it was not possible to arrive at disaggregated school census figures for the rural vs. the urban population, so for this type of analysis I used the total population figure with the same methodology of exponential growth and the censuses of 1928, 1938, 1958 and 1961 as the source.Footnote 20

FIGURE A1 Primary school enrolment rates by departments and national territories, 1904-58.

FIGURE A2 Secondary school enrolment rates by national territories, 1904-58.
TABLE A1 DEPARTMENTAL DIFFERENCES IN PUBLIC EDUCATION EXPENDITURE PER CHILD IN SCHOOL-AGE OF 5-14, 1919-58
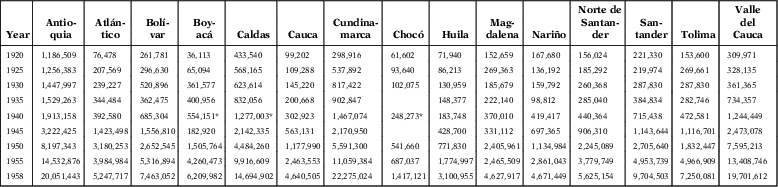
TABLE A2 TOTAL NATIONAL, DEPARTMENTAL AND MUNICIPAL PUBLIC EXPENDITURE ON EDUCATION, 1919–1958

Appendix 2. Departmental Incomes And Industrial Establishments In Selected Years
TABLE A3 DEPARTMENTAL INCOMES ACCORDING TO TOTAL POPULATION, 1915, 1930, AND 1950

TABLE A4 INDUSTRIAL ESTABLISHMENTS BY DEPARTMENT, 1936


