


Introduction
According to the National Health and Nutrition Examination Survey (NHANES, 2003–2006), 34% of adults in the United States meet the criteria for metabolic syndrome (MetS), a cluster of major cardiovascular risk factors related to obesity and insulin resistance.Reference Writing, Roger and Go 1 Obesity is one of the key risk factors in the development of MetS. Of the three most common chronic conditions associated with MetS – namely, hypertension, hypercholesterolemia and diabetes – 45% of adults are reported to have at least 1, 13% to have 2 and 3% to have all three conditions. Moreover, an estimated 15% of U.S. adults have one or more of these conditions without a diagnosis.Reference Fryar, Hirsch, Eberhardt, Yoon and Wright 2
Traditionally, research into the causes of obesity has focused on lifestyle factors in childhood and adulthood, but recently the role of pregnancy in fueling the obesity epidemic has begun to be recognized. The proportion of women who are obese has doubled since the 1960s. 3 In 2003, the prevalence of overweight and obese women reached 61.6%.Reference Thom, Haase and Rosamond 4 In the United States, almost one-third of women of reproductive age (20–39 years) are obese.Reference Huda, Brodie and Sattar 5 Furthermore, the prevalence of obesity in pregnancy in the United States ranges between 18.5 and 38.3%, and these rates continue to rise.Reference Galtier-Dereure, Boegner and Bringer 6 – Reference Lu, Rouse and DuBard 8
Epidemiological studies have shown that children born of pregnancies complicated by obesity are at increased risk of obesity and other features of MetS.Reference Catalano and Ehrenberg 9 After controlling for confounders, the relative risk of childhood obesity associated with maternal obesity in the first trimester of pregnancy has been found to increase two-fold at 2–3 years of age and 2.3-fold at 4 years.Reference Whitaker 10 MetS is more common in adolescents who were large-for-gestational-age at birth or who were born to obese mothers.Reference Boney, Verma, Tucker and Vohr 11 Maternal BMI was found to be one of the strongest predictors of excessive weight and obesity in sons at 18 years.Reference Koupil and Toivanen 12 Adults born to obese mothers were more insulin resistant than those born to nonobese mothers.Reference Mingrone, Manco and Valera Mora 13
Thus, maternal obesity is a significant factor contributing to increased risk of obesity in offspring. Although epidemiological studies provide important insight into the origins of obesity in humans, animal models remain essential for confirming the epidemiological associations, studying the mechanisms involved and developing novel therapies.
Multiple animal studies have shown that offspring born of pregnancies complicated by obesity are at increased risk of obesity, increased blood pressure (BP) and other features of MetS.Reference Catalano and Ehrenberg 9 – Reference Samuelsson, Matthews and Argenton 18 The mechanisms by which offspring develop cardiovascular disease have been linked to epigenetic changes, endothelial dysfunction, inflammation, oxidative stress, lipogenesis, nonalcoholic fatty liver disease, adipocyte hypertrophy, pancreatic abnormalities and alterations in hypothalamic satiety signaling.Reference Khan, Dekou and Douglas 16 , Reference Samuelsson, Matthews and Argenton 18 – Reference Suter, Ma and Vuguin 21
Brown adipose tissue (BAT) has recently emerged as a possible therapeutic target to counteract obesity and insulin resistance in humans. BAT is present in small amounts in the fetus. After birth, BAT is thought to be gradually replaced with white adipose tissue (WAT). However, recent data have demonstrated that adult humans have small (~50–100 g) BAT depots.Reference Persichetti, Sciuto and Rea 22 Moreover, in rodents and humans, WAT can undergo a process called ‘browning,’ in which brown or beige adipocytes appear within larger WAT depots.Reference Lo Kinyui and Sun 23 Brown and beige adipocytes are characterized by multilocular lipid droplets in adipocytes and an abundance of mitochondria-enriched with uncoupling protein 1 (UCP1). BAT and beige adipocytes in WAT may play an important role in nonshivering thermogenesis in humans.Reference Fenzl and Kiefer 24 Thermogenesis in UCP1-positive adipocytes can be stimulated by exposure to cold, β-adrenergic receptor agonists and diet. BAT activation can increase energy expenditure and alter fat and glucose metabolism in animals, including humans. Indeed, there is a significant negative relationship between increasing BMI and BAT volume in humans, supporting a putative role for BAT in human obesity. However, whether maternal obesity affects the function of BAT and browning of WAT in offspring has not been addressed. The objectives of this study were to determine the UCP1 expression and to investigate total and UCP1-dependent thermogenesis by using mitochondrial respiration as a proxy in BAT and visceral (VWAT) and subcutaneous (SWAT) white adipose tissue from mice offspring born to obese mothers.
Method
This work was performed in line with guidelines set out by the National Institutes of Health for the care and use of laboratory animals. The study protocol and all related procedures were reviewed and approved by the Animal Care and Use Committee at The University of Texas Medical Branch at Galveston, Texas. The mice were maintained in the animal care facility at The University of Texas Medical Branch. They were housed separately in temperature (22°C) and humidity-controlled quarters with constant light:dark cycles of 12 h:12 h. Animals were provided with food and water ad libitum. Mice were fed either a standard-fat diet (SF group, 5.8 g%; Teklad 7012: Harlan Teklad LM-485 Mouse/Rat Sterilizable Diet, Harlan Teklad, Madison, WI, USA) or a high-fat diet (HF group, 34.9 g%; D12492, Research Diets, Inc., New Brunswick, NJ, USA). The source of fat in the HF diet is lard, whereas the SF chow does not contain animal product; the source of fat in the SF show is soybean oil.
Study design
Female CD-1 mice were obtained from Charles River Laboratories at ~4–5 weeks of age. Animals were randomly assigned to either the SF-diet group (control mice, SF group) or to the HF-diet group (diet-induced obesity mice, HF group). After 3 months on the assigned diet, mice were mated with a CD-1 male, maintained on a standardized diet. Female mice randomized to the HF diet for 12–14 weeks weighed significantly more than those randomized to the SF group (HF 44.8 ± 1.7 g, n=11 v. SF 34.8± 1.0 g, n=16, P< 0.001). Therefore, we categorized HF-diet mothers as obese during the gestation period.
All pups were weighed at 1 day of age. During lactation, mothers were fed the diet they were originally assigned (i.e., SF or HF). At 21 days postpartum, offspring from all mothers were weaned onto a SF diet, containing 5.8 g% fat. At 6 months of age, both female and male offspring were studied for the manifestations of MetS.
Two additional cohorts of offspring obtained according to the protocol above were used for mitochondrial respirometry experiments and to determine UCP1 mRNA expression. In these cohorts, animals were sacrificed at 6 month of age, and BAT, SWAT and VWAT (including mesenteric, perirenal and gonadal fat) were collected. Tissues from one cohort were immediately transferred to an ice-cold preservation buffer and stored on ice as described previously.Reference Porter, Herndon and Bhattarai 25 Mitochondrial respirometry experiments were performed on this fresh tissue. Approximately 50–100 mg of collected tissues from the other cohort were immediately frozen in liquid nitrogen and stored in −80°C until further analysis for mRNA expression and protein levels.
In vivo telemetric BP measurement experiments
To implant the internal BP transducers, the mice were anesthetized with a mixture of ketamine (80–100 mg/kg, Ketalar, Parke-Davis, Morris Plains, NJ, USA) and xylazine (5–10 mg/kg, Gemini, Rugby, Rockville Center, NY, USA) as described previously.Reference Bytautiene, Tamayo and Kechichian 26 A vertical midline skin incision along the neck was made, and the submaxillary glands were gently separated. The left common carotid artery located next to the trachea was carefully isolated. The catheter (diameter 0.4 mm) was then introduced into the carotid artery through a small incision in the vessel wall, while the body of the transducer [PA-C10 model, Data Systems International (DSI), Overland Park, KS, USA) was secured in a subcutaneous pouch along the animal’s right flank through the same ventral neck incision. The neck incision was closed using 6-0 silk. Mice were kept warm on a heating pad and monitored closely until full recovery from anesthesia.
BP recordings of male and female offspring began 48–72 h after surgical implantation of the pressure transducer and were continuously monitored for 5 consecutive days using RLA 1020 telemetry receivers (DSI). The information was entered in the data acquisition and recording system, Dataquest software (A.R.T.3.1; Gartner Dataquest, Stamford, CT, USA). Then, the mice were sacrificed, and blood and tissues were collected for later analysis.
Serological studies
Glucose levels were measured in whole blood using a OneTouch Ultra, a blood glucose monitoring system (LifeScan, Wayne, PA, USA), after mice fasted overnight (16–18 h). Commercially available kits were used according to the manufacturer’s instructions to determine serum levels of cholesterol (Cayman, Ann Arbor, MC, USA), triglycerides (BioAssay Systems, Hayward, CA), insulin, leptin (both using magnetic bead MILLIPLEX map kit, catalog no. MBN2B-41K, minimum detectable concentration for insulin 14.4 pg/ml, leptin 4.4 pg/ml, Millipore, Billerica, MA, USA) and free fatty acids (BioVision, Mountain View, CA, USA).
RNA isolation and reverse-transcriptase reaction
BAT, SWAT and VWAT samples from each mouse were analyzed individually. Samples were homogenized utilizing the Bullet Blender from Next Advance (Averill Park, NY, USA). Total RNA was isolated using Trizol and Zymo RNA isolation kits (Ambion, Austin, TX, USA and Zymo Research Corporation, Irvine, CA, USA) according to manufacturers’ instructions. Quantification of RNA was performed by measuring the absorbance of RNA sample solutions at 260 nm. For the reverse transcription reaction, a High-Capacity cDNA Reverse Transcription Kit (Applied Biosystems, Foster City, CA, USA) was used according to the manufacturer’s instructions (25°C for 10 min→37°C for 120 min→85°C for 5 min→4°C for infinity).
Quantitative real-time PCR
mRNA expression of Ucp1 was quantified using TaqMan Gene Expression Assays (Mm01244861_m1, Life Technologies, Grand Island, NY, USA) according to the manufacturer’s instructions for quantitative real-time PCR performed in Real-Time PCR System 7500 Fast (Applied Biosystems). Gene expression was calculated as the mRNA of the targeted gene relative to β-actin mRNA levels (Mm00607939_s1, Life Technologies) in each specific sample (relative unit). Each reaction was carried out in triplicate. Relative quantification was determined using 7500 software, Version 2.06 (Applied Biosystems).
Western blot analysis
Proteins from BAT, SWAT and VWAT were extracted after homogenization in a radio-immunoprecipitation assay buffer with freshly added protease inhibitor cocktail and phenylmethylsulfonyl fluoride and were quantified using the BCA Protein Assay kit (Pierce, Rockford, IL, USA). The protein extracts were electrophoretically separated by SDS/PAGE on a 4–15% running gel, transferred to polyvinylidene difluoride membranes, blocked and incubated overnight with primary polyclonal antibodies detecting UCP1 (1:500 dilution, 32 kDa, ab10983, Abcam Inc., Cambridge, MA, USA). The blots were then incubated for 1 h at room temperature with a rabbit peroxidase-labeled antibody (1:10,000 dilution, NA934VS, GE, Pittsburgh, PA, USA). The bands were then exposed using the Luminata Crescendo Western HRP Substrate (Millipore) and captured on autoradiography film. The obtained bands were scanned and analyzed using ImageJ 1.42q software (NIH). Band signal intensity was measured by densitometry, and intensity values for the UCP1 were normalized against those for β-actin (42 kDa, 1:20,000, Sigma-Aldrich, St. Louis, MO, USA).
Mitochondrial respirometry
The mitochondrial respiratory function was determined in digitonin-permeabilized adipose tissue samples on the same day of sample collection. Tissue respiratory rates were quantified using an Oroboros Oxygraph-O2K™ respirometer as detailed previously with minor modifications.Reference Porter, Herndon and Bhattarai 25 , Reference Porter, Hurren and Cotter 27 In brief, respiration in the leak state was achieved after titration of pyruvate (5 mm), octanoyl-L-carnitine (0.07 mm), malate (2 mm) and glutamate (10 mm) into the O2K-chamber. Total leak respiration was determined before and after the addition of the UCP1 inhibitor guanosine diphosphate (GDP, 20 mM). The reduction in respiration after GDP titration is equal to UCP1-dependent thermogenesis. This approach represents a direct quantification of UCP1 function.Reference Cannon and Nedergaard 28 – Reference Shabalina, Petrovic and de Jong 35
Data analysis
Systolic and diastolic BP data for each animal were obtained from the telemetry system as a 24-h average for the last 4 days of the recording period. Then, the overall average for each mouse was calculated, and data were analyzed using the GraphPad Prism 5 software version 5.04 for Windows (GraphPad Software, La Jolla, CA, USA). All other results were expressed as the mean±s.e.m. and compared between the groups. For statistical analyses, a Student’s t-test and Mann–Whitney test were applied as appropriate (GraphPad Prism 5). A probability value (P value) of ⩽0.05 was considered statistically significant.
Results
A mouse model of developmental MetS
Maternal characteristics before and during pregnancy
Compared with female SF mice, the HF group gained significantly more weight during the 3-month pre-pregnancy period (HF 44.8 ± 1.7 g v. SF 34.8± 1.0 g, P<0 .001) and had significantly higher cholesterol levels (HF −172.6 ± 15.4 mg/dl, n=6, v. SF 98.0 ± 18.0 mg/dl, n=7, P=0.01).
Offspring characteristics at 6 months of age (adulthood)
The developmental programming of MetS was characterized in 1–2 offspring randomly selected from each litter. The results are shown in Table 1. Males and females born to obese mothers were significantly heavier (P=0.03 and P=0.04, respectively) and had a significantly higher percentage of VWAT (P=0.03 and P=0.02, respectively) than their counterparts born to SF mothers.
Table 1 Offspring characteristics at 6 months of age

SF, standard fat; HF, high fat; BP, blood pressure.
Mean±s.e.m. (number of mice).Statistically significant P values are denoted in bold.
a Statistically significant differences.
Systolic and diastolic BP in males (P=0.04 and P=0.03, respectively) and females (P=0.0001 and P=0.02, respectively) born to obese mothers were significantly higher than in offspring of control dams.
Exposure to maternal pre-pregnancy obesity led to significantly higher levels of fasting glucose (P=0.007), total cholesterol (P=0.01), triglycerides (P=0.02), free fatty acids (P=0.03) and leptin (P=0.0002) in males, compared with those born to SF mothers. In HF female offspring, significantly higher levels of cholesterol (P=0.04), leptin (P=0.02) and insulin (P=0.04) were determined.
Collectively, in this model of maternal obesity, offspring from obese mothers exhibited indicators of MetS – obesity, dyslipidemia and elevated BP – at 6 months of age. The development of some of the metabolic parameters was also sex specific.
UCP1 mRNA expression, protein levels, thermogenesis
In BAT, UCP1 mRNA levels were not different between the groups (Fig. 1a). UCP1 protein levels were significantly higher in BAT from HF males (P=0.04) and HF females (P=0.04) when compared with SF (Fig. 1b and 1c). Total leak respiration and UCP1-dependent respiration were significantly higher in BAT from HF males (P=0.005, P=0.02, respectively) and HF females (P=0.02, P=0.01, respectively) when compared with SF (Fig. 2a and 2b).

Fig. 1 (a) Uncoupling protein 1 (UCP1) mRNA [for both sexes standard fat (SF)=6, high fat (HF)=5], (b) protein levels (SF males n=3, HF males n=5, SF females n=5, HF females n=3) and (c) Western (for both sexes SF n=5, HF n=6) blots in brown adipose tissue from offspring at 6 months of age born to control (SF) and obese (HF) mice. Values are presented as mean±s.d. RQ, relative quantification.
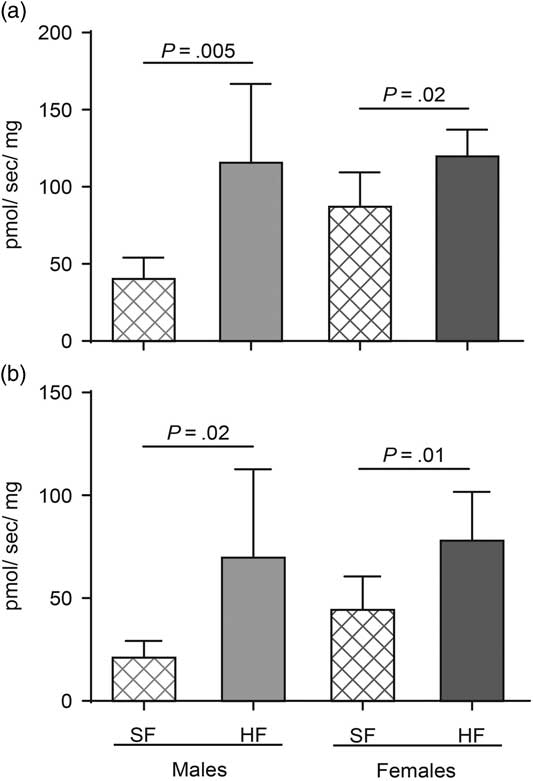
Fig. 2 (a) Total leak respiration (n=6 in each group) and (b) uncoupling protein 1 (UCP1)-dependent respiration [standard fat (SF) males n=6, high fat (HF) males n=7, SF females n=7, HF females n=7] in brown adipose tissue from offspring at 6 months of age born to control (SF) and obese (HF) mice. Values are presented as mean±s.d.
In subcutaneous adipose tissues (SAT), UCP1 mRNA expression was not different between the offspring born to HF and SF mothers (Fig. 3a). UCP1 protein levels were significantly lower in HF females (P=0.03, Fig. 3b and 3c) when compared with SF females. The total leak respiration was not different between the groups (Fig. 4a). UCP1-dependent thermogenesis in SAT was significantly lower only in HF males (P=0.04, Fig. 4b) when compared with SF group.

Fig. 3 (a) Uncoupling protein 1 (UCP1) mRNA [standard fat (SF) males n=4, high fat (HF) males n=3, SF females n=5, HF females n=3], (b) protein levels (SF males n=4, HF males n=3, SF females n=4, HF females n=5) and (c) Western blots (for both sexes SF n=5, HF n=6) in subcutaneous adipose tissue from offspring at 6 months of age born to control (SF) and obese (HF) mice. Values are presented as mean±s.d. RQ, relative quantification.

Fig. 4 (a) Total leak respiration [standard fat (SF) males n=5, high fat (HF) males n=8, SF females n=6, HF females n=8] and (b) Uncoupling protein 1 (UCP1)-dependent respiration (SF males n=4, HF males n=6, SF females n=6, HF females n=8) in subcutaneous adipose tissue from offspring at 6 months of age born to control (SF) and obese (HF) mice. Values are presented as mean±s.d.
In VWAT, UCP1 mRNA was not different between the groups (Fig. 5a). And UCP1 protein levels were significantly lower in HF females (P=0.03, Fig. 5b and 5c). Total leak respiration did not differ between the offspring groups (Fig. 6a). UCP1-dependent thermogenesis was significantly lower in HF females (P=0.04, Fig. 6b), with no differences between male groups.

Fig. 5 (a) Uncoupling protein 1 (UCP1) mRNA [standard fat (SF) males n=5, high fat (HF) males n=5, SF females n=5, HF females n=4], (b) protein levels (SF males n=5, HF males n=5, SF females n=4, HF females n=4) and (c) Western blots (for both sexes SF n=5, HF n=6) in visceral white adipose tissue from offspring at 6 months of age born to control (SF) and obese (HF) mice. Values are presented as mean±s.d. RQ, relative quantification.

Fig. 6 (a) Total leak respiration [standard fat (SF) males n=7, high fat (HF) males n=9, SF females n=5, HF females n=7] and (b) uncoupling protein 1-dependent respiration (SF males n=7, HF males n=8, SF females n=5, HF males n=5) in visceral white adipose tissue from offspring at 6 months of age born to control (SF) and obese (HF) mice. Values are presented as mean±s.d.
Discussion
Our study confirmed the development of MetS in 6-month-old offspring born to obese mothers, despite being fed a regular diet after weaning. We determined that in adulthood, BAT thermogenic capacity is significantly modified by maternal obesity. UCP1 protein levels in BAT correspond with the direction of UCP1-dependent thermogenesis. Interestingly, the mRNA signal for UCP1 was not different between groups, suggesting that mRNA is a poor proxy of UCP1 protein and function in long-term studies. Prenatal obesity had a much less pronounced effect of UCP1 levels and function in WAT. In SWAT and VAT, alterations in thermogenesis and UCP1 protein levels were sex dependent. Overall, our data indicate that the thermogenic capacity of BAT is altered in the offspring of obese mothers.
Multiple animal studies have shown that offspring born of pregnancies complicated by obesity are at increased risk of obesity and other features of MetS.Reference Catalano and Ehrenberg 9 – Reference Samuelsson, Matthews and Argenton 18 , Reference Elahi, Cagampang and Mukhtar 36 Similarly, in our model, offspring born to obese mothers were significantly heavier and had a significantly higher percentage of adipose tissue compared with mice born to nonobese mothers, despite being fed a regular-fat diet after weaning. In line with previous reports, we demonstrated sex-related cardiovascular dysfunction in this study. Systolic and diastolic BPs in females and systolic BP in males were significantly higher in mice born to obese mothers. Exposure to maternal obesity led to significantly higher levels of fasting glucose, triglycerides, free fatty acids and leptin in males exposed to maternal obesity, compared with those born to normal-weight mothers. In female offspring born to obese mothers, significantly higher levels of cholesterol, leptin and insulin were found. Thus, by 6 months of age, offspring exhibited indicators of MetS – obesity, dyslipidemia and elevated BP – if their mothers were obese before pregnancy, indicating the suitability of the model to study the developmental programming of MetS. Moreover, in line with other models of developmental MetS, our mouse model exhibited gender differences.
Several animal models have been used to investigate BAT function in offspring. Maternal caloric-, protein- or food-restricted diets during pregnancy have led to a reduction in the expression of UCP1 and depression of the thermogenic capacity in BAT and negatively affected the browning of WAT in offspring.Reference Watkins, Lucas, Wilkins, Cagampang and Fleming 37 – Reference Priego, Sanchez, Garcia, Palou and Pico 40 Others have reported increased UCP1 expression in late-gestation ovine fetuses after prenatal exposure to hypoxia.Reference Myers, Hanson, Mlynarczyk, Kaushal and Ducsay 41 Overfeeding rodents in the first few weeks of life have resulted in lower levels of UCP1 and changes in BAT structure in adulthood.Reference de Almeida, Fabricio and Trombini 42 , Reference Xiao, Williams and Grayson 43 Supplementation of obese ewes with larginine has led to a significant increase in fetal BAT, among other metabolic improvements, while maternal diet supplementation with olive oil, protein or fiber has increased UCP1 expression in the BAT of rat pups.Reference Priego, Sanchez, Garcia, Palou and Pico 40 , Reference Carey Satterfield, Dunlap, Keisler, Bazer and Wu 44 , Reference Maurer and Reimer 45 Only one of these studies reported gender differences in UCP1 expression.Reference Watkins, Lucas, Wilkins, Cagampang and Fleming 37 Ours is the first study to demonstrate that UCP1-dependent mitochondrial thermogenesis and UCP1 levels are altered in offspring born to obese mothers, regardless of being fed a regular diet postnatally. Thus, in the current study, we fill an important knowledge gap regarding offspring’s BAT function after exposure to maternal obesity. All the aforementioned studies, including our own, provide evidence that the in utero environment plays an important role in the development of BAT and its function in offspring.
An intriguing result in our current study is the higher levels of UCP1-dependent mitochondrial thermogenesis and UCP1 protein expression in the BAT of offspring born to obese mothers when compared with controls. We hypothesize that this increased nonshivering thermogenesis in BAT is a counteractive process against obesity in offspring. However, what is most interesting is that while both male and female offspring exposed to prenatal obesity developed BAT with greater UCP1 levels and thermogenic function, these animals were still bigger, had a greater fat mass percentage, were hypertensive, and had altered systemic lipid metabolism when compared with control animals. Thus, while increased BAT function in animals exposed to prenatal obesity may be a countermeasure to prevent adiposity, it is a response that falls short of being fully successful. That said, it does not mean that the increase in BAT thermogenic capacity seen here is not physiologically significant. However, these data do suggest a disassociation between BAT function and metabolic health in this model.
Although exposure to prenatal obesity had a large impact on BAT UCP1 function in both male and female offspring, we observed a far less pronounced effect in white adipose depots. There was a sexual dimorphism in the response of SAT and VAT to prenatal obesity in terms of UCP1 protein levels, where maternal obesity reduced UCP1 protein in female but not male offspring. However, this effect only translated to lower UCP1 function in VAT in female offspring. Moreover, in SWAT, we found that UCP1-dependent thermogenesis, but not UCP1 protein levels, were modified in males exposed to prenatal obesity. Importantly, it should be noted that UCP-dependent thermogenesis was ~50–100-fold greater in interscapular BAT v. SWAT or VWAT. Indeed, a clear concordance between UCP protein levels and UCP-dependent thermogenesis was seen in BAT only. It may be that the vastly lower levels of UCP1 and capacity for UCP1-dependent respiration in WAT depots compared with BAT may limit our ability to demonstrate clear associations between UCP1 abundance and function in WAT depots. We found no difference in UCP1 gene expression in any of white fat depots investigated, while UCP1 protein levels were differentially regulated. These findings raise the possibility that UCP1 translation is epigenetically regulated and that exposure to maternal obesity induces negative translational regulation, mediated by miRNAs in the offspring’s BAT and WAT. Micro-RNAs are short (~20–23 nucleotides in length) endogenous noncoding RNA molecules that inhibit translation. It had been established that multiple miRNAs are involved in the development and differentiation of adipose tissue, including BAT and BWAT.Reference Arias, Aguirre and Fernandez-Quintela 46 , Reference Guller, McNaughton and Crowley 47 Another explanation could be as follows – increased thermogenic capacity in BAT brought about by chronic cold exposure first causes a big increase in UCP1 mRNA, which is eventually is caught up by higher UCP1 protein. So, perhaps we are looking at the wrong time point to see differences in UCP1 mRNA. That said, UCP1 mRNA does not produce heat, only the protein does and we observed significant differences in BAT UCP1 protein and function in the current study, despite an absence in mRNA levels.
Several limitations of our study should be acknowledged. We investigated only one age group – the adult mice. We did not evaluate homeostasis model assessment of insulin resistance (HOMA-IR) since fasting glucose and insulin were not measured in the same animals. We did not expose our mice to a cold temperature or to β-adrenergic receptor agonists, which are known to induce nonshivering thermogenesis, though it has been shown that an animal house temperature of 22°C is significantly below the mouse thermoneutral temperature (28–30°C).Reference Cannon and Nedergaard 29 , Reference Quevedo, Roca, Pico and Palou 48 Also, the question of whether altered thermogenesis in BAT is a consequence of exposure to maternal obesity or a consequence of the offspring’s own obesity needs to be answered in the future. Moreover, teasing out the effects of obesity v. high-fat diet exposure during pregnancy, during gestation and lactation needs to performed.
Our study offers proof of concept that UCP1 protein levels and function are altered in BAT (and to a lesser degree WAT) of offspring exposed to prenatal obesity. With increasing interest in BAT as a possible therapeutic target to counteract obesity and MetS, we have demonstrated that an in utero environment could represent a critical window to modify BAT function.
Financial Support
Funding for this study was provided by the Shriner’s Hospital for Children grants 84090, 85310 and 85410; NIH/NICHD grant K12HD052023; and the Department of Surgery, UTMB.
Conflicts of Interest
None.
Ethical Standards
The authors assert that all procedures contributing to this work comply with the ethical standards of the relevant national guides on the care and use of laboratory animals (National Institutes of Health) and have been approved by the institutional committee (the Animal Care and Use Committee at The University of Texas Medical Branch at Galveston, Texas).
Acknowledgments
Language editing and figure layout assistance were provided by the Publication, Grant, and Media Support Office funded by the Department of Obstetrics & Gynecology at The University of Texas Medical Branch at Galveston.


