Introduction
Laser-induced breakdown spectroscopy (LIBS) is a powerful and a versatile diagnostic technique, based on optical emission spectroscopy, for the elemental analysis of all the states of matter; solids (Sturm et al., Reference Sturm, Peter and Nol2000), liquids (Michel et al., Reference Michel, Lawrence-Snyder, Angel and Chave2007), gases (Hanafi et al., Reference Hanafi, Omar and Gamal2000) including aerosol (Hahn and Lunden, Reference Hahn and Lunden2000) biological and environmental samples (Wainner et al., Reference Wainner, Harmon, Miziolek, Mcnesby and French2001). In this technique, a high-power laser energy is focused on the target sample, which ablates the material, increases the temperature of the target material rapidly, and generates plasma on the sample surface. The plasma expands rapidly along the direction perpendicular to the target surface and its emission spectrum is recorded using a high-resolution spectrometer for further analysis. LIBS is advantageous over the other analytical techniques such as non-sample preparation, ability to detect all elements in real time, non-destructive, readily portable to the field, and ability to analyze sample in air. The disadvantage of LIBS is its low sensitivity, which requires improvement in the system to detect elements in a sample more precisely. The limit of detection in LIBS is about at ppm level, changes significantly from element to element and also depends on the matrix of the sample. For improvement in the sensitivity of LIBS, several methods such as ultra-short pulse and dual-pulse LIBS have been reported (Stratis et al., Reference Stratis, Eland and Angel2000; Scaffidi et al., Reference Scaffidi, Pearman, Carter and Angel2006; Ahmed et al., Reference Ahmed, Iqbal and Baig2015; Ahamer and Pedarnig, Reference Ahamer and Pedarnig2018).
In the last few years, it has been proposed that an applied magnetic field can be used to confine the laser-generated plasma which controls the properties of the short-lived and energetic plasma. The laser-generated plasma in the presence of magnetic field reveals a number of phenomena, including conversion of the laser energy into thermal energy (Pandey and Thareja, Reference Pandey and Thareja2011), confinement of plasma plume (Neogi and Thareja, Reference Neogi and Thareja1999), Joule heating effect (Shen et al., Reference Shen, Lu, Gebre, Ling and Han2006), enhancement in the emission intensity (Singh and Sharma, Reference Singh and Sharma2017), plasma instabilities, and many more (Mason and Goldberg, Reference Mason and Goldberg1991; Diwakar and Hahn, Reference Diwakar and Hahn2008; Amin et al., Reference Amin, Bashir, Anjum, Akram, Hayat, Waheed, Iftikhar, Dawood and Mahmood2017). The signal intensity enhancement in the presence of applied magnetic field can be related to the confinement of the laser-generated plasma (Singh and Sharma, Reference Singh and Sharma2016). In the absence of the magnetic field, the plasma grows and expands into the surroundings (Griem, Reference Griem1964) and this expansion and growth stops when a magnetic field is applied because the magnetic force experienced by the charged particles execute a helical loop or orbit about an axis in the direction of the magnetic field. The magnetic confinement results in the conversion of the plasma kinetic energy into the thermal energy (Pandey and Thareja, Reference Pandey and Thareja2011), which increases the electron number density and hence the recombination rate. Griem (Reference Griem1964); Rai et al. (Reference Rai, Shukla and Pant1999, Reference Rai, Rai, Yueh and Singh2003); De Giacomo et al. (Reference De Giacomo, Dell'Aglio, De Pascale, Longo and Capitelli2007) studied the magnetic field confinement effect on the metal alloy samples in air and achieved a maximum enhancement factor of 2. Harilal et al. (Reference Harilal, Tillack, Shay, Bindhu and Najmabadi2004) studied the aluminum plasma in the presence of external magnetic field and observed enhancement in the emission intensity of (Al2+) ions with magnetic field while emission intensity of singly (Al+) and neutral (Al) species reduced considerably. Shen et al. (Reference Shen, Lu, Gebre, Ling and Han2006) observed an enhancement in the emission lines of Al and Cu using 0.8 T magnetic field, whereas Co target showed a decreasing trend in the emission intensity. It was suggested that the emission intensity of Al and Cu plasma was enhanced due to magnetic confinement which resulted in the increase of electron number density. They further reported that the persistent time of Co plasma is ten times short as compared to a non-ferromagnetic target in the presence of magnetic field and hence the density of the excited Co atoms decreases rapidly without any significant confinement. Rafique et al. (Reference Rafique, Khaleeq- ur- Rahman, Riaz, Jalil and Farid2008) reported that the rate of recombination increases due to the plasma confinement in the applied magnetic field which results in the emission intensity enhancement. Roy et al. (Reference Roy, Harilal, Hassan, Endo and Mocek Tand Hassanein2015) reported the effect of magnetic field on the dynamics of the laser-induced tin plasma and reported signal enhancement of the ionic lines in the presence of magnetic field while the intensities of the neutral lines remain unaltered. We have already reported an improvement in the limit of detection of Cr in soil samples by externally applied magnetic field (Akhtar et al., Reference Akhtar, Jabbar, Mehmood, Ahmed, Ahmed and Baig2018).
Lead is a bright silvery and slightly bluish dense toxic metal with low melting point and ductility to oxidation (Teo et al., Reference Teo, Goh, Ahuja, Ng and Poon1997). These properties, combined with its relative high abundance and low cost, make it very useful for constructions, plumbing, batteries, weight, solders, white paint, leaded gasoline, and radiation shielding (Thurmer et al., Reference Thurmer, Williams and Robey2002). Here lead is focused because the presence of lead in soil is very harmful for environment and living organisms. More than 200 000 tons of lead is released per year from vehicles exhausts (Goyer, Reference Goyer1990). Major quantity of the shattered lead is consumed by plants, soil, and rest is flowed into the water bodies. Moreover, human bodies are exposed to lead due to its presence in food and drinking water, which mainly comes from the pollutant environment and industrial wastes. Lead is a heavy metal, found as a trace element in the polluted soils, and is difficult to detect using conventional LIBS technique. Therefore, the sensitivity of LIBS needs to be improved and one of such option is to use external magnetic field.
In this contribution, we have studied in detail the effects of external magnetic field on the laser-produced lead plasma. The dependence of the magnetic confinement on the strength of an external magnetic field and laser pulse energy has been investigated. It is proposed that, the magnetic confinement of the laser-generated lead plasma can be achieved by optimizing the laser irradiance and the strength of the external magnetic field. The aim of the present work is to optimize experimental conditions for the laser-produced lead plasma to investigate the presence of lead and other heavy metals in the soil/environmental samples in future using these optimized parameters.
Experimental setup
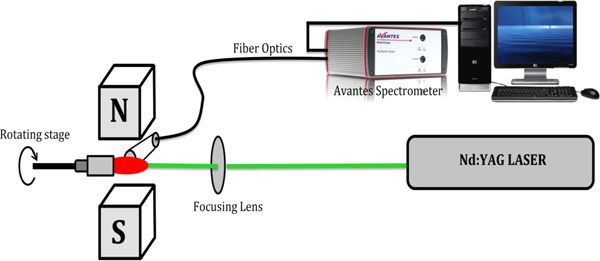
A schematic diagram of the experimental set up (Ahmed et al., Reference Ahmed, Umar, Ahmed and Baig2017, Reference Ahmed, Ahmed and Baig2018a, Reference Ahmed, Ahmed, Umar, Liaqat, Manzoor and Baig2018b; Akhtar et al., Reference Akhtar, Jabbar, Mehmood, Ahmed, Ahmed and Baig2018) used in the present work is shown in Figure 1. The laser-produced lead plasma was generated by employing a Q-switch Nd: YAG laser (Brilliant B, Quantel, France) capable of delivering 400 mJ at 532 nm, 5 ns pulse width, and 10 Hz repetition rate. The laser energies for different experiments were measured using an energy meter (Nova-Quintal, France). Pure metallic lead (99.5%) target was placed on a rotatable sample holder to avoid deep crater formation. A 10 cm focal length convex lens was used to focus the laser beam on the surface of the target placed in air. The diameter of the spot size was measured by placing an IR detector paper in front of the laser beam which was about 1 mm. To avoid air breakdown, the distance between the target and the focusing lens was kept less than the focal length (f = 10 cm). Two magnets, having 2.54 cm diameters, were placed in a holder to apply the magnetic field perpendicular to plasma plum and the sample was placed at the center of the magnets, separated by 2 cm. A Gauss meter was used to measure the magnetic field strength at the center of the two magnets.

Fig. 1. Schematic experimental set up for the study of magnetic effect on the laser-produced lead plasma.
The strength of the magnetic field was varied by using different permanent magnets. In order to apply a uniform magnetic field on the laser-produced lead plasma, we have mounted the sample at the center of two magnets. The plasma radiation was collected by a lens attached with an optical fiber (high-OH, core diameter 600 µm). The detection system consists of four spectrometers (AvaSpec-3648) each having a slit width of 10 µm and covers the spectral range from 250 to 870 nm. The resolution of the detection system was measured as 0.06 nm at 500 nm using a narrow line width dye laser. In the present work, laser energy is varied from 70 to 390 mJ and the magnetic field was varied as 0.3, 0.5, and 0.7 T. After optimizing the laser energy at 130 mJ and the applied magnetic field of 0.7 T, the time delay and the distance from the target were varied one by one to study their effect on the optical emission of lead plasma.
Result and discussion
The magnetic field effect on the lead plasma
Emission intensity
Initially, the emission spectrum of Pb was registered at the laser energy of 130 mJ (laser irradiance ~ 3 GW/cm2) and at laser energy 270 mJ (6.9 GW/cm2) while the sample was placed in air at atmosphere pressure and no external field was applied. The optical emission spectrum of Pb showed all the neutral spectral lines of Pb I at 357.27, 363.95, 368.34, 373.99, and 405.78 nm and singly ionized spectral lines of Pb II at 424.49, 438.65, 560.89, and 666.0 nm. The emission spectrum of Pb was also recorded in the presence of a magnetic field of different strengths at the same laser irradiances. A comparison of the emission spectrum with and without the varying magnetic fields of 0.3, 0.5, and 0.7 T are presented in Figure 2a, 2b. The signal intensity enhancements in the presence of magnetic field (0.3, 0.5, and 0.7 T) in the neutral lead lines at 357.27, 363.95, 368.34, 373.99, and 405.78 nm is evident in Figure 2a. The experiment was repeated with the same values of magnetic fields (0.3, 0.5, and 0.7 T) at laser irradiance 6.87 GW/cm2 as shown in Figure 2b. The emission spectra show significant signal enhancement as the applied magnetic field is increased from 0.3 to 0.7 T.
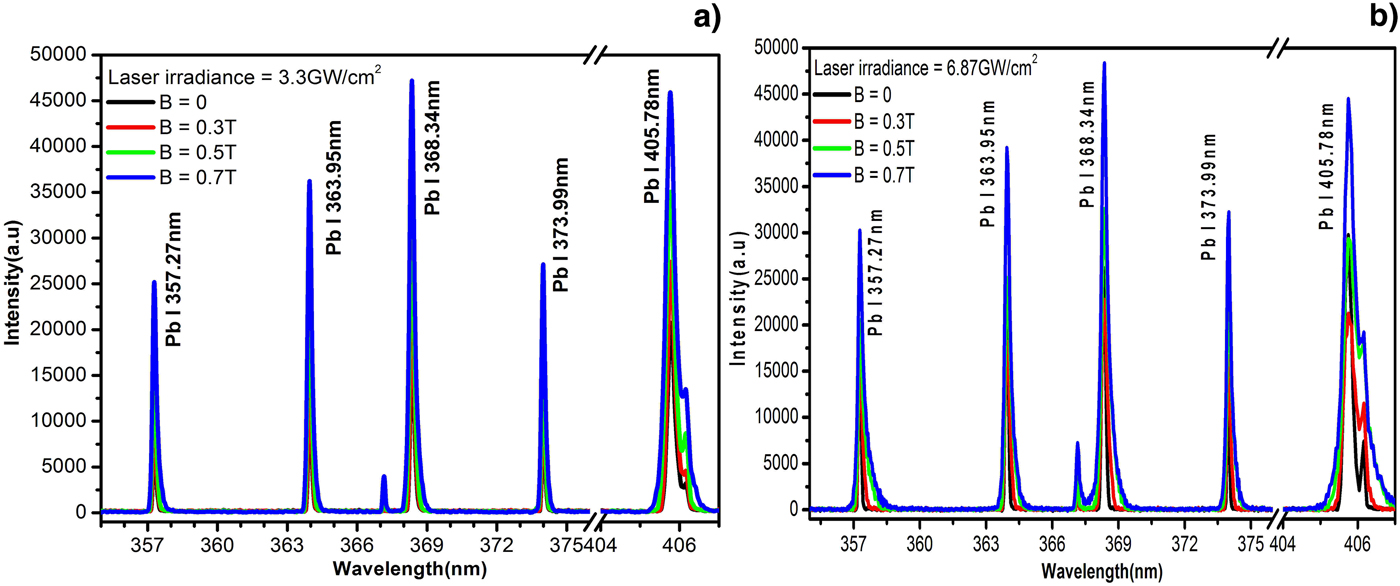
Fig. 2. Optical emission spectra of lead covering wavelength range 355–407 nm with varying magnetic field, (a) with laser irradiance ~3.3 GW/cm2 and (b) with laser irradiance 6.9 GW/cm2.
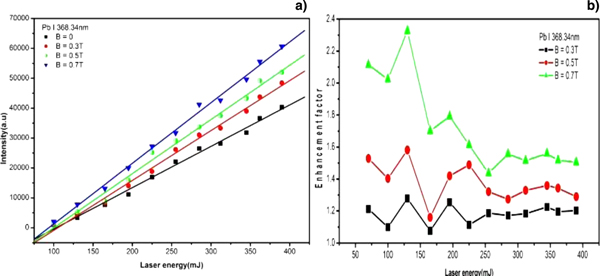
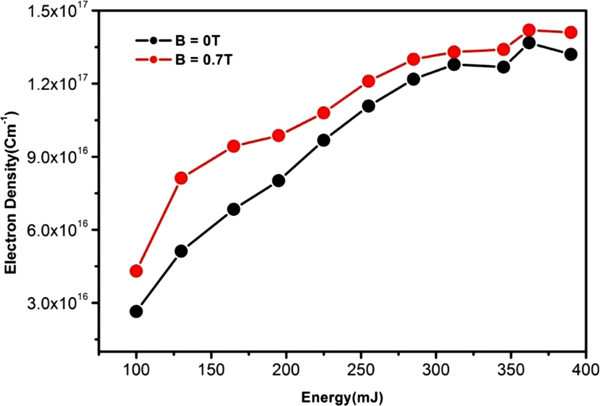
The variations in the emission intensity of Pb I 386.34 nm at variable laser energies and magnetic fields are presented in Figure 3a. Evidently, the intensities of the spectral lines increase with increasing laser energy as well as with magnetic fields. The intensities of the emission lines significantly increase in the presence of magnetic field as compared with that without the magnetic field.

Fig. 3. (a) Signal intensity enhancement of Pb I 368.34 nm line with and without applied magnetic field, (b) variation of enhancement factor with laser energy at variable magnetic fields.
To get an optimized value of the laser energy for maximum emission intensity enhancement, we varied the laser energies from 50 to 390 mJ and recorded the enhancement factor for the 388.34 nm line at 0.3, 0.5 and 0.7 T, shown in Figure 3b. It is observed that the enhancement factor is maximum at 130 mJ laser energy and decreases with increasing laser energy. The enhancement factor remains almost the same from 250 to 390 mJ laser energy. It can be assumed that the thermal pressure of plasma increases with increasing laser energy, which may affect the magnetic confinement of the laser-generated plasma.
In Figure 4, we present the enhancement factor of the ionic line of Pb II at 424 nm that is also maximum at 130 mJ laser energy and it drops sharply afterwards with increasing laser energy. The enhancement factor almost remains the same from 250 to 390 mJ laser energy. From Figures 3b and 4, it can be concluded that the enhancement factor is different in the neutral and the ionized spectral lines under identical experimental conditions. The observed enhancement in the emission lines of ionized species is much higher than that for the neutral lines. It shows that the spectral line enhancement depends on the plasma dynamics and confinement of the species as well as the excitation properties of the sample (Shen et al., Reference Shen, Lu, Gebre, Ling and Han2006).

Fig. 4. The variation of enhancement factor of Pb II spectral line with laser energy in the presence of magnetic field.
Plasma temperature
In laser-generated plasma, the plasma temperature is an important parameter for plasma diagnostics through optical emission spectroscopy. The plasma temperature can be calculated from the intensities of the observed spectral lines with an assumption that the populations of the excited levels follow Boltzmann distribution. The plasma temperature was estimated from the Boltzmann plot using the relative intensities of the emission lines of Pb I, considering that the plasma is optically thin and is close to local thermo-dynamical equilibrium (LTE). The spectroscopic data of lead lines used in constructing the Boltzmann plot are listed in Table 1. The Boltzmann plot was drawn using the relation: (Griem, Reference Griem1997; Harilal et al., Reference Harilal, Bindhu, Nampoori and Vallabhan1998a; Dawood et al., Reference Dawood, Bashir, Akram, Hayat, Ahmed, Iqbal and Kazmi2015).
 $$\ln \left( {\displaystyle{{{\rm \lambda}_{{\rm nm}}I_{{\rm nm}}} \over {g_{{\rm nm}}A_{{\rm nm}}}}} \right) = \; -\displaystyle{{E_{\rm m}} \over {k_{\rm B}T_{\rm e}}}\; + \ln \left( {\displaystyle{{N\; (T)} \over {U\; (T)}}\;} \right)$$
where, I mn, λmn, A mn is the intensity, wavelength, and transition probability, respectively, E m and g m represent the energy of the upper state, statistical weight, T e, U(T), and N(T) are the plasma temperature, partition function, total number density, respectively, and K is the Boltzmann constant.
Table 1. The spectroscopic data of Pb spectral lines taken from NIST database

To construct the Boltzmann plot and to deduce the plasma temperature, five lines of lead at 280.19, 357.27, 363.98, 368.34, and 373.99 nm were selected and their spectroscopic data are presented in Table 1, taken from NIST database (http://physics.nist.gov/PhysRefData/ASD/lines_form.html).
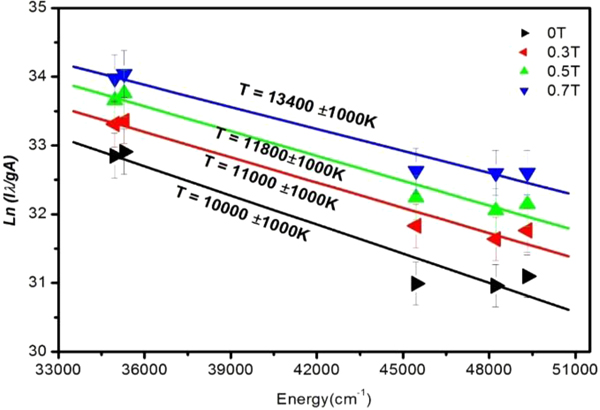
A plot of the upper state energies E m versus ln (λmn I mn/g m A m) yields a straight line with a slope equal to −1/kT. Boltzmann plots based on the spectral line's intensities observed in the absence and in the presence of 0.3, 0.5 and 0.7 T magnetic field are shown in Figure 5. Evidently, the excitation temperature is highest at the highest applied magnetic field and decreases as the field strength is decreased, lowest in the absence of the magnetic field.

Fig. 5. Typical Boltzmann plots at different magnetic fields.
Figure 6 represents plots of plasma temperatures estimated at different laser energies (115,130, 195, and 270 mJ) against the applied magnetic field. Evidently, the plasma temperature increases with increasing laser energy. The plasma temperatures were calculated as (9750 ± 1000) K, (9900 ± 1000) K, (10 200 ± 1000) K and (11 200 ± 1000) K for 115, 130, 195, and 270 mJ laser energies, respectively, with no magnetic field. The plasma temperatures were also calculated in the presence of external magnetic field. At 0.3 T magnetic field, the plasma temperatures were deduced as (10 600 ± 1000) K, (10 900 ± 1000) K, (11 400 ± 1000) K, and (12 500 ± 1000) K, whereas at 0.7 T, the temperatures were calculated as (12 200 ± 1000) K, (12 800 ± 1000) K, (13 300 ± 1000) K, and (14 000 ± 1000) K using 115, 130 195, and 270 mJ laser energies, respectively. Evidently, the plasma temperature increases linearly in the presence of magnetic field. An increase in the plasma temperature is attributed to the Joule heating effect (Harilal et al., Reference Harilal, Tillack, Shay, Bindhu and Najmabadi2004).

Fig. 6. Temperature variations at different magnetic field strengths and at 115, 130, 195, and 270 mJ laser energies.
Electron number density
Electron number density is another important parameter to characterize the laser-generated plasma that can be calculated from the observed full width at half maximum (Δλ1/2) of an isolated Stark broadened line profile. The experimentally observed Δλ1/2 is related to the electron number density through the following equation (Griem, Reference Griem1997; Borgia et al., Reference Borgia, Burgio, Corsi, Fantoni, Pallechi, Salvetti, Squarcialupi and Togoni2000).
 $$N_{\rm e} = \left( {{\bi \;} \displaystyle{{\Delta {\rm \lambda}_{1/2}} \over {2{\rm \omega}}}} \right) \times N_{\rm r}$$
Where ω is the Stark broadening parameter, N r is the reference electron number density which is 1016/cm3 for the neutral lines and 1017/cm3 for the singly ionized lines. The electron number density is estimated using the Pb I line at 368.34 nm. The impact parameter ω for this line is reported by Alonso-Medina (Reference Alonso-Medina2008). It is very important that the lines selected for the determination of plasma temperature and electron number density should be optically thin, free from self-absorption and well separated from the other lines (Griem, Reference Griem1997; Hutchinson, Reference Hutchinson2002). The width of a spectral line can be extracted by fitting the emission line profile with a Voigt function which considers the Lorentzian and Gaussian contributions. The instrumental line width of our spectrometer is about (0.06 ± 0.01) nm. We have neglected the Doppler broadening in the present case as the estimated plasma temperature is considerably high. Moreover, the Zeeman Effect may be produced in the presence of an external magnetic field. The ratio of the Stark Effect produced in the presence of electric field to the Zeeman Effect by the applied magnetic field is related as τ = 3/2 nA o (Lochte-Holtgreven, Reference Lochte-Holtgreven1995; Singh and Sharma, Reference Singh and Sharma2016), where A o = 3.43 × 10⁻⁷(N e)2/3/B (gauss), and n is the principle quantum number. The estimated value of τ is greater than one for the Pb-I (368.34 nm) emission line and the electron number density is estimated as 5.5 × 10¹⁶/cm3 at 0.7 T. This implies that the Zeeman Effect is negligible in our case. The FWHM is determined using the following relation (Galmed and Harith, Reference Galmed and Harith2008; Singh and Sharma, Reference Singh and Sharma2016):
 $$\Delta {\rm \lambda} _{1/2} = \lsqb {{\rm \omega}_{\rm G}^2 + {\rm \omega}_{\rm L}^2} \rsqb ^{1/2} + (\omega _{\rm L})/2$$
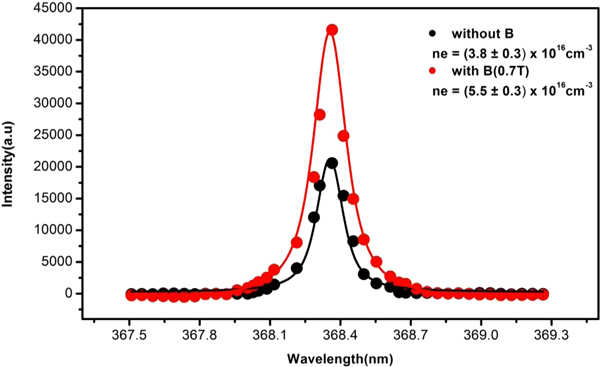
where ωG and ωL are the Gaussian and Lorentzian contributions, respectively. The electron density is determined as (3.8 ± 0.3) × 1016/cm3 without the magnetic field and (5.5 ± 0.3) × 1016/cm3 with applied magnetic field as shown in Figure 7. The plasma confinement in case of applied magnetic field leads to a higher electron number density. The increased Stark broadening with magnetic field also confirmed an increase in the electron number density.

Fig. 7. Voigt fitting of the Pb I (368.34 nm) emission line recorded at 130 mJ laser energy with and without the applied magnetic field.
Figure 8 reveals the variations of plasma temperature and electron number density of lead as a function of laser energy with and without magnetic field. The maximum enhancement factor in the plasma temperature and electron number density is observed at 130 mJ. The plasma temperature and electron density decreased significantly afterwards up to 200 mJ laser energy and then remains almost constant with further increase in the laser energy. This region can be considered as the saturation region of lead plasma. The maximum enhancement factor for the plasma temperature and electron number density is achieved at the same laser energy on which maximum enhancement was achieved earlier in the case of emission line intensities.

Fig. 8. Evolution of the enhancement factor: (a) plasma temperature, (b) electron density as a function of laser energy with and without the magnetic field at 2 µs delay time.
The variation in the electron number density with increasing laser energy in the absence and presence of applied magnetic field is presented in Figure 9. The electron number density exhibits an increasing trend with increasing laser energy in both the cases. The higher values of electron densities are attributed to the confinement of plasma in case of applied magnetic field.

Fig. 9. (a) Variation of electron density as a function of laser energy with and without magnetic field at 2 µs delay time.
In addition, the plasma is also assumed to be fulfilling the local thermal equilibrium. A minimum electron number density is required to fulfill the McWhirter's criterion (McWhirter, Reference Mcwhirter, Huddlestone and Leonard1965) which infers that the collisional processes are dominating in the plasma as compared to the radiative processes:
 $$N_{{\rm e\;}} \gt 1.6 \times 10^{12} \times (\Delta E)^3 \times (T_{\rm e})^{1/2}$$
where ΔE (eV) is the maximum energy difference between the upper and the lower energy levels and T e (K) is the plasma temperature. In the present work, the electron density calculated from Eq. (4) is about (6.8 ± 0.3) × 1015/cm3 using the plasma temperature (12 700 K), 130 mJ laser energy, 1 mm distance from the target, and ΔE = 3.364 eV. This value is lower than the electron number density (3.8 ± 0.3) × 1016/cm3 deduced without the magnetic field and (5.5 ± 0.3) × 1016/cm3 with 0.7 T magnetic field. Thus, the plasma can be considered close to LTE. The condition of validity of LTE has been also verified by calculating the diffusion length using the following relation (Cristoforetti et al., Reference Cristoforetti, De Giacomo, Dell'Aglio, Legnaioli, Togoni, Palleschi and Omenetto2010):
 $$\eqalign{D_{\rm \lambda} & \approx 1.4 \times 10^{12} \times \left( {\displaystyle{{(k_{\rm B} T_{\rm e})3/4} \over {N_{\rm e}}}} \right) \cr & \quad \times {\rm \;} \left( {\displaystyle{{{\rm \Delta} {\rm E}} \over {M_{\rm A}f_{12}\langle g\rangle}} {\rm \;}} \right)^{1/2} \times \,e^{{\rm \Delta} {\rm E}/2{k_{\rm B} T_{\rm e}}}}$$
where K is the Boltzmann constant, N e is the electron number density, T is the plasma temperature, M A is the atomic mass of element, ΔE is the energy difference in the upper and lower level, f 12 is the oscillator strength and 〈g〉 is the gaunt factor. The value of D λ was calculated for the Pb line at 368.34 nm using Eq. (5) as 0.003 mm. The characteristic variation of plasma length was assumed to be about 3 mm. This diffusion length is much lower than the characteristic variation of plasma length, thus it satisfied the condition (10 D λ < d) for a plasma following LTE (Cristoforetti et al., Reference Cristoforetti, De Giacomo, Dell'Aglio, Legnaioli, Togoni, Palleschi and Omenetto2010). In the light of the above-mentioned conditions, it can be concluded that the laser-generated plasma in the presence of external magnetic field fulfills the LTE criteria.
Spatial evolution of lead plasma
The spectrum of lead plasma was registered at the optimized laser energy of 130 mJ in the absence and presence of 0.7 T magnetic field. Figure 10a shows the intensity variations in the neutral lead line at 368.34 nm as a function of distance from the target. The intensity shows a decreasing trend in the presence and absence of a magnetic field. It indicates that the intensity of the spectral line and the persistence time of plasma are enhanced with the applied magnetic field due to the plasma confinement. Figure 10b shows the temperature variations along the plasma plume expansion. The temperature changes from 13 300 to 12 000 K as the distance changes from 0.5 to 3 mm. In the presence of magnetic field, it varies from 14 100 to 12 100 K. The plasma temperature at the surface of the target remains high and it may be attributed to inverse bremsstrahlung process.

Fig. 10. (a) Intensity variation of the lead line (368.34 nm) with and without applied magnetic field at various distances. (b) Plasma temperature variation with and without applied magnetic field at different distances from the target surface along the plume expansion.
A comparison of plasma temperature with and without applied magnetic field specifies that the plasma temperature is high in case of applied magnetic field up to 2.5 mm distance, whereas it is comparable at longer distance from the target. In the confined state, the temperature is higher due to the adiabatic compression and the Joule heating effect (Harilal et al., Reference Harilal, Tillack, Shay, Bindhu and Najmabadi2004; Shen et al., Reference Shen, Lu, Gebre, Ling and Han2006). A decrease in the plasma temperature with distances is related to the expansion and cooling of the laser-produced plasma (Diwakar and Hahn, Reference Diwakar and Hahn2008; Singh and Sharma, Reference Singh and Sharma2016).
The variation in the electron number density with and without the applied magnetic field at different distances from the target surface is presented in Figure 11. The electron number density changes from (5 ± 0.3) × 1016 to (3.2 ± 0.3) × 1016/cm3 as the distance is varied from 0.5 to 2.5 mm. The electron density varies from (5.2 ± 0.3) × 1016 to (4.2 ± 0.3) × 1016/cm3 with 0.7 T magnetic field. An increase in the electrons collisions in the presence of applied magnetic field results in higher electron number densities. Li et al. (Reference Li, Hu, Zhang, Jiang and Li2009) also reported an increasing trend in the electron density of Cu plasma in the presence of magnetic field. The electron density in the laser-produced copper plasma (Singh and Sharma Reference Singh and Sharma2016) with and without magnetic field also shows a similar trend as presented in Figure 11. The results show that the decrease in the electron number density is slow in the presence of magnetic field. The magnetic confinement increases the collision rate and as a result of more ionization, the electron density of the plasma increases.
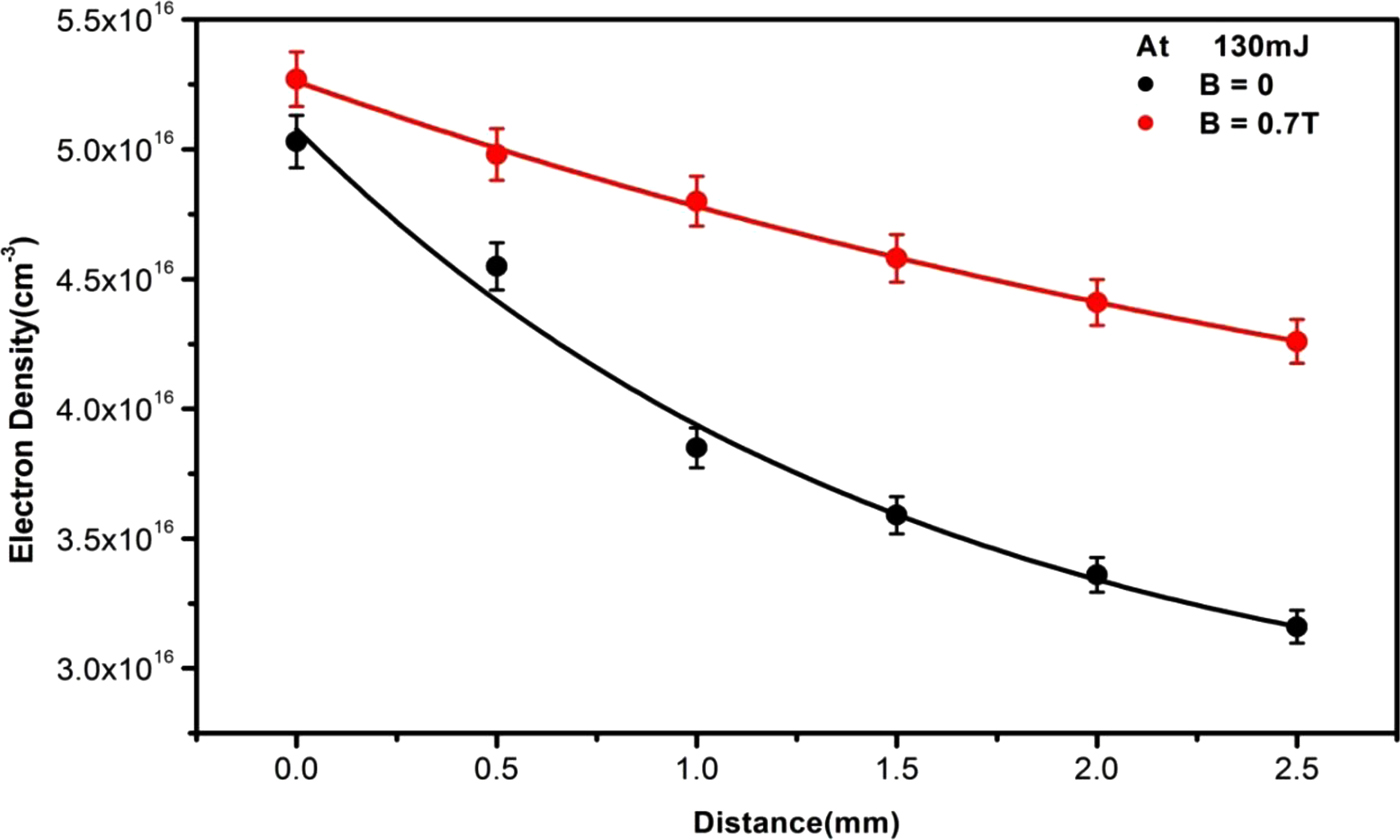
Fig. 11. Spatial variations in the electron number density with and without applied magnetic field.
Temporal behavior of lead plasma
In this set of experiments, we have used the same laser energy and magnetic field strength as were used in the spatial evolution study of the lead plasma. The emission intensity of an atomic line depends on the transition probability and number density of the excited atoms. In the presence of magnetic field, the emission line intensity enhancement is attributed to the enhanced number density of the excited atoms as the transition probability is not much affected. In the absence of the magnetic field, as the delay time increases, the intensities of the emission lines decrease. The density of the excited atoms and temperature also decreases due to the plasma expansion and cooling (Alonso-Medina, Reference Alonso-Medina2008).
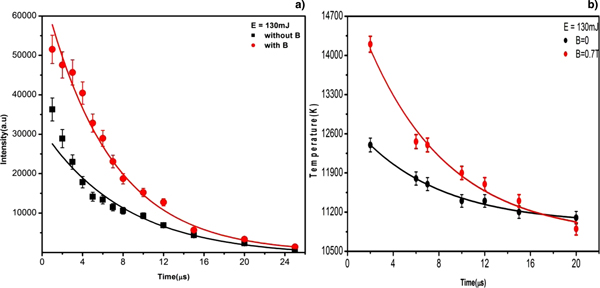
Figure 12a shows that in the presence of 0.7 T magnetic field, the emission intensity is higher during 1–12 µs delay time compared with the emission intensity without the applied magnetic field. It decays slowly from 15 to 25 µs in both the cases due to the expansion of the plasma. The radiative recombination enhances the emission intensity and the magnetic confinement increases the electron density. In Figure 12b, it is quite evident that, the electron temperature decreases rapidly up to 7 µs and decreases slowly beyond this time delay. The electron temperature at 15 µs time delay with the applied magnetic field is comparable to that without the magnetic field. The adiabatic compression and the Joule heating effect produced by the applied magnetic field increases the plasma temperature (Harilal et al., Reference Harilal, Tillack, Shay, Bindhu and Najmabadi2004).

Fig. 12. (a) Variations in the intensity of lead line (368.34 nm) as a function of time delay in the presence and absence of a magnetic field. (b) Variation of the plasma temperature as a function of time delay with and without magnetic field.
Discussion
The laser-produced plasma gets significantly affected by the external magnetic field due to the plume confinement, conversion of plasma energy into the kinetic energy, Joule heating effect, and plasma instabilities (Sudo et al., Reference Sudo, Sekiguchi and Sato1978; Amin et al., Reference Amin, Bashir, Anjum, Akram, Hayat, Waheed, Iftikhar, Dawood and Mahmood2017), ion acceleration and emission enhancement. The magnetic field produces a Lorentz force which is experienced by the plasma species and the velocity of the plasma expansion decreases. The magnetic pressure is defined as (Rai et al., Reference Rai, Rai, Yueh and Singh2003; Joshi et al., Reference Joshi, Kumar, Singh and Prahlad2010):
 $${\rm Magnetic\ pressure}={\rm } B^2/2\mu _0$$
where B is the applied magnetic field and μ0 is the permeability of the free space. The plasma pressure is represented as:
 $${\rm Plasma\ pressure} = n_{\rm e}k_{\rm B}\;T_{\rm e}$$
where n e, T e, and K are the electron density, electron temperature, and Boltzmann constant. The plasma parameter β, which controls the plasma confinement, is obtained from the magneto hydrodynamic equation (Chen, Reference Chen1974):
 $${\rm \beta} = \displaystyle{{n_{\rm e}k_{\rm B}T_{\rm e}} \over {B^2/2{\rm \mu} 0}}$$
where β is a dimensionless parameter. A decrease in the velocity of plasma with an external magnetic field can be related as (Arshad et al., Reference Arshad, Bashir, Hayat, Akram, Khalid, Yaseen and Ahmad2016):
 $$\displaystyle{{\; v_2} \over {v_1}} = \left( {1-\displaystyle{1 \over {\rm \beta}}} \right)^{1/2}$$
where v 1 is the velocity of the plasma expansion when no magnetic field is applied and v 2 is the velocity in the presence of a magnetic field. As the plasma pressure becomes greater than the magnetic pressure, the plasma penetrates through the region occupied by the magnetic field. Due to expansion of the plasma across the magnetic field with time, the plasma pressure decreases, and the resistance offered by the magnetic field increases. The confinement and immobility of the plasma takes place when the magnetic pressure is equal to the plasma pressure, i.e. when β = 1. The energy conservation and involvement of the air pressure are used to determine the stopping radius “R b” (Singh and Sharma, Reference Singh and Sharma2016):
 $$\; E_{\rm L}\; = \; \; \displaystyle{1 \over 2} mv^2 + \left( {\displaystyle{{B^2} \over {2{\rm \mu}_0}}} \right)V + \int P_{{\rm air}}dV$$
Here, E L, V, and v are the energy absorbed in the target, volume of the plasma, and velocity of the plasma, respectively, whereas μ0, P air, and m are the absolute permeability of air, air pressure, and mass of the plasma, respectively. For estimating the stopping radius, the spherical shape of the laser-generated plasma has been considered and by putting v = 0 in Eq. (10),
 $$\; R_{\rm b} = \left( {\displaystyle{{3E_{\rm L}} \over {4{\rm \pi}}} \;. \; \displaystyle{1 \over {P_{{\rm air}} + (B^2/2{\rm \mu}_0)}}} \right)^{1/3}$$
The reflectance of Pb at 532 nm wavelength is about 32% (Cabalin and Laserna, Reference Cabalin and Laserna1998). Therefore, the absorbed laser energy is about 88.4 mJ for the 130 mJ laser energy impinging on the target surface which results in the absorbed laser fluence of about 11.3 J/cm2 at the spot area of 0.0078 cm2 (Ahmed et al., Reference Ahmed, Ahmed and Baig2018a, Reference Ahmed, Ahmed, Umar, Liaqat, Manzoor and Baig2018b). The spot area has been calculated using the formula A = πR 2, where R is the radius of the spot size. However, the laser irradiance at various laser energies is calculated by using laser irradiance = E/(At), where E is the laser energy (J), A is the area (cm2), and t is the pulse width (5 ns).
For B = 0.7 T and E L = 88.4 mJ, the calculated value of R b in air with B = 0 is 5.95 mm, and its value at 0.7 T is 4.15 mm. Thus, the stopping radius is reduced nearly 30% in the presence of magnetic field. The plasma is strongly decelerated near the stopping radius. Now if β > 1, then the confinement will be ineffective; it is effective only if β < 1. At an axial distance of 2.5 mm from lead target, the plasma temperature and electron density are 12 335 K and 4.4 × 10¹⁶/cm3; therefore, the plasma pressure is 0.9 × 10⁴ N/m2 and the magnetic pressures at 0.7 T is 1.95 × 10⁵ N/m2. From Eq. (8) the value of β is approximately 0.046 which is <1. Similarly, the value of β was calculated at different values of the electron temperature and electron number density. The calculated value of β is <1 for all the experimental conditions, which gives a proof for the confinement of the plasma plume in the presence of magnetic field. In short, the magnetic confinement can be controlled by controlling the value of β and it depends on the plasma parameters (n e, T) and external B field. The plasma parameters can be controlled by controlling the laser energy. There are two ways to decrease the value of β, either it can be done by increasing the strength of external magnetic field or by decreasing the electron density and plasma temperature. The value of β with increasing distance and variable laser irradiance are listed in Tables 2 and 3.
Table 2. Calculated values of plasma pressure, magnetic pressure and plasma parameter β at various distances (130 mJ laser energy and 2 µs time delay)

Table 3. Calculated values of plasma pressure, magnetic pressure, and plasma parameter β at various laser irradiance in the presence of 0.7 T magnetic field at 2 µs time delay

It is observed that the emission intensity of the plasma increases with increasing laser energy at zero field as well as with the applied B-filed as shown earlier in Figure 2a. It is obvious because as the laser energy increases, it increases the rate of electron collisions, excitations and as a result enhanced plasma temperature and electron density. The maximum enhancement in the emission intensities is observed at 130 mJ laser energy with the applied B-field and hence the maximum emission intensity enhancement can be achieved by optimizing the laser energy and strength of external B field. The magnetic confinement of the laser-produced plasma leads to the enhancement in the emission intensity of the spectral lines. In the presence of B field, ions and electrons are separated due to the Lorentz force in the direction normal to magnetic field and produce current (Bittencourt, Reference Bittencourt1986). The force produced by the current decelerates the plasma expansion. When the plasma is confined, emission intensities are increased due to the increase in the collisional excitation and rate of recombination of the plasma species. Thus, collision excitation and recombination rate is increased in the presence of the magnetic field which results in an increase in the signal intensities. The resistive Ohm's law and adiabatic compression increase the electron temperature in the presence of magnetic field.
The thermal conductivity of the plasma with and without magnetic field is also determined by using relation (Sudo et al., Reference Sudo, Sekiguchi and Sato1978; Singh and Sharma, Reference Singh and Sharma2016),
 $$K = 9.0 \times 10^9\left( {\displaystyle{{T^{5/2}} \over Z}} \right)$$
and
 $$K_{\rm B} = 1.1 \times 10^{-11}\; \left( {\displaystyle{{n_{\rm e}^{2\;} Z} \over {B^2T^{1/2}}}} \right)$$
where, K B, K, and Z are the plasma thermal conductivity with and without magnetic field and charge state, respectively. Using the value of n e, T e, and B at 1.5 mm distance, we get, K = 1.5 × 10²⁰/cm/s and K B = 4.5 × 10²⁰/cm/s. This shows that the thermal conductivity of the laser-produced plasma increases in the presence of magnetic field. This results in more heat transfer from the core to the tail region of the plasma and thus the size of the core increases (Singh and Sharma, Reference Singh and Sharma2016). Consequently, the temperature of the plasma is increased. Figure 3a shows that the emission intensity increases with an increase in the laser energy in the absence of a magnetic field. The emission intensities are further increased in the presence of magnetic field (0.3, 0.5, and 0.7 T). It means, the value of β is <1 for different values of energy as given in Table 3. The dependence of magnetic confinement on the laser energy and external magnetic field is presented graphically in Figure 13. Evidently, the value of β decreases with increasing magnetic field and it increases with increase in the laser energy. As the value of β is <1 in all experimental conditions, magnetic confinement enhances the emission intensity; increases the plasma temperature and electron density.
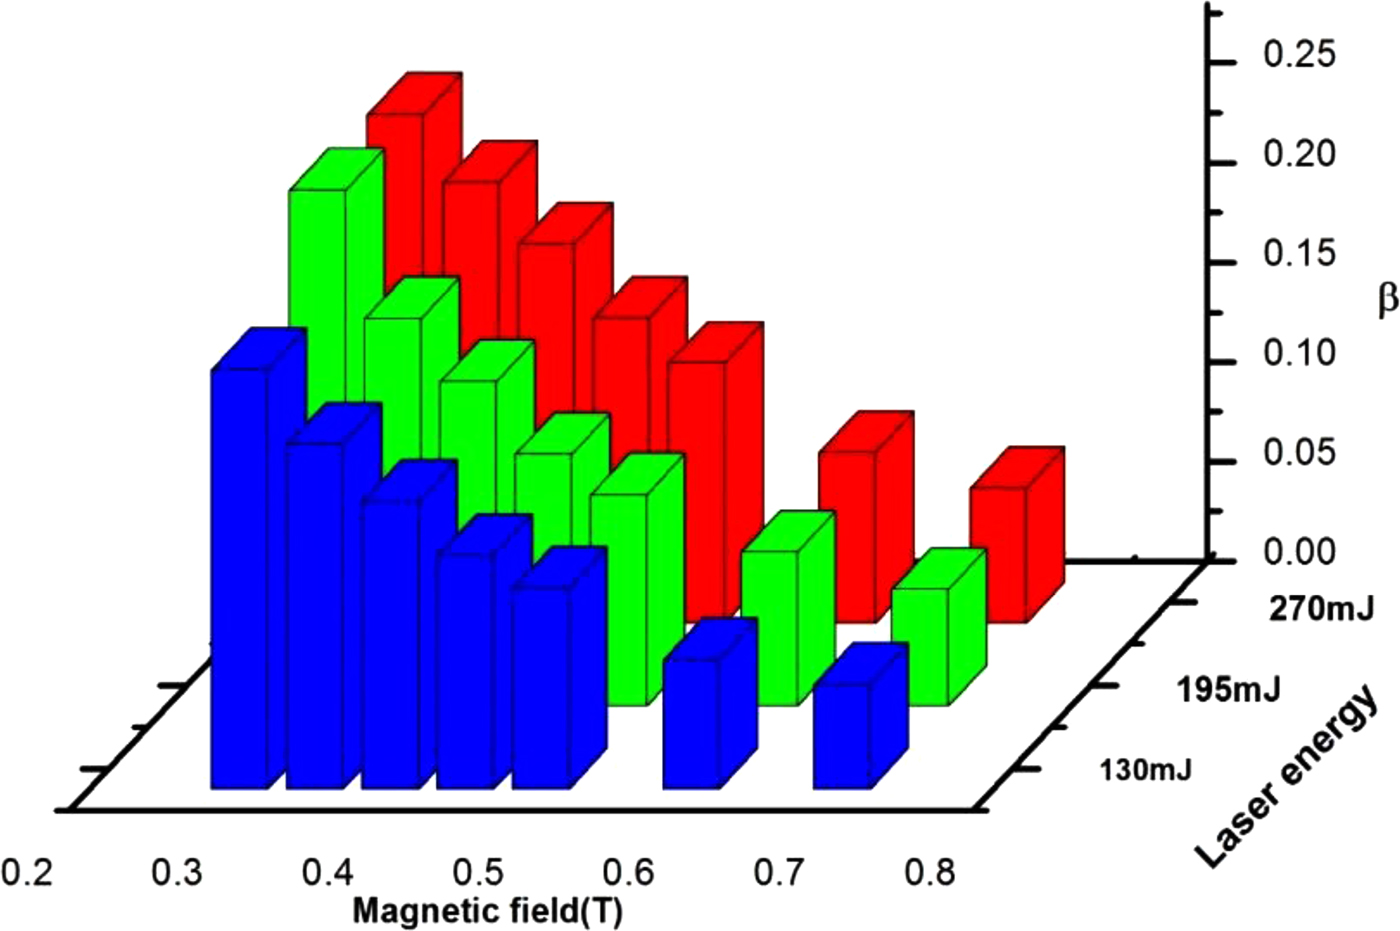
Fig. 13. Dependence of β on the laser energy and external magnetic field.
To optimize the laser energy for a maximum enhancement, magnetic field of 0.3, 0.5, and 0.7 T was applied with increasing laser energy. It is observed that the highest enhancement factor is achieved at 130 mJ laser energy in the presence of magnetic field as shown in Figure 3b. With further increase in the laser energy, the enhancement factor decreased sharply and almost remains constant for the laser energies in the range from 250 to 390 mJ. It is assumed that at high laser energy, the plasma is more energetic and more ionized and cools down more quickly so the emission decreases more rapidly. The enhancement factor remained constant beyond the optimized value of 130 mJ laser energy. The saturation/self-absorption of optical emission lines along with the reflection of laser energy from the magnetically confined plasma at higher laser energies results in lowering of the plasma enhancement and hence the enhancement factor remained almost constant (Rai et al., Reference Rai, Rai, Yueh and Singh2003; Cristoforetti et al., Reference Cristoforetti, Legnaioli, Palleschi, Tognoni and Benedetti2008; Arshad et al., Reference Arshad, Bashir, Hayat, Akram, Khalid, Yaseen and Ahmad2016). The enhancement factor of neutral line 368.34 nm has the values of about 1.3, 1.5, and 2.35 at a magnetic field of 0.3, 0.5, and 0.7 T. From Figure 4 it is evident that the enhancement factor of ionic line 424.49 nm has a maximum value at 130 mJ laser energy and possesses values of about 2.5 and 4.5 at 0.3 and 0.7 T magnetic field. The enhancement factor of the ionic line has larger value than that of the neutral line under identical conditions which showed that the enhancement factor and magnetic confinement depends on the species of the elements and excitation properties of the sample (Shen et al., Reference Shen, Lu, Gebre, Ling and Han2006; Rafique et al., Reference Rafique, Khaleeq- ur- Rahman, Riaz, Jalil and Farid2008; Singh and Sharma, Reference Singh and Sharma2016).
Conclusion
In the present study, we have optimized the laser energy/irradiance and strength of the applied magnetic field for maximum emission enhancement of the laser-produced lead plasma in air at atmospheric pressure. The emission intensity, plasma temperature, and electron number density increased in the applied magnetic field. The neutral and ionic lines showed maximum value of enhancement factor at 130 mJ laser energy. With increase in the magnetic field, the value of β decreased and enhancement in the emission intensity increased. In case of spatial and temporal evolution, the electron density and electron temperature decay slowly in the presence of 0.7 T magnetic field which attributes toward the deceleration of plasma expansion. The electron temperature varies from (13 300 ± 1000) to (12 000 ± 1000) K when the distance increased from 0.1 to 3 mm. In the presence of magnetic field, it varies from (14 100 ± 1000) to (12 100 ± 1000) K in the spatial evolution. The electron density varies from (5.0 ± 0.3) × 1016 to (3.2 ± 0.3) × 1016/cm3 when spatial distance varied from 0.5 to 3 mm. In the presence of magnetic field, the electron density changed from (5.2 ± 0.3) × 1016 to (4.2 ± 0.3) × 1016/cm3 in the spatial evolution. The calculated values of β are <1 in all the experimental conditions which confirmed the plasma confinement by the magnetic field. As Pb is a heavy element and its sensitivity increases in the presence of magnetic field, it will be more interesting for the wide range of audience in the field of agriculture, construction, plumbing, and radiation shielding to use the magnetic field for the detection of traces of heavy elements. The effect of magnetic field on the expansion of laser-produced plasma is also important in various applications, such as thin film deposition, nanoparticle synthesis, debris mitigation, surface modifications, development of X-ray-ultraviolet lithographic sources, and analytic detection limit enhancement in laser-induced-breakdown spectroscopy.
Author ORCIDs
N. Ahmed, 0000-0003-0460-6571.
Acknowledgements
We are grateful to the Pakistan Academy of Sciences and National Centre for Physics, Islamabad for the financial assistance to acquire the necessary laboratory equipment.