


INTRODUCTION
Chromosome studies of members of the deep-sea fauna have been limited previously by access difficulties and by low intrinsic rates of cell division (i.e. low productivity). In contrast, the high rates of productivity associated with the warm, nutrient-laden waters around hydrothermal vent environment (e.g. Lutz et al., Reference Lutz, Shank, Fornari, Haymon, Lilley, Von Damm and Desbruyères1994), make this highly unusual but well-studied deep-sea fauna a much better candidate for chromosome studies (Dixon et al., Reference Dixon, Dixon, Pascoe and Wilson2001). In some ways this is paradoxical given the high levels of toxic heavy metals (e.g. As, Cd, Pb, Hg, Ag, Cu, Zn) and radionuclides (e.g. radon) that typify the vent environment, some of which have well-documented mutagenic properties (Dixon et al., Reference Dixon, Pruski, Dixon and Jha2002a).
During a submersible dive cruise to the East Pacific Rise (EPR) in 1999 we took the opportunity to conduct a detailed study of the chromosomes of a range of Pacific vent invertebrates. In a previous paper (Dixon et al., Reference Dixon, Dixon, Pascoe and Wilson2001) we described the numerical chromosomal and nuclear characteristics of a range of Atlantic vent species including alvinocarid shrimps (Chorocaris chacei, Rimicaris exoculata and Mirocaris fortunata), a bathymodiolin mussel (Bathymodiolus azoricus) and a commensal polynoid polychaete (Branchipolynoe seepensis). In virtually all cases, however, we were unable to obtain chromosome spreads of sufficiently high quality for detailed morphological analysis (karyotyping). An important practical aim of this new investigation was therefore to improve the slide making technique so that detailed comparisons could be made between the chromosomes of vent species and representatives from other groups.
It should be noted that several of the vent organisms we studied are currently subjects of large scale genomic investigations which form part of the French Genoscope and EU Marine Genomics Network of Excellence programmes; for example, the giant tubeworm Riftia pachyptila, the alvinellid polychaetes Alvinella pompejana and Paralvinella grasslei, and the vent mytilid Bathymodiolus azoricus. Our new findings highlight the great potential for cytogenetic analysis in future taxonomic studies and in the fields of molecular evolution and development (EvoDevo). With such developments in mind, we used some of our findings to address the question of whether there is any evidence for the existence of a chromosomal clock in vent species which have present-day coastal relatives. Note, some members of the deep-sea vent fauna are believed to have had their evolutionary origins in the coastal zone at some time in the distant past (e.g. bivalve molluscs: Little & Vrijenhoek, Reference Little and Vrijenhoek2003; Rex et al., Reference Rex, McClain, Johnson, Etter, Allen, Bouchet and Warén2005; Samadi et al., Reference Samadi, Quéméré, Lorion, Tillier, von Cosel, Lopez, Cruaud, Couloux and Boisselier-Dubayle2007).
MATERIALS AND METHODS
Sample collection
Macrofaunal samples were collected from two EPR vent fields (9°50 N, 2512 m depth, and 13°N, 2632 m) in May 1999 during the French Hope 99 cruise (chief scientist: François Lallier). Samples were collected using the tele-manipulator claw of the ‘Nautile’ deep-submergence vehicle, and focused primarily on the dominant benthic components; the vent mussel Bathymodiolus thermophilus (9°50 N, Biovent), the giant vestimentiferan tubeworm Riftia pachyptila (9°50 N, Biovent) and the alvinellid polychaetes Alvinella pompejana and A. caudata (9°50 N, Biovent; 13°N, Genesis). The following organisms were also sampled: the polynoid Branchipolynoe symmytilida (commensal to Bathymodiolus thermophilus), the free-living polynoid Branchinotogluma grasslei (9°50 N, Biovent), the vent serpulid Laminatubus alvini (13°N, Genesis), the alvinellid Paralvinella grasslei (13°N, Genesis) and the small siboglonid Oasisia alvinae (9°50 N, Biovent). For comparative purposes, the karyotype of the Mid-Atlantic Ridge (MAR) vent mussel Bathymodiolus azoricus is described here for the first time from material collected from the Lucky Strike vent field, Tour Eiffel vent site (37°18′N; 1700 m) in August, 1997 (EU-funded MARVEL cruise, chief scientist: Daniel Desbruyères).
Somatic tissue manipulations and slide making
Freshly collected animals were placed in cold seawater before being dissected and their tissue pieces exposed to dilute colchicine (Sigma) at 4°C. Depending on the organism, life stage and tissue type, the colchicine treatments differed both in concentration and duration (Table 1). Colchicine exposure was followed by a series of hypotonic treatments, which consisted of 10–20 minute immersions in the following mixtures of 0.075 M KCl and seawater; 1:3, 1:1 and 3:1. The tissue pieces were then fixed in 3 changes, 20 minutes each, of fresh, cold, Carnoy's fixative (3 parts ethanol, 1 part glacial acetic acid and 1% chloroform). After fixation, the tissues were stored in the refrigerator overnight, which was shown to improve the slide making quality.
Table 1. Tissue type, colchicine treatment and cell division rate for the different species karyotyped in this study.

Slide making followed the method for solid tissues first developed by Kligerman & Bloom (Reference Kligerman and Bloom1977). Following incubation of the freshly-collected tissues (1 mm cubes or separated gill filaments) in 60% acetic acid, for about 10 minutes (i.e. until the tissues became colourless), cells were gently aspirated off the tissue mass using a Pasteur pipette, before they were transferred in droplets of the acetic acid to the surfaces of clean (1% HCl in IMS) slides on a warm hot plate (40°C). After a brief exposure to a warm slide surface, the droplets were withdrawn into the pipette, which had the effect of leaving rings of dried and spread nuclei on the slide surface. Cell density and chromosome spread quality was checked at this stage using a phase contrast microscope. Slides were air dried on the hot plate before storage in closed slide boxes. The remainder of the manipulations took place back in the laboratory.
Prior to staining, the dry slides were thoroughly moistened by immersion in phosphate buffer (Gurr's pH 6.8 buffer tablets), for at least 30 minutes, before being stained in Gurr's Improved R66 Giemsa stain, in 10% phosphate buffer, for 10 minutes. After staining, the slides were rinsed free of excess stain in phosphate buffer before bluing in tap water which contained 2 drops of ammonium hydroxide (Aldrich) per 50 ml. Finally, the slides were blotted dry between clean Postslip papers (Raymond Lamb) before examination under high-power oil immersion using a Nikon Eclipse E-800 microscope.
Karyotyping
Individual chromosomes were extracted from digital images and orientated, using the Eclipse software (Nikon), to allow pairing on the basis of similarity in size and arm ratio. Chromosome arms were measured using Eclipse Net (version 1.16) and total chromosome length (minus the centromere, μm), relative length (expressed as a percentage of the average lengths of all the haploid chromosomes combined) and arm ratio (ratio between the length of short arm, p, and the length of long arm, q) were calculated. Chromosome pairings were then arranged into categories based on centromere position using a modification of Levan et al.'s (1964) classification for human chromosomes, where: (1) median (m) represents an arm ratio of 1–0.59; (2) sub-median (sm) represents an arm ratio < 0.59–0.33; (3) sub-terminal (st) represents an arm ratio < 0.33–0.14; and (4) terminal (t) represents an arm ratio < 0.14. Homologue values were then averaged for the construction of an idiogram (graphical representation). A shortage of high-quality complete spreads meant that idiograms were based, in most cases, on only two complete spreads (i.e. 4 homologues per chromosome) per species, although (with the exception of A. caudata and B. grasslei) multiple karyotypes were constructed to ensure this pattern was replicated across cells/individuals.
Chromosome number variation and molecular divergence
To illustrate and compare the general pattern of chromosome number variation with molecular distance (estimated at the taxonomic level of a family, within and between genera), we retrieved sequences of 18S and 28S rRNA genes published in GenBank for vent species. Such genes are routinely used to infer phylogenetic relationships and the dataset included all vent-endemic species featured in this study. In the case of serpulids and mytilids, some coastal relatives were included in the pairwise comparisons. For serpulids, the 28S rRNA sequences corresponded to the D1 region. Partial sequences were aligned manually in BioEdit Sequence Alignment Editor (Hall, Reference Hall1999). Divergence estimates within and between genera were calculated only within taxonomic families by computing pair-wise distances according to the widely applied Kimura-2 parameter (K2-P; Kimura, Reference Kimura1980) with MEGA v. 2.1 (Kumar et al., Reference Kumar, Tamura, Jacobsen and Nei2001) and allowing full gap deletion. Since one species was associated with more than one pair-wise distance calculation, correlation analyses between pair-wise differences in haploid chromosome number and genetic distances were carried out using a Mantel permutation test implemented in ‘zt version 1.1’ (Bonnet & Van De Peer, Reference Bonnet and Van de Peer2002) with 10,000 permutations.
RESULTS
Chromosome morphology and number
SIBOGLONIDAE
Riftia pachyptila: as expected, based on body size–physiological rate expectations, the smallest sized individuals yielded the highest numbers of dividing cells (Table 1). Based on a total of 43 cells counted, from 4 individuals, a diploid chromosome number of 2 N = 26 was confirmed for this species. Figure 1 shows the karyotype for R. pachyptila and the corresponding idiogram which is clearly divisible, based on centromere position, into two groups: 7 median and 6 sub-median pairs. However, apart from an obvious size gradation within each category, there was no evidence of any secondary features which could be used to distinguish individual chromosomes or chromosome pairs. Table 2 shows mean total length, relative length, arm ratio and morphological classification type for each of the 13 pairs of chromosomes in R. pachyptila.

Fig. 1. Karyotype and idiogram for the giant vestimentiferan Riftia pachyptila. The idiogram, a diagrammatic representation based on a combination of relative haploid length and arm ratio, is based on two metaphases, each from a different individual, but cells from an additional two individuals were also examined.
Table 2. Total chromosome lengths, relative lengths (i.e. percentage of total haploid length), arm ratios and classification types (m, median; sm, submedian) for Riftia pachyptila from 9°50 N, Biovent.

Oasisia alvinae: the major difference between this vestimentiferan species and R. pachyptila is the higher number of chromosomes, 2 N = 28 (Figure 2); based on 20 spreads counted from 2 individuals. However, unlike R. pachyptila, the chromosomes are all median in relation to centromere position and thus monomorphic. Again, there was no evidence of any secondary features to enable individual chromosomes to be identified unambiguously. Table 3 shows mean total length, relative length, arm ratio and morphological classification type for each of the 14 pairs of chromosomes in O. alvinae.

Fig. 2. Karyotype and idiogram for the small vestimentiferan Oasisia alvinae. The idiogram is based on two metaphases from a single individual, but cells from an additional individual were also examined.
Table 3. Total chromosome lengths, relative lengths, arm ratios and classification type (m, median) for Oasisia alvinae from 9°50 N, Biovent.

ALVINELLIDAE
Alvinella pompejana and A. caudata: consistent with the extremely hostile environment in which they live, which led to sampling difficulties, the quality of the chromosomes we obtained from these two species was poorer than those of any other vent species we attempted to analyse. However, we were able to confirm a diploid (2 N) value of 32 chromosomes for A. pompejana; based on a total of 24 cells from 3 individuals. Chromosome quality in the case of the closely related A. caudata was so poor that no karyotyping could be attempted, but we were able to confirm an identical diploid chromosome number to that of A. pompejana, 2 N = 32, based on 17 counts from a single individual. In both species the chromosomes were monomorphic with respect to arm ratio category. Figure 3 shows the karyotype and idiogram for A. pompejana, which comprises 16 pairs of sub-terminal chromosomes, which differ only in the length of the long (q) arm. Table 4 shows mean total length, relative length, arm ratio and morphological classification type for each of the 16 pairs of chromosomes in A. pompejana.

Fig. 3. Karyotype and idiogram for the Pompeii worm Alvinella pompejana. The idiogram is based on two metaphases, each from a different individual, but cells from an additional individual were also examined.
Table 4. Total chromosome lengths, relative lengths, arm ratios and classification type (st, subterminal) for Alvinella pompejana from 9°50 N, Biovent.

Paralvinella grasslei: compared to the above two alvinellid species, P. grasslei has a lower chromosome number of 2 N = 30, estimated from a total of 16 counts from 2 individuals. Figure 4 shows the karyotype and idiogram for P. grasslei, which again consists solely of sub-terminal chromosomes. Table 5 shows mean total length, relative length, arm ratio and morphological classification type for each of the 15 pairs of chromosomes in the karyotype of P. grasslei.
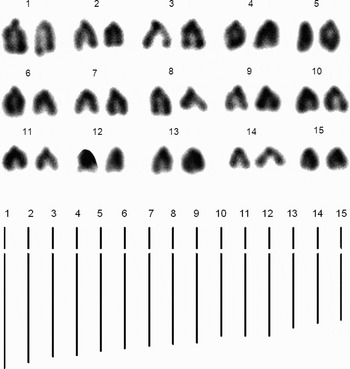
Fig. 4. Karyotype and idiogram for the alvinellid Paralvinella grasslei. The idiogram is based on two metaphases from a single individual, but cells from an additional individual were also examined.
Table 5. Total chromosome lengths, relative lengths, arm ratios and classification type (st, subterminal) for Paralvinella grasslei from 13°N, Genesis.

POLYNOIDAE
Branchinotogluma grasslei and Branchipolynoe symmytilida: the free-living B. grasslei and the commensal B. symmytilida (from Bathymodiolus thermophilus) both have a diploid chromosome number of 2 N = 36; based on 11 and 8 spreads respectively; each from two individuals. In comparison, Branchipolynoe seepensis (from Atlantic Bathymodiolus azoricus) has a lower chromosome number of 2 N = 34 (Dixon et al., Reference Dixon, Dixon, Pascoe and Wilson2001). With B. grasslei, the chromosome yield (Table 1) and quality was low so that no karyotyping was attempted. We were able, however, to distinguish more than one morphological type within those spreads we examined. Hence, based on this preliminary analysis, it is apparent that B. grasslei has heteromorphic chromosomes, consisting of at least two sub-groupings, median and sub-median/sub-terminal, with the largest pair of chromosomes belonging to the median group. Similarly, the commensal polynoid Branchipolynoe symmytilida also has a heteromorphic karyotype, in this case consisting of 12 pairs of median chromosomes, 4 pairs of sub-median chromosomes and 2 pairs of sub-terminal chromosomes (Figure 5). Table 6 shows mean total length, relative length, arm ratio and morphological classification type for each of the 18 pairs of chromosomes in the karyotype of B. symmytilida.

Fig. 5. Karyotype and idiogram for the commensal polynoid Branchipolynoe symmytilida. The idiogram is based on two metaphases from a single individual, but cells from an additional individual were also examined.
Table 6. Total chromosome lengths, relative lengths, arm ratios and classification types (m, median; sm, submedian; st, subterminal) for Branchipolynoe symmytilida from 9°50 N, Biovent.

SERPULIDAE
Laminatubus alvini: in contrast to those other polychaete species we examined, the serpulid L. alvini has the lowest diploid chromosome number of 2 N = 22; based on a total of 23 spreads from 4 individuals. The karyotype is heteromorphic, consisting of two distinct categories, sub-median and terminal, with the largest chromosome belonging to the terminal group (Figure 6). Table 7 shows mean total length, relative length, arm ratio and morphological classification type for each of the 11 pairs of chromosomes in the karyotype. Importantly, none of the polychaete species we examined showed signs of any secondary chromosomal features.

Fig. 6. Karyotype and idiogram for the vent serpulid Laminatubus alvini. The idiogram is based on two metaphases from a single individual, but cells from an additional three individuals were also examined.
Table 7. Total chromosome lengths, relative lengths, arm ratios and classification types (sm, submedian; t, terminal) for Laminatubus alvini from 13°N, Genesis.

BATHYMODIOLINAE (BIVALVIA)
Bathymodiolus thermophilus and B. azoricus: both species have a diploid chromosome number of 32, which confirms our previous estimate for B. azoricus (Dixon et al., Reference Dixon, Dixon, Pascoe and Wilson2001). In the case of B. thermophilus this estimate is based on a total of 21 spreads from 2 individuals, whereas for B. azoricus a smaller number of metaphases meant that the estimate is based on only 3 spreads from a single individual (note, this figure does not include the spread shown in our earlier paper). In both the vent mussels, the chromosomes are more heterogeneous than in the polychaete species we examined, with all 4 morphological categories being present. In B. thermophilus (Figure 7), the karyotype consists of 5 pairs of median, 3 pairs of sub-median, 7 pairs of sub-terminal, and 1 pair of terminal chromosomes. In contrast, the karyotype of B. azoricus (Figure 8) consists of 6 pairs of median, 4 pairs of sub-median, 3 pairs of sub-terminal, and 3 pairs of terminal chromosomes. In addition to these arm ratio differences, B. azoricus was unusual amongst the species we examined in having a large, interstitial, non-staining region affecting both chromatids on the long arm of median chromosome pair 4 (Figure 8). It should be noted that this secondary feature was present in both spreads we karyotyped from the same individual. Tables 8 and 9 show mean total length, relative length, arm ratio and morphological classification type for each of the 16 pairs of chromosomes in the karyotypes of B. thermophilus and B. azoricus.

Fig. 7. Karyotype and idiogram for the Pacific mytilid Bathymodiolus thermophilus. The idiogram is based on two metaphases from a single individual, but cells from an additional individual were also examined.

Fig. 8. Karyotype and idiogram for the Atlantic mytilid Bathymodiolus azoricus. The arrow shows the position of the large, pale staining, putative nucleolar organizer region (NOR) on chromosome 4. The idiogram is based on replicated homologue values from a single metaphase, but additional incomplete spreads from this and another individual were also examined to confirm the presence and position of the NOR.
Table 8. Total chromosome lengths, relative lengths, arm ratios and classification types (m, median; sm, submedian; st, subterminal; t, terminal) for Bathymodiolus thermophilus from 9°50 N, Biovent.

Table 9. Total chromosome lengths, relative lengths, arm ratios and classification types (m, median; sm, submedian; st, subterminal; t, terminal) for Bathymodiolus azoricus from Lucky Strike vent field, MAR.

Chromosome number difference and molecular divergence
Table 10 summarizes all the information gathered on chromosome number and pair-wise genetic distances between species estimated using the 18S and 28S rRNA genes, at the taxonomic level of a family or sub-family. The relationship between numerical difference in the haploid chromosome number between species within each family, or sub-family, and genetic distances is shown in Figure 9. Generally, there was a trend suggesting increased genetic distance with increased difference in chromosome number (Figure 9). The correlation value (r) for both the 18S (r = 0.837) and 28S (r = 0.857) rRNA genes was significantly different from zero, with a P value smaller than 0.001. While the null hypothesis of no correlation between datasets can be rejected, it is important to note the large confidence intervals in the range of pair-wise genetic distance values for any given difference in haploid chromosome number. Removal of the A. caudata and A. pompejana 28S rRNA data from the analysis (D = 0.15; N difference = 0) improved this relationship (r = 0.892, P < 0.001), whereas the removal of Filograna implexa and Hydroides norvegica, which showed the highest levels of divergence under pairwise sequence comparisons, reduced the relationship for the 28S rRNA (r = 0.732; P < 0.001) but enhanced the relationship further for the 18S rRNA (r = 0.869; P < 0.001).

Fig. 9. Relationship between pairwise genetic distances (according to K2-P substitution model) and differences in the haploid chromosome number within families and sub-families. (A) 18S rRNA; (B) 28S rRNA. Diamonds and triangles represent comparisons made within the Bivalvia (Bathymodiolinae: black diamonds) and the Polychaeta (Alvinellidae and Siboglonidae: black triangles; Serpulidae: grey triangles; Branchipolynoidae: white triangle) respectively. See Table 10 for pair-wise comparisons.
Table 10. Chromosome and molecular variation across the sampled hydrothermal vent taxa and some related coastal species. Genetic distances are based on the K2-P distance model.

DISCUSSION
In the absence of early developmental stages, we focused whenever possible during this study on small sized individuals (Table 1). However, in the case of the vent serpulid Laminatubus alvini a significant proportion of animals released mature eggs or sperms after removal from their tubes, several thousand oocytes (eggs) in some cases, but none of these eggs showed any signs of development at 1 bar pressure. Despite the generally low yield of dividing cells, we were successful in obtaining complete karyotypes for virtually all the species we collected, which points to a definite improvement in technique since the time of our earlier vent chromosome study (Dixon et al., Reference Dixon, Dixon, Pascoe and Wilson2001). The main reason for this improvement was the ability to fine tune the colchicine exposures, concentration and duration, using phase-contrast microscopy.
Chromosome number variation
As with our previous Atlantic study (Dixon et al., Reference Dixon, Dixon, Pascoe and Wilson2001), the chromosome numbers we recorded from these Pacific vent invertebrates were generally in keeping with those that have been reported for their non-vent dwelling, coastal relatives. According to a review of bivalve cytogenetics (Thiriot-Quiévreux, Reference Thiriot-Quiévreux2002), the modal diploid chromosome number within the bivalve group Mytiloida, to which Bathymodiolus belongs, is 28 (range 24–32; based on studies of 16 coastal species). Our value of 2 N = 32 for Bathymodiolus azoricus and B. thermophilus falls at the upper end of this range and supports our previous conclusion that vent colonization has not been accompanied by any specific change at the chromosome number level (Dixon et al., Reference Dixon, Dixon, Pascoe and Wilson2001). The same can be seen for the serpulid Laminatubus alvini. Members of the Serpulidae family and more specifically the Serpulinae, show a relatively wide range of diploid chromosome numbers (2 N = 20 to 28; Dixon et al., Reference Dixon, Pascoe and Dixon1998), and our value of 2 N = 22 for L. alvini falls at the lower end of this range. In comparison to other deep-water serpulid species, L. alvini grows to an unusually large size (more than 40 mm body length and tube length up to 100 mm) and has an exceptionally large branchial crown. From our analysis we were unable to detect any chromosomal feature which could be linked to this unusually large body size (e.g. polyploidy), which suggests that this may simply be a reflection of the abundant food supply (Pond et al., Reference Pond, Allen, Bell, van Dover, Fallick, Dixon and Sargent2002).
Comparing the Pacific and Atlantic commensal scaleworms, Branchipolynoe symmytilida and B. seepensis, we found clear evidence of numerical divergence between the two species. Branchipolynoe symmytilida (from Pacific B. thermophilus) has a chromosome number of 2 N = 36 (Figure 5), in common with the free-living Pacific polynoid Branchinotogluma grasslei (see Results), whereas Branchipolynoe seepensis (from Atlantic B. azoricus) has a lower chromosome number of 2 N = 34 (Dixon et al., Reference Dixon, Dixon, Pascoe and Wilson2001). Based on this numerical difference it can be concluded that the Pacific and Atlantic forms of Branchipolynoe show a greater degree of genetic separation, at least at the chromosome level, than do their mytilid hosts. This result provides a striking parallel with what was previously observed for the same two species pairs at the molecular level, using rDNA markers (Jollivet et al., Reference Jollivet, Comtet, Chevaldonné, Hourdez, Desbruyères and Dixon1998a), and adds further support to their evolutionary rates (molecular and chromosomal) being significantly different.
Unlike mytilids and serpulids, alvinellid polychaetes are vent-endemics so no comparisons with coastal relatives could be made. However, comparing vent species, it was interesting to note that the two alvinellid genera represented by Paralvinella grasslei and the Alvinella spp., only differed by a single chromosome pair, which either suggests a low rate of chromosomal and molecular evolution or that alvinellid radiation is more recent. In addition, the fact that there is no difference between the two Alvinella species, with respect to chromosome number, allows us to refute the hypothesis of possible disruptive speciation that would have explained the co-occurrence of these two morphologically close but genetically divergent species within the same habitat. Previously, Chevaldonné et al. (Reference Chevaldonné, Jollivet, Desbruyères, Lutz and Vrijenhoek2002) reported finding evidence of an extremely low mutation rate in the mitochondrial genome of Paralvinella spp. Similarly, the two vestimentiferans R. pachyptila and O. alvinae only differ by 1 chromosome pair although they are highly divergent morphologically (based on gill structure) as well as genetically. Clearly, more work is required to determine the precise role of chromosome change in the speciation process within these different groups.
Karyotype morphologies and chromosome structural features
In her review, Thiriot-Quiévreux (Reference Thiriot-Quiévreux2002) refers to the diversity of karyotype morphology within the Bivalvia ranging from metacentric to telocentric (median to sub-terminal/terminal using the terminology of Levan et al., Reference Levan, Fredga and Sandberg1964), with some species having only a single morphological type (monomorphic) and others having more than one (heteromorphic). While there is evidence which suggests thermal stability of ribosomal DNA sequences in hydrothermal vent organisms (Dixon et al., Reference Dixon, Simpson-White and Dixon1992), we did not observe any macroscopic chromosomal features which could be linked specifically to vent existence.
In addition to their similar chromosome numbers, both the Pacific Bathymodiolus thermophilus and Atlantic B. azoricus have heteromorphic karyotypes, with all four morphological categories represented (median, sub-median, sub-terminal and terminal). However, there were also marked differences in the chromosomal morphology between the two species (Figures 7 & 8). Adopting a parsimonious approach, the karyotype of B. azoricus differs from that of B. thermophilus at 3 main karyotype positions, corresponding to chromosome pair 2 (median), pair 7 (sub-median) and pair 14 (terminal) in B. azoricus, which suggests that at least three major pericentric inversions may have taken place since the time that the species became separated. In addition to these structural changes, there is evidence of a large interstitial achromatic region on chromosome 4 in B. azoricus (arrowed in Figure 8), which was not found in B. thermophilus. A similar Giemsa-negative heterochromatic region was previously reported by us for both the coastal mussels Mytilus edulis and M. galloprovincialis (Dixon & Flavell, Reference Dixon and Flavell1986), which on first examination appeared to be restricted to a single homologue, as in B. azoricus. However, subsequent analysis, using a more specific silver stain method (Dixon et al., Reference Dixon, McFadzen and Sisley1986), showed this to be a structural feature affecting both homologues and which was identified as the site of the genes responsible for coding for rDNA (NOR; nucleolar organizer region). Where NORs occur interstitially, as in the case of the intertidal dog-whelk Nucella lapillus (Dixon et al., Reference Dixon, Pascoe, Gibbs, Pasantes and Beaumont1994; Pascoe & Dixon, Reference Pascoe and Dixon1994), they often appear as colourless gaps or secondary constrictions. This raises the distinct possibility that the secondary constriction we describe in B. azoricus (Figure 8) is a large NOR. It is unfortunate that this putative chromosomal marker was not associated with any of the three chromosomes that distinguish B. azoricus from B. thermophilus, otherwise this might have confirmed the nature of at least one of the rearrangements separating the two karyotypes.
Unlike the mytilids, all the polychaetes we karyotyped showed no signs of any secondary chromosomal features. In addition, with the exception of Branchipolynoe symmytilida in which three chromosome categories were present, generally there was only one (Alvinella pompejana, Paralvinella grasslei, Oasisia alvinae) or two (Riftia pachyptila, Laminatubus alvini). Together with their identical numbers, the chromosomes in A. pompejana and A. caudata are all sub-terminal, indicating a very close relationship between these two species (i.e. sister-species). A sub-terminal karyotype morphology was also found in the closely related Paralvinella grasslei, which suggests this type of chromosome morphology may be a characteristic of, although not in any way restricted to, the Alvinellidae. Meanwhile, the phenomenon of elongate, widely splayed chromosomes, as illustrated for Laminatubus alvini (Figure 6) has been seen before, for example Pomatoceros spp., Hydroides spp. and Mercierella (Ficopomatus) enigmaticus (Dasgupta & Austin, Reference Dasgupta and Austin1960; Dixon et al., Reference Dixon, Pascoe and Dixon1998) and would therefore appear to be a characteristic of the group.
Chromosomal and molecular evolutionary patterns
In an attempt to examine these chromosomal changes in terms of a chromosomal clock, we compared the levels of chromosome number variation with levels of molecular divergence within the 18S and 28S rRNA genes, using published data (Figure 9).
Among coastal invertebrates, chromosome number variation shows no relationship with evolutionary complexity between groups (Thiriot-Quiévreux, Reference Thiriot-Quiévreux and Beaumont1994). Although one may predict that differences should be smaller within any one genus than between genera of the same family, there is no evidence for a chromosomal clock associated with numerical differences which can be applied across phyla. In addition, while a molecular clock may help date the time when species diverged, the rate of chromosomal evolution as characterized by the number of chromosomal changes gives no indication of the timescale involved (Rumpler, Reference Rumpler2000). However, if the chromosomal clock concept can be applied at a lower taxonomic level, as our findings may suggest (e.g. within a family), a more precise estimation of chromosomal rearrangement is required based on specific banding patterns or the use of molecular probes.
Interestingly, from our combined chromosomal–molecular comparison we were able to show that for any given difference in chromosome number between species belonging to the same family, there was a wide range variation from the mean in terms of pair-wise genetic distances. This is significant and may reflect the phyletic origins of some of the taxa used to illustrate this relationship. For example, most pair-wise distances calculated among different species/genera within the Serpulidae are very similar even though chromosome numbers may differ markedly. The Serpulidae is a polychaete family in which the traditionally formulated subfamilies Filograninae and Serpulinae are not considered monophyletic (Kupriyanova et al., Reference Kupriyanova, MacDonald and Rouse2006). Thus, a deeper polyphyletic origin may help explain the higher and more similar genetic distances seen at both 18S and 28S rRNA genes among comparisons of serpulid species differing by 1 to 4 chromosomes (Table 10; Figure 9). The exception is the comparison between Pomatoceros sp. and Laminatubus alvini and between Hydroides norvegica and Serpula vermicularis, which both comprise well supported and reciprocally monophyletic clades (see Kupriyanova et al., Reference Kupriyanova, MacDonald and Rouse2006) in which genetic distances fall within the lower range of values expected from the level of numerical chromosomal difference observed between these genera. Due to the lack of data for other deep-sea serpulids, our chromosomal comparisons were limited by necessity to coastal species (e.g. Dixon et al., Reference Dixon, Pascoe and Dixon1998), which may nonetheless share a close evolutionary history to vent organisms due to faunistic migrations linked to supposedly complete anoxic episodes in the deep sea, most recently during the Eocene (e.g. Jacobs & Lindberg, Reference Jacobs and Lindberg1998).
The data gathered on the karyotypes of Bathymodiolus spp. are very interesting in the light of the chromosomal clock concept since despite an absence of variation in chromosome number, there are marked morphological differences between karyotypes of the two species together with a striking secondary chromosomal feature appearing to affect chromosome 4 of B. azoricus. However, evidence using a multi-gene dataset (9 nuclear gene loci and the mitochondrial cytochrome oxidase subunit I gene (COI)) suggests that the rate of mutation is in fact very low, less than 0.1% per My (Faure et al., submitted). Therefore, this is possible proof that in the Bathymodiolinae, intra-chromosomal rearrangements evolve at a faster rate than variation in chromosome number or for that matter the rate of molecular evolution.
While differences in the number and morphological categories of chromosomes cannot be used to infer a chromosomal clock (without proof regarding the nature of chromosomal rearrangements), they are nonetheless an indication that significant chromosomal rearrangement has occurred. Using the 1% per My mutation rate estimated for the mitochondrial COI gene by Won et al. (Reference Won, Young, Lutz and Vrijenhoek2003) between Bathymodiolus populations separated by the Easter microplate region of the EPR, Jones et al. (Reference Jones, Won, Maas, Smith, Lutz and Vrijenhoek2006) estimated the divergence of bathymodiolin mussels from the lineage leading to Benthomodiolus lignicola (a species found on wood and bone and positioned basally in the phylogenetic tree) would have occurred between 23.7–37.1 Mya (million years ago), which is in accordance with other published results on Miocene radiations of Mytilidae and Vesicomydae. Recent data from Faure et al. (submitted) further places the divergence between B. thermophilus (Pacific) and B. azoricus (Atlantic) about 10 Mya, which agrees well with the closure of the Panama seaway 3.5 Mya (Knowlton et al., Reference Knowlton, Weigt, Solórzano, Mills and Bermingham1993) and which shows that cold seep species, on either side of the Panama isthmus, are positioned phylogenetically between the Pacific and Atlantic hydrothermal vent species B. thermophilus and B. azoricus (Jollivet, personal communication). By comparison, the Mytilus species complex (M. edulis, M. galloprovincialis and M. trossulus) in the coastal North Atlantic shows much less evidence of chromosome differentiation, to the extent that this divergence level can best be described as sub-chromosomal in extent (for references see Thiriot-Quiévreux, Reference Thiriot-Quiévreux2002). This lower level of chromosomal differentiation is consistent with a much shorter evolutionary history (Barsotti & Meluzzi, Reference Barsotti and Meluzzi1968; Seed, Reference Seed1992) and is supported by evidence of hybridization and population introgression (Skibinski et al., Reference Skibinski, Ahmad and Beardmore1978; Dixon & Flavell, Reference Dixon and Flavell1986; Matson et al., Reference Matson, Davis and Chew2003; Zbawicka et al., Reference Zbawicka, Wenne and Skibinski2003). Assuming that the split between B. azoricus and B. thermophilus occurred about 10 Mya and that at least three major pericentric inversions have taken place since the species became separated, in the absence of fine-scale chromosome banding patterns we can estimate a conservative rate of 0.3 rearrangements per My for this taxon. As a comparison, data on higher taxonomic groups such as mammals point to a rate of chromosomal evolution in the range of 0.07–0.1 rearrangements per My (Gilbert et al., Reference Gilbert, O'Brien, Bronner, Yang, Hassanin, Ferguson-Smith and Robinson2006).
Similarly, according to morphological, molecular and geological evidence (Black et al., Reference Black, Halanych, Maas, Hoeh, Hashimoto, Desbruyères, Lutz and Vrijenhoek1997; Rouse, Reference Rouse2001; Chevaldonné et al., Reference Chevaldonné, Jollivet, Desbruyères, Lutz and Vrijenhoek2002), the siboglonid polychaetes Oasisia alvinae and Riftia pachyptila are only distantly related, with the former being much more closely related to Ridgeia piscesae, a species which now forms part of a distinct hydrothermal vent community on the northern part of the once contiguous Eastern Pacific ridge system; an isolation event which took place ~28.5 MYA (Tunnicliffe, Reference Tunnicliffe1988; Atwater, Reference Atwater, Winterer, Hussong and Decker1989). Assuming a common ancestry (i.e. monophyletic origin), this places the basibranchiate O. alvinae and the axonobranchiate R. pachyptila (Rouse, Reference Rouse2001) at an evolutionary distance in excess of 30 million years and possibly approaching 40 million years (Black et al., Reference Black, Halanych, Maas, Hoeh, Hashimoto, Desbruyères, Lutz and Vrijenhoek1997; Chevaldonné et al., Reference Chevaldonné, Jollivet, Desbruyères, Lutz and Vrijenhoek2002). Comparing idiograms, it is clear that the chromosomal divergence of R. pachyptila and O. alvinae has involved at least 6 pericentric inversions and the loss or gain of one entire chromosome pair (Figures 1 & 2). Given the scale of this chromosomal separation, a comprehensive cytogenetic investigation of the Siboglonidae should clearly provide some valuable insights into the mechanisms underlying their proposed recent evolutionary radiation (Black et al., Reference Black, Halanych, Maas, Hoeh, Hashimoto, Desbruyères, Lutz and Vrijenhoek1997; Halanych et al., Reference Halanych, Lutz and Vrijenhoek1998). Assuming an average of 35 My has elapsed since the split between Riftia sp. and Oasisia sp. and that at least 6 pericentric inversions have taken place, this gives an average of 0.17 rearrangements per My, well below the rate estimated between Bathymodiolus species. Again it is clear that chromosomal rearrangements occur at a faster pace than the rate of molecular evolution even in hydrothermal vent organisms which have been found to have very low mutation rates.
So far, we have assumed that within genera, the rate of molecular and chromosomal variation was similar among species which do not differ in their chromosome numbers. This clearly is not the case for the commensal Branchipolynoidae species described here. However, information concerning this group is scarce and a comprehensive cytogenetic and molecular study should be undertaken to understand whether chromosome differences observed in this genera reflect different rates of molecular and chromosomal variation, or whether they are the result of Robertsonian (Rb) polymorphisms affecting certain populations. Not only are the evolutionary origins of this taxon unclear in terms of radiation events, but it may be that the evolution of commensalism in Branchipolynoidae may have happened more than once from free living stages to parasitic stages and vice versa, in a similar manner to the radiation of Bathymodiolus spp. which followed habitat reversals (Jones et al., Reference Jones, Won, Maas, Smith, Lutz and Vrijenhoek2006). It is our belief that if the monophyletic origins of the Branchipolynoidae are proven, then Rb polymorphisms will turn out to be the most likely explanation of any apparent inconsistencies in chromosome number within the genus.
In summary, our findings highlight the great potential of chromosome analysis when applied to members of the deep-sea vent fauna. The levels of chromosomal divergence we recorded were not always easy to interpret from a simple isolation perspective, as highlighted by the case of the bivalve–polychaete commensalisms (Bathymodiolus–Branchipolynoe), where factors such as reproductive strategy have to be considered as playing an important part in influencing the rate/degree of genetic divergence (Jollivet et al., Reference Jollivet, Comtet, Chevaldonné, Hourdez, Desbruyères and Dixon1998a). Consequently, when viewed collectively our findings are equivocal when considered in the context of the debate regarding the role of chromosome change in the speciation process (White, Reference White1978; Carson, Reference Carson and Bariozzi1982; King, Reference King1993), but it is clear that chromosomal rearrangements and numerical changes must be considered as important contributory mechanisms when considering genome evolution within representatives of the present day deep-sea vent fauna, as indicated previously by Jollivet et al. (Reference Jollivet, Dixon, Desbruères and Dixon1998b).
ACKNOWLEDGEMENTS
We wish to thank Didier Jollivet and Stéphane Hourdez for stimulating discussions, as well as two anonymous referees for providing constructive comments on a previous version of the manuscript. M.T.J. acknowledges with thanks his ‘Marie Curie Intra-European Fellowship’ award (MEIF-CT-2006-024781) from the European 6th Framework programme (FP6). D.R.D. and L.R.J.D. would like to record their thanks to the late Professor Alan Southward for his comments on an earlier draft of this paper and for his generous support and interest over the years.


