


Introduction
Cashew is an economically important crop introduced to India by Portugeese from Brazil during 16th century. ICAR-Directorate of Cashew Research was established in 1986 at Puttur, Dakshina Kannada district of Karnataka state, India. This is the nodal centre for cashew research in the country and is conducting systematic surveys since its inception for germplasm collections across India. So far, 539 germplasm accessions have been conserved in the National Cashew Field Gene Bank (NCFGB), and out of these, 478 accessions have been evaluated and characterized (Nayak et al., Reference Nayak, Mohana, Bhat, Saroj, Swamy and Bhat2015). The success of crop improvement programme in any crop pivots around utility of germplasm accessions. Hence detailed evaluation and subsequent conservation of accessions is of paramount importance. Since cashew is a perennial tree crop, it needs considerable resources for management and conservation. However, conservation through seeds is not possible in cashew as it is highly cross-pollinated and each seed will be genetically dissimilar from its mother. Further, as in other Anacardiaceae members such as mango, regeneration of plants by tissue culture of mature explants has not been successful in cashew (Thimmappaiah and Shirly, Reference Thimmappaiah and Shirly1999; Krishna and Singh, Reference Krishna and Singh2007). Hence, any effort to minimize the number of accessions to be conserved and hence space is more rewarding for saving resources.
Considerable redundancy in germplasm accessions of most crops including cashew has been observed in field gene banks. Therefore, it is crucial to concentrate on the set of very significant collection that maximizes allelic richness out of a big entire collection. This representative collection is called as core collection (Frankel, Reference Frankel, Arber, Llimensee, Peacock and Starlinger1984, Brown, Reference Brown1989), which can be easily managed, utilized and conserved. Since it represents the diversity present in the entire collection, the core collection serves as a reference for adding new germplasm accessions with unique characters. In other words, it helps in identifying gaps and enrich the existing collections. Moreover, crop improvement efforts need diverse germplasm accessions to enhance genetic base of existing cultivars and to develop novel populations, which eventually leads to identification of better varieties and hybrids. So, the core collections are expected to ensure continued genetic gain in breeding efforts. Further, specifically in cashew, cashew stem and root borer is a serious pest, and every year, there is a chance of losing some trees/accessions due to infestation of this pest in spite of best remedial measures. Hence, it is prudent to have representative collection in an additional conservation block.
Core collection – earlier efforts
Different methodologies have been deployed for making core collection in many crops. Initially, stratified random sampling (Peeters and Martinelli, Reference Peeters and Martinelli1989; Chandra et al., Reference Chandra, Huaman, Hari Krishna and Ortiz2002; Franco et al., Reference Franco, Crossa, Taba and Shands2003) and genetic distance sampling (Jansen and van Hintum, Reference Jansen and van Hintum2007) were most widely used methods. However, these methods have led to inequality in diversity estimates by skewing the quantitative trait variances in the core collections. In order to address this problem, approach like maximization strategy (Bataillon et al., Reference Bataillon, David and Schoen1996; Marita et al., Reference Marita, Rodriguez and Nienhuis2002; Schoen and Brown, Reference Schoen and Brown1993, which selects specific combinations of accessions to ensure retention of maximum diversity, had been developed. Further, MSTRAT programme (Gouesnard and Bataillon, Reference Gouesnard and Bataillon2001) that uses the criterion of richness and highest sum of squares of active variables based on maximization strategy to select subsets has been found powerful in making core collection. However, in recent years, heuristic approach with advanced maximization strategy (Kim et al., Reference Kim, Chung, Cho, Ma, Chandrabalan, Gwag, Kim, Cho and Park2007) is gaining significance as it develops core collection representing all observation classes with least allelic redundancy ensuring a highly reproducible list of entries. This method has been successfully deployed in crops like rice (Chung et al., Reference Chung, Kim, Chung, Lee, Lee, Dixit, Kang, Zhao, McNally, Hamilton, Gwag and Park2009), mung bean (Moe et al., Reference Moe, Gwag and Yong2012), dolichos bean (Vaijayanthi et al., Reference Vaijayanthi, Ramesh, Byre Gowda, Mohan Rao and Keerthi2015a, Reference Vaijayanthi, Ramesh, Byre Gowda, Mohan Rao, Gowda, Ramappa, Keerthi and Rajendra Prasadb), foxtail millet (Gowda et al., Reference Gowda, Krishanappa, Pathak, Mathur and Seetharam2013) and soybean (Gireesh et al., Reference Gireesh, Husain, Shivakumar, Satpute, Kumawat, Arya, Agarwal and Bhatia2015). Keeping this in view, in the present study, the heuristic approach with advanced maximization strategy was followed for making core collection in cashew.
Material and methods
The gene bank at the ICAR-Directorate of Cashew Research houses the largest germplasm repository of the country. In the NCFGB, 539 clonal accessions are collected from different parts of India including Andaman and Nicobar Islands and other countries during 1986–2016. The characterization and evaluation of 478 accessions (up to 2003 planting) with six softwood grafts per accession at spacing of 6 m × 6 m was done after six annual harvests by referring ‘Cashew Descriptors’ published by IBPGR (presently the Bioversity International) (IBPGR, 1986). A total of 68 characters, both quantitative (27) and qualitative characters (41), were recorded on these accessions. Colour of mature cashew apple was recorded by referring RHS colour chart (Anonymous, 1995). The evaluated accessions are maintained as active collections in the field gene bank with four softwood grafts per accession at spacing of 4 m × 4 m under rainfed conditions by adopting recommended package of practices. The characterization data of these accessions were compiled in ‘Catalogue of Minimum Descriptors of Cashew (Anacardium occidentale L.) Germplasm Accessions-I, II and III’ and were published (Swamy et al., Reference Swamy, Bhaskara Rao and Bhat1997; Reference Swamy, Bhaskara Rao and Bhat1998, Reference Swamy, Bhaskara Rao and Bhat2000). The Catalogues-IV and V were published during the years 2014 and 2015 (Nayak et al., Reference Nayak, Mohana, Bhat, Saroj and Swamy2014, Reference Nayak, Mohana, Bhat, Saroj, Swamy and Bhat2015).
The data on 478 accessions with 68 characters were subjected to heuristic analysis with advanced maximization strategy using PowerCore v.1.0 software (Kim et al., Reference Kim, Chung, Cho, Ma, Chandrabalan, Gwag, Kim, Cho and Park2007) developed at the Genetic Resource Division, National Institute of Agricultural Biotechnology, Rural Development Administration, Republic of Korea. This software basically classifies continuous variables into different categories based on Sturges rule (K = 1 + log2n where n = number of observed accessions, Sturges, Reference Sturges1926). Upon classification, the software considers all classes for selection of representative accessions from each class with least redundancy and the list of entries is highly reproducible. Using this, a core collection of 49 accessions (10.25% of the accessions) was generated which will be referred to as power core.
To compare the efficiency of heuristic approach with other methods of establishing core collection, K-Means clustering was also done using IBM-SPSS Statistics V. 20 to generate 10 clusters. The number of clusters in this method was arrived after testing the criterion of minimum variance within cluster and maximum variance between clusters by analysis of variance, and the variance of at least 50% of the characters is significantly different across the clusters. From each cluster, 10% of the accessions proportional to cluster size (22, 98, 4, 29, 67, 87, 20, 5, 76, 70 accessions, respectively, in 1–10 clusters) were randomly selected and pooled to form the core collection. Through this method also, there were 49 accessions forming the core and this core will be referred to as cluster core. In fact, Brown (Reference Brown, Hodgkin, Brown, Van Hintum and Morales1995) suggested 10% sample size from each cluster so that 70% of the extant alleles could be drawn with 95% certainty.
In order to validate the efficiency of the core collection in representing the entire collection, parameters like mean difference (MD%), variance difference (VD%), coincidence rate (CR%), variable rate (VR%) and class coverage (CC%) for quantitative characters (formula of each given below) and Shanon–Weaver diversity and Nei's diversity indices generated by Powercore software for qualitative characters were considered (Shannon and Weaver, Reference Shannon and Weaver1949; Nei, Reference Nei1978).
 $${\rm Mean\; difference} - {\rm MD}\; (\% ) = \displaystyle{1 \over m}\; \; \; \mathop \sum \limits_{\,j = 1}^m \displaystyle{{{\rm Me} - {\rm Mc}} \over {{\rm Mc}}}\; \times 100$$
(Me = mean of each trait in the entire collection; Mc = mean of each trait in the core collection; m = number of the variables).
 $${\rm Variance\; difference} - {\rm VD}\; (\% ) = \displaystyle{1 \over m}\; \; \; \mathop \sum \limits_{\,j = 1}^m \displaystyle{{{\rm Ve} - {\rm Vc}} \over {{\rm Vc}}}\; \times 100$$
(Ve = variance of each trait in the entire collection; Vc = variance of each trait in the core collection).
 $${\rm Coincidence\; rate} - {\rm CR} \,(\% ) = \displaystyle{1 \over m}\; \; \; \mathop \sum \limits_{\,j = 1}^m \displaystyle{{{\rm Rc}} \over {{\rm Re}}}\; \times 100$$
(Rc = range of each trait for the entire collection; Rc = range of each trait for the core collection).
 $${\rm Variable\; rate} - {\rm VR}\, (\% ) = \displaystyle{1 \over m}\; \; \; \mathop \sum \limits_{\,j = 1}^m \displaystyle{{{\rm CVc}} \over {{\rm CVe}}}\; \times 100$$
(CVc = coefficient of variation of trait for the core collection and CVe = coefficient of variation of trait for the entire collection).
 $${\rm Class\; coverage}\,(\% ) = \displaystyle{1 \over m}\; \; \; \mathop \sum \limits_{\,j = 1}^m \displaystyle{{{\rm Dc}} \over {{\rm De}}}\; \times 100$$
(Dc = number of classes occupied in the core collection and De = number of classes occupied in the entire accession in each character).
To confirm the representativeness of the core collection, it is prescribed that MD% should be smaller than 20% and CR% should be more than 80%. Larger VD% and VR% should also be there to reflect the representativeness of the core collection with respect to the entire collection (Hu et al., Reference Hu, Zhu and Xu2000; Kim et al., Reference Kim, Chung, Cho, Ma, Chandrabalan, Gwag, Kim, Cho and Park2007). Further, the CC% based on qualitative traits in the core collection with reference to the entire collection should be more than 80%.
The χ 2 test is used as an alternative to see whether qualitative traits are adequately represented in the core. Here the expected number of accessions is derived with reference to the core size and the number of accessions in different categories of traits in the entire collection. Principal component analysis (PCA) deploying 27 quantitative characters was also carried out to assess the segregation patterns of the entire, power core and cluster core collections. Further, variance, mean and frequency distribution of quantitative traits in both the entire and core collections were arrived using Descriptive Statistics option of IBM SPSS Statistics version 20. The significance of variance of different characters between the entire and core collections was tested using F-test. Similarly, the significance of mean was tested deploying two-sample t-test assuming unequal variances. In addition, skewness, kurtosis and coefficient of variation of characters were derived using descriptive statistics option of Microsoft Excel.
Results
(a) Validation parameters in the power core and cluster core collections
The results revealed that the MD (%) between the entire and core collections was 4.94 in the power core and −0.87 in the cluster core (Table 1). It was observed that the power core has more CR% (95.37) compared with the cluster core (69.09). The VD% and VR% values of the power core were 41.01 and 129.54, and cluster core were 6.16 and 97.35, respectively. Further, accessions from respective classes of all quantitative traits are represented in the power core collection. This is indicated by the CC% of quantitative characters and it was 100% in the power core collections with reference to the entire collection. As far as qualitative characters are concerned, in the cluster core, only 29 out of 41 characters retained the categories similar to that of the entire collection and the CC% worked out to be 88%. However, in the power core, the accessions could be grouped into all character categories similar to that of the entire collection and the CC% worked out to be 100%.
(b) Pattern of segregation in the core collections
Table 1. Validation parameters

In the PCA graphs (Fig. 1), spatial representation of the power core accessions showed better segregation and the first two axes accounted for 43.73% variability. Whereas, the segregation of accessions in the cluster core is weaker compared with the power core and the first two axes accounted for 37.69% variability. In case of the entire collection, only 37.45% of the variability was accounted by first two axes.
(c) Variance, mean and frequency distribution of traits in the entire and core collections
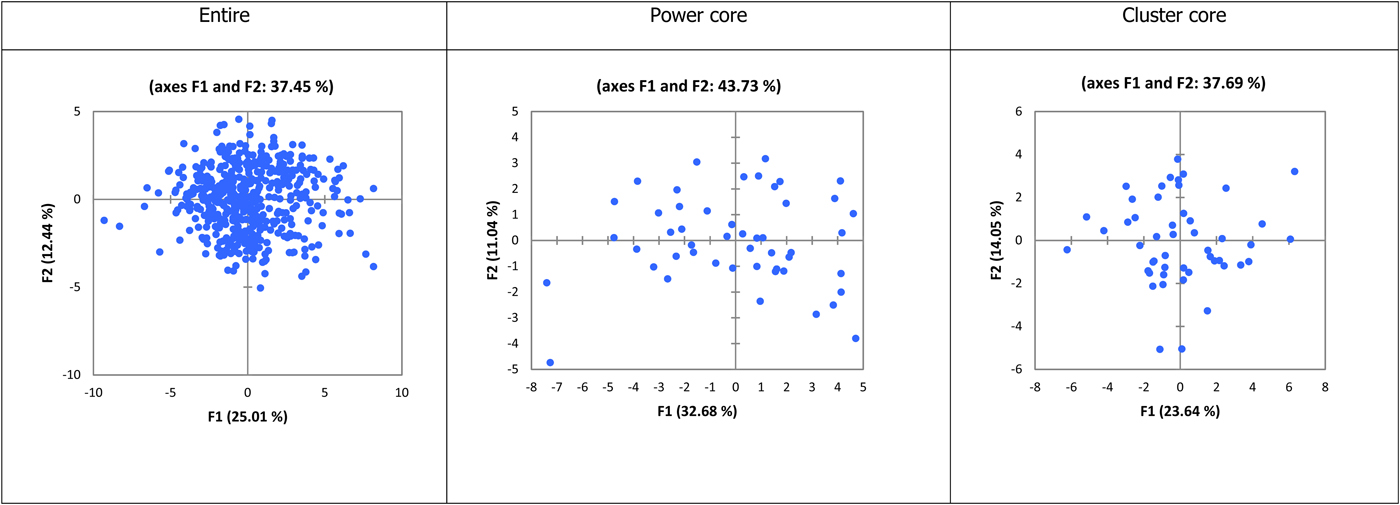
Fig. 1. PCA graphs depicting spread of the entire and core collections.
Out of 27 quantitative characters, the variances of 22 characters in the power core collections were significantly different from respective variances in the entire collection (Table 2). However, when the cluster core and entire collection variances were compared, only one was found to be significant. Whereas, between the power core and cluster core collections, the variances of 18 characters were significant.
Table 2. Variance of the entire and core collections

The mean values of 27 quantitative charterers between the power core and entire collections did not significantly differ except for the character sex ratio (Table 3). At the same time, the mean values of these quantitative characters also did not differ significantly between the cluster core and entire collections. However, when the mean values of these characters between the power core and cluster core were compared, significant difference was found for sex ratio and flowering duration, the mean values of both characters being higher in the power core collection. For qualitative characters, higher or equal Shannon–Weaver and Nei's diversity values were observed for 39 out of 41 qualitative characters in the power core collection compared with the entire collection. When the power core and cluster core were compared, 38 in Shanon–Weaver and 36 in Nei's diversity indices of qualitative characters in the power core collections were higher or equal to the cluster core collections (Table 4).
Table 3. Mean of the entire and core collections

Table 4. Diversity indices for the entire and core collections

The ‘t’-test revealed that means of Shannon–Weaver and Nei's diversity indices of the entire, power core and cluster core collections for these qualitative characters were not significantly different from each other. The results of χ 2 test for observed and expected frequencies of accessions for traits revealed that it was significant for only four characters (10.81%) in the power core collection and non-significant for all the characters in the cluster core collections.
Frequency distribution patterns of quantitative traits (online Supplementary Table S5 and Fig. 2) showed that skewness values did not differ for 17 out of 27 characters in the power core and cluster core collections when compared with the values of entire collection. The kurtosis values for 23 characters were unaltered in the power core and the values for 11 characters were unaltered in the cluster core when compared with the kurtosis values of characters in the entire collection.
(d) Geographic representation of the entire and core collections
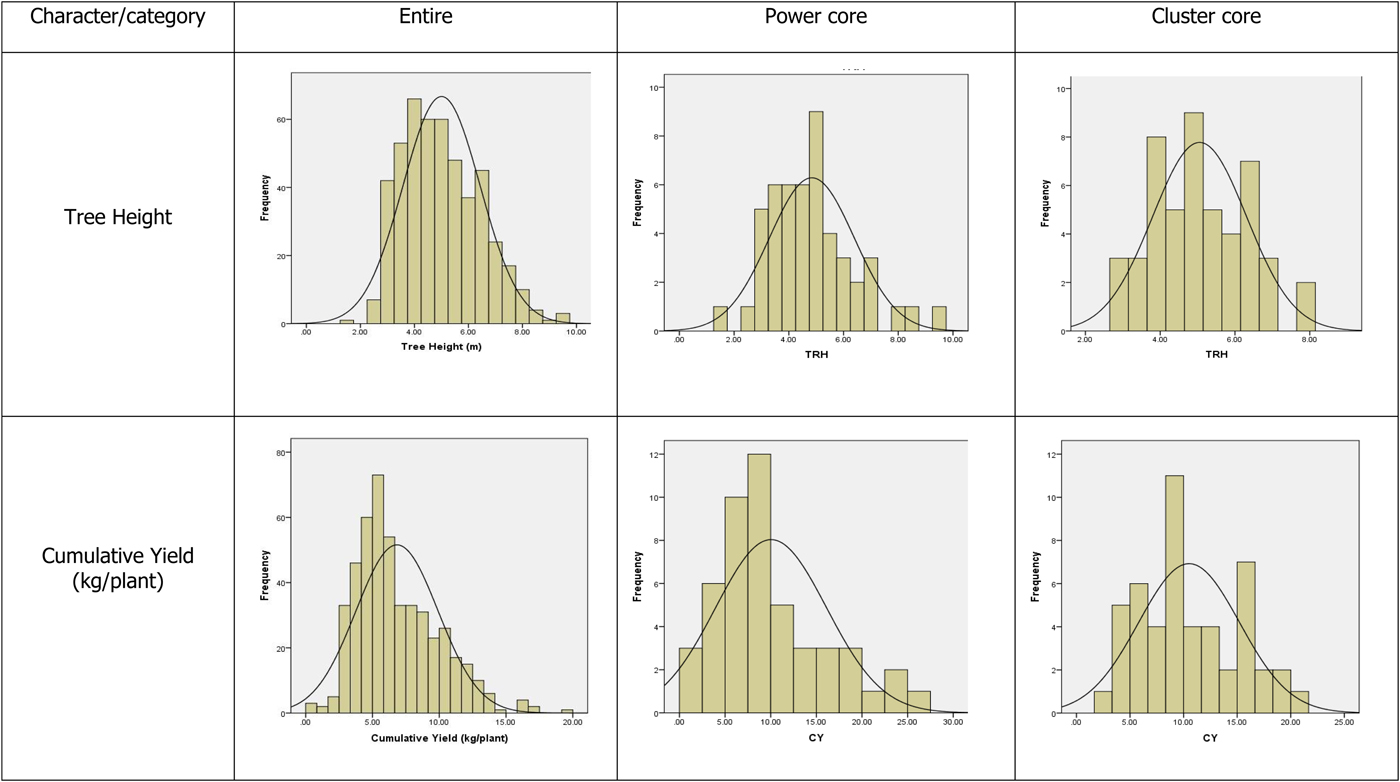
Fig. 2. Frequency distribution pattern of characters in the entire and core collections.
The geographic origin of the entire and core collections is depicted in online Supplementary Table S6. In the entire collection, maximum number of accessions were from Karnataka (24.69%) followed by Andhra Pradesh (21.34%) and Kerala (14.44%). Whereas in the power core, it is in the order of Kerala and Maharashtra (Both 20.41%), Karnataka (16.33%) and Andhra Pradesh (14.29%), and in the cluster core, it is Andhra Pradesh (32.65%) followed by Karnataka (22.45%) and Kerala (14.29%). However, West Bengal collections that are represented in the power core are not represented in the cluster core collection.
Discussion
The MD (%) between the entire and core collections in both the power core and cluster core were less than the prescribed limit of 20% to infer that the core collections derived are really efficient. The CR% represents the range of different characters in the core collection with reference to the entire collections and it should be more than 80% (Hu et al., Reference Hu, Zhu and Xu2000; Kim et al., Reference Kim, Chung, Cho, Ma, Chandrabalan, Gwag, Kim, Cho and Park2007). Accordingly, it was observed that the power core has more CR% compared with the cluster core, and hence the power core is more efficient compared with the cluster core. As per the criteria, larger the values of VD% and VR%, the more the extent to which the core collection represents the entire collection. The VD% and VR% values indicated that the power core has higher values for these parameters, and hence the power core is an efficient representative of the entire collection compared with the cluster core. The CC% for quantitative traits in the power core was maximum. The CC% is not applicable to the cluster core because it is derived out of random allocation of accessions from all clusters resulted due to K-Means clustering.
With respect to qualitative characters, the CC% in the cluster core was less than the power core with reference to the entire collection. So it is evident that the power core collection is efficient in terms of retaining classes and hence diversity present in the entire collection. The segregation of accessions in the cluster core is weaker compared with the power core as evident by the variability accounted through first two axes and their graphical representation. This indicates that the power core accessions are divergent from each other, and hence they retain maximum diversity with minimum accessions compared with the cluster core.
The ‘F’-test clearly indicated the higher variance level in the power core collections compared with either cluster core or entire collection. This is expected because of reduction in redundancy of accessions and effective stratification in the power core collection. The mean values of 27 quantitative charterers between the power core and entire collections did not significantly differ except for the character sex ratio. This shows the efficiency of heuristic approach in making core collections. As far as Shannon–Weaver and Nei's diversity values are considered, several workers infer that the core collections with comparable diversity indices in relation to the entire collection can be considered as representatives (Upadhyaya et al., Reference Upadhyaya, Ortiz, Bramel and Singh2003; Dwivedi et al., Reference Dwivedi, Puppala, Upadhyaya, Manivannan and Singh2008; Upadhyaya et al., Reference Upadhyaya, Pundir, Dwivedi, Gowda, Reddy and Singh2009; Vaijayanthi et al., Reference Vaijayanthi, Ramesh, Byre Gowda, Mohan Rao and Keerthi2015a, Reference Vaijayanthi, Ramesh, Byre Gowda, Mohan Rao, Gowda, Ramappa, Keerthi and Rajendra Prasadb). However, Odong et al. (Reference Odong, Jansen, van Eeuwijk and van Hintum2013) deduced that higher the diversity index, higher is the retention of diversity by the core collection. So it is evident that the power core collections with higher or equal values of these diversity indices in comparison to the entire collection reflect better diversity compared with the cluster core collections. However, ‘t’-test indicated that means of Shannon–Weaver and Nei's diversity indices of the entire, power core and cluster core collections for these qualitative characters were not significantly different from each other. This is also conformity with the inference of Vaijayanthi et al. (Reference Vaijayanthi, Ramesh, Byre Gowda, Mohan Rao and Keerthi2015a, Reference Vaijayanthi, Ramesh, Byre Gowda, Mohan Rao, Gowda, Ramappa, Keerthi and Rajendra Prasadb) that mean Shannon–Weaver and Nei's diversity indices in the core collections should be comparable to that of the entire collection. The results of χ 2 test revealed that the percentage of significant characters in both collections is well below the prescribed 20% (Vaijayanthi et al., Reference Vaijayanthi, Ramesh, Byre Gowda, Mohan Rao and Keerthi2015a, Reference Vaijayanthi, Ramesh, Byre Gowda, Mohan Rao, Gowda, Ramappa, Keerthi and Rajendra Prasadb), and hence it can be concluded that both core collections represent the entire collection when qualitative characters are considered.
The results of frequency distribution patterns of quantitative traits indicated that the patterns of the entire collection are more or less retained in the power core collection. Further, coefficient of variation values were higher for the power core collections compared with the entire and cluster core collections, which clearly indicated that the power core collections possess more diversity compared with the entire or cluster core collections.
When the geographic representation of the entire and core collections are considered, it appears that the Kerala and Maharashtra collections are more diverse compared with the collections from other states. Karnataka and Andhra Pradesh accessions are also quite divergent as indicated by their share in the power core collection. Tamil Nadu, Orissa, Brazil and West Bengal collections seem to be less divergent as their representation is very less in the power core collection. It is worthwhile to note that the Pondicherry and Mozambique collections represented in the entire collection are not represented both in the power core and cluster core collections. However, West Bengal collections that are represented in the power core are not represented in the cluster core collection.
Conclusion
From the validation parameters, patterns of segregation, and variance, mean and frequency distribution of traits in the core collections compared with the entire collection, it is evident that the power core collection generated through heuristic approach is very effectively capturing the diversity present in the entire collection. Hence this core, because of its small size and less number of duplicates, can be gainfully utilized as working collection for cashew germplasm conservation and crop improvement programmes. These accessions can be evaluated in different environment conditions to identify widely/specifically adapted stable accessions, which further can be utilized in cashew improvement. This is the first ever attempt of use of advanced M strategy with heuristic approach in cashew, which is one among the plantation crops of India and this can be profitably extended to other plantation crops as well.
Since morphometric characters are used in the study, there is an inherent phenomenon of genotype × environment interaction on the expression of characters. Therefore, the accessions in the core collection may not be genetically representing the diversity present in the entire collection. This can be circumvented through deployment of molecular markers for the development of molecular core collection from the entire collection, which will throw light on the genuineness of the core collection designated using morphological characters.
Supplementary material
The supplementary material for this article can be found at https://doi.org/10.1017/S1479262118000035
Acknowledgement
The authors thank Dr S. Ramesh, Professor, Department of Genetics and Plant Breeding, University of Agricultural Sciences, Bangalore, India for his inputs in data analysis
Conflict of interest
The authors declare that they have no conflict of interest.


