Introduction
Over the past two decades, research in the field of endocrine disrupting chemicals (EDCs) has gained substantial momentum. It is now generally accepted that exposure to EDCs, which are ubiquitously present in the environment, increases the risk of endocrine-related disorders in humans and animals.Reference Gore, Chappell and Fenton 1 The United States Environmental Protection Agency and the Endocrine Society have described EDCs as exogenous chemicals that can disrupt any aspect of hormone action.Reference Kavlock, Daston and DeRosa 2 , Reference Zoeller, Brown and Doan 3 These EDCs include man-made synthetic chemicals like bisphenol A (BPA) to which we are exposed through what we eat, drink and touch.Reference Stahlhut, Welshons and Swan 4 BPA exposure has been associated with increased risk of various health abnormalities including metabolic disorders like diabetes and obesity in humans and animals.Reference Shankar and Teppala 5 – Reference Alonso-Magdalena, Morimoto, Ripoll, Fuentes and Nadal 11
A substantial body of evidence has now emerged suggesting that EDCs not only affect the health of the directly exposed population, but also of subsequent generations. This has profound implications for public health; even though a chemical may no longer be used, the effects may persist across future generations. The reported transgenerational (the affected generation is not directly exposed to the studied chemical) effects of EDCs impact the function of multiple tissues, including brain, heart, prostate and testis, that consequently influence behavioral, cardiac and reproductive outcomes.Reference Anway, Cupp, Uzumcu and Skinner 12 – Reference Lombo, Fernandez-Diez and Gonzalez-Rojo 21 A few of these studies have reported transgenerational effects of BPA on mammalian or non-mammalian systems.Reference Wolstenholme, Goldsby and Rissman 17 , Reference Bhandari, vom Saal and Tillitt 18 , Reference Wolstenholme, Edwards and Shetty 22 For example, embryonic exposure to BPA has recently been shown to reduce fertilization rates in second generation offspring, and embryo survival in third-generation offspring of Japanese rice fish, medaka (Oryzias latipes).Reference Bhandari, vom Saal and Tillitt 18 In rodents, developmental BPA exposure has been associated with social recognition and behavioral differences across three generations,Reference Wolstenholme, Goldsby and Rissman 17 , Reference Wolstenholme, Edwards and Shetty 22 and a recent study reported transgenerational differences in gene expression and methylation of imprinted genes in brains of BPA-exposed mice offspring.Reference Drobna, Henriksen and Wolstenholme 23 However, the transgenerational effects of BPA on metabolic health have not been widely studied. One study demonstrated that intraperitoneal injection of BPA (50 mg/kg/day) in combination with other plastic derived EDCs such as bis (2-ethylhexyl) phthalate (DEHP) (750 mg/kg/day) and dibutyl phthalate (DBP) (66 mg/kg/day) from 8 to 14 days of gestation was associated with an obesity-like phenotype across three generations in male and female rat offspring.Reference Manikkam, Tracey, Guerrero-Bosagna and Skinner 24 Since the F2 and F3 generation in that study were generated by breeding exposed and affected F1 and F2 males and females, it was unclear whether the transmission was via the maternal/paternal line, and if parental phenotypes influenced the offspring outcomes.
We previously demonstrated, using C57BL/6J mice, that maternal (F0) exposure to human-relevant doses of BPA (10 μg/kg/day, and 10 mg/kg/day) has multigenerational sex-specific effects, such that the first- (F1) and second-generation (F2) adult female offspring were unaffected, but adult F1 and F2 male offspring had increased percent body fat, were glucose intolerant and had reduced glucose-stimulated insulin secretion (GSIS).Reference Susiarjo, Xin and Bansal 25 Using the same model, we recently reported multigenerational effects on pancreatic islets.Reference Bansal, Rashid and Xin 26 Interestingly, female offspring were unaffected, but male offspring of both doses had impaired β-cell function and increased pancreatic inflammation across two generations.Reference Bansal, Rashid and Xin 26 We now extend our analysis to the third generation (F3) to determine the transgenerational effects of maternal BPA exposure via maternal transmission on metabolic health and pancreatic islets of the offspring in this model.
Materials and methods
Experimental paradigm
Design
The animal work was conducted with the approval of the University of Pennsylvania Institutional Animal Care and Use Committee. The animals were treated humanely with due consideration to the alleviation of distress and discomfort. The animals used in this study were the third generation of the cohorts described previously.Reference Susiarjo, Xin and Bansal 25 , Reference Bansal, Rashid and Xin 26 Refer to Supplemental Figure 1 for breeding strategy. Briefly, C57BL/6J virgin female mice (F0) were purchased from Jackson Laboratory and randomly assigned to the following BPA supplemented, or control feed from 2 weeks prior to mating (preconception) until weaning: 10 μg/kg/day (LowerB), 10 mg/kg/day (UpperB) BPA, or 7% corn oil (Control). After weaning, the offspring and the subsequent generations were maintained on control diet (7% corn oil diet; TD 95092; Envigo), and therefore, no subsequent generation was exposed to BPA via food. Multiple independent cohorts of first generation (F1) female offspring were crossed with unexposed C57BL/6J males (8–10 weeks old C57BL/6J males purchased from Jackson laboratory and acclimated for 1 week in the same housing facility prior to mating) to generate second-generation (F2) offspring and, similarly, F2 females were crossed with unexposed C57BL/6J males to generate the third generation (F3). F1 offspring were exposed to BPA during gestation and lactation via F0 mothers, and F2 offspring were exposed as germ cells of F1 during gestation and lactation. F3 generation never had any direct/indirect BPA exposure.
Animal generation and cohorts
Similar to our multigenerational study,Reference Bansal, Rashid and Xin 26 the end points measured in this study were from the third generation of the animals that were previously generated across multiple cohorts in two different animal care facilities with a control group included in all cohorts (refer to Supplemental Figure 2 for animal generation). Because each cohort had all three groups, any ambient BPA exposure would be consistent across all three groups. There was no difference in litter size, sex ratio across all three groups, and the litters were not culled.
Doses
As described previously, the control diet was a modified, low phytoestrogen, AIN 93G diet (TD 95092, Envigo, with 7% corn oil substituted for 7% soybean oil to minimize exposure to other estrogen-like compounds that could confound BPA-related effects), and BPA diets included 50 μg BPA/kg diet (lower dose BPA; TD 110337; Envigo) and 50 mg BPA/kg diet (upper dose BPA; TD 06156; Envigo) supplemented into the control diet to approximate exposures of 10 μg and 10 mg BPA per kg body weight per day.Reference Dolinoy, Huang and Jirtle 27 , Reference Susiarjo, Sasson, Mesaros and Bartolomei 28 These doses result in levels of exposure that are below the established doses for BPA in humans: lowest observed adverse effect level (LOAEL; 50 mg/kg/day), and the tolerable daily intake (TDI; 50 μg/kg/day; estimated from the LOAEL) defined by the United States Environmental Protection Agency. 29 Moreover, we have assessed circulating levels of unconjugated BPA in F0 maternal serumReference Susiarjo, Sasson, Mesaros and Bartolomei 28 and found levels to be comparable to those of humans.Reference Schonfelder, Wittfoht and Hopp 30 , Reference Vandenberg, Hauser, Marcus, Olea and Welshons 31 It is important to note that our control group also had detectable levels of BPA; this was not surprising because BPA is everywhere. However, the levels in Lower and Upper group were higher than the Controls, thus reassuring that the BPA exposure was from the BPA supplemented feed. Finally, animals were reared in BPA-free cages with BPA free bedding and BPA free water supply.
Assessment time points
Weekly body weights were measured from postnatal day (PD) 1–21 weeks of age in F3 offspring. Weekly food intake was measured in mothers throughout pregnancy until weaning, and in male and female offspring from weaning until adulthood. The offspring food intake was estimated from same-sex group-housed cages (three to four same-sex mice per cage) and calculated by dividing weekly food consumption per cage with average body weight per cage (average body weight per cage = (sum of offspring body weight/number of mice per cage)).
The animals were euthanized by CO2 euthanasia. All terminal tests were performed in 21-week-old adult offspring, with the exception of β-cell proliferation and cell death, which were assessed at PD 7 and 14, respectively. At these early postnatal time points, β cells undergo extensive remodeling that is critical for establishing the adult β-cell mass and proliferation after this age is negligible.Reference Scaglia, Smith and Bonner-Weir 32 – Reference Swenne 35 The experiments were blinded, where possible (dual-energy X-ray absorptiometry (DEXA) scans, immunohistochemistry and Luminex assay). For body weight and glucose tolerance, n = 10–12 litters per group were used, for islet-specific studies n = 5–6 litters per group were used. Metabolic tests including body weight, glucose tolerance, fasting insulin and GSIS were determined in both male and female offspring. We observed no metabolic phenotype in female offspring; therefore, all other experiments were restricted to male offspring only.
Glucose tolerance test (GTT) and fasting insulin
Glucose tolerance was assessed at 21 weeks of age (adult F3 offspring) in male and female mice that were fasted for 6 h, and subsequently injected with 2 g/kg body weight of glucose intraperitoneally. At 0, 15, 30, 60 and 120 minutes, blood was sampled from the tail vein and analyzed by a handheld glucometer. Fasting insulin levels were measured in terminal serum samples collected at 21 weeks of age (adult F3 male and female offspring), or at day 17 of gestation (pregnant F2 females) from mice by homogeneous time-resolved fluorescence technology using mouse serum insulin assay kit (Cisbio).
Dual-energy X-ray absorptiometry (DEXA)
To assess body composition, DEXA scans were performed (GE Lunar PIXImus x-ray densitometer) on a subset of adult male (21 weeks of age) F3 mice as previously described.Reference Chen, Wilson, Khaksari, Cowley and Enriori 36 Briefly, each mouse was anesthetized using isoflurane throughout the duration of the scan (~5 minutes), and body fat, lean mass, bone mineral content and bone mineral density measures were recorded.
Islet isolation
F3 adult mice were anesthesized with ketamine and xylazine, and pancreata were perfused with Hanks’ balanced salt solution (Life Technologies) supplemented with 2.5% bovine serum albumin (BSA) (wt/vol; Sigma), 0.35 g/L NaHCO3 (Sigma), and 2 mg/ml Collagenase P (Roche); excised; and incubated at 37°C for 10–15 min. After digestion, islets were washed and then purified using a Histopaque 10771 and Histopaque 11191 (Sigma) gradient. One mouse per litter was randomly selected as a litter representative. More than one islet-specific end point was determined for each litter, where possible.
Insulin measurement and islet perifusion study
Isolation of pancreatic islets, perifusion and insulin assays were performed as previously described.Reference Li, Chen and Palladino 37 In brief, islets were isolated by collagenase digestion and cultured with 10 mM glucose in RPMI 1640 medium (Sigma) for 2 days. After isolation, islets were perifused with a Krebs-Ringer bicarbonate buffer containing 0.25% BSA at a flow rate of 1 ml/min. Ramps at increments of 0.5 mM/min for glucose were performed. Thirty millimolar potassium chloride was used to determine maximum insulin release. Insulin was measured in the perfusates by homogeneous time-resolved fluorescence technology (Cisbio Kit).
Histology
After euthanasia, pancreata were excised and fixed in 10% formalin (pH 7.0) for 48 h at room temperature and embedded in paraffin (Tissue-Tek, 4583). Six sections of 5-µm thickness, 200 µm apart were selected for immunohistochemical (IHC) and immunofluorescence (IF) staining per animal. The pancreatic sections from 21 weeks old male mice were immunostained for F4/80 (Invitrogen), or CD3 (Santa Cruz) to determine macrophages and T-lymphocytes respectively, as described previously.Reference Bansal, Rashid and Xin 26 The sections were also IF stained with insulin (Dako), glucagon (BioGenix) and somatostatin (BioRad) to determine beta, alpha, delta cell mass respectively, as described previously.Reference Bansal, Rashid and Xin 26 The nuclei were stained using 4′,6-diamidino-2-phenylindole (DAPI) (Sigma). The details of antibodies used for IHC, and IF staining are provided in Supplemental Table 1.
Table 1 Changes in cytokine/chemokine levels on a LUMINEX assay in pancreatic lysates of F3 adult male offspring. Data are normalized to total protein concentration as pg of cytokine or chemokine per µg of total protein, and presented as mean (SEM). P values are from Dunnett’s test performed on log-transformed data, where required (interleukin (IL)-1β, IL-12p70, IL-4, IL-5, IL-10, IL-13, IL-15, IP-10, IFN-γ, G-CSF, MIP-2). N = 4 litters per group. Information in columns 7, 8 and 9 is derived from Refs.72–77

The slides were digitally scanned at 20× magnification on an Aperio Scanscope CS-O (brightfield) and Scanscope IF (fluorescent) (Leica Biosystems). Non-fluorescent staining was analyzed by ImageScope v12.2.2.5015 (Leica Biosystems) using Aperio- Color Deconvolution v9.1 algorithm. Area of CD3 and F4/80 staining was calculated within islets, pancreatic lymph nodes and non-islet tissue by multiplying percent positive staining with total stained area and the product was normalized to total analysis area. Fluorescent staining was analyzed by HALO v2.0.1018 (Indica Lab) using Indica Labs- Area Quantification FL v1.0 algorithm. Individual islets were identified as insulin surrounded by glucagon and somatostatin staining, and islet size was estimated by sum of the area occupied by beta, alpha and delta cells for individual islets. Beta, alpha, delta cell mass was calculated by multiplying the average insulin, glucagon, and somatostatin stained area respectively within each islet relative to the total area scanned with the pancreatic weight and corrected for body weight measured at tissue harvest.
Islet cell death and proliferation
To determine cell death, lysates from freshly isolated islets from 2-week-old F3 male mice were assessed using the caspase 3 activity fluorometric assay (Abcam) following manufacturer’s instructions. To determine β-cell proliferation, four pancreatic sections, 100 µm apart per animal from 7-day-old male mice were immunofluorescently stained for Ki67 (Abcam), Insulin (Dako) and DAPI (Sigma). Sections were analyzed by HALO v2.0.1018 (Indica Lab) using Indica Labs – Cytonuclear FL v1.0 algorithm. Percent positive proliferating β cells were calculated as percent Ki67 and insulin-positive cells. The details of antibodies used for IHC, and IF staining are provided in Supplemental Table 1.
Cytokine measurement
The cytokine and chemokine panels were measured in 25 µL pancreatic lysates of 21–week-old mice in duplicates using the mouse Cytokine/Chemokine Luminex 25plex Assay with a detection limit of 3.2 pg/ml to 10,000 pg/ml (EMD Millipore), as described previously.Reference Jaeckle Santos, Li and Doulias 38 transforming growth factor beta 1 (TGF-β) levels were determined using 50 µl of pancreatic lysates in duplicates by a U-plex TGF-β Combo mouse kit with a detection limit of 37–56,600 pg/ml (TGF-β1), 2.5–45,400 pg/ml (TGF-β2), and 2.5–45,800 pg/ml (TGF-β3) (Meso Scale Discovery). For statistical evaluation, lowest detection limit was used for samples that had values below the detection sensitivity. Cytokine levels were normalized to total protein concentration measured by BCA assay (Pierce).
Statistical analysis
For parametric data, the groups were compared by one-way analysis of variance (ANOVA), followed by post hoc Dunnett’s test between each BPA group and control to account for multiple testing. Non-parametric data were log-transformed to approximate a standard distribution, where required, and then analyzed by one-way ANOVA and post hoc Dunnett’s test. All values are presented as mean with scanning electron microscope (SEM). A P value of <0.05 was considered significant. All data were analyzed using JMP and Prism analysis software.
Results
Sex-specific effect of F0 maternal BPA exposure on body weight of F3 adult mice offspring
Previously, we reported that F1, but not F2, offspring of F0 BPA exposed mothers were lighter at birth, however, both F1 and F2 were heavier and fatter in adulthood relative to Controls.Reference Susiarjo, Xin and Bansal 25 This effect was observed in male offspring only.Reference Susiarjo, Xin and Bansal 25 Here, we tested whether these changes persist in the F3 generation. Similar to our F2 findings, we observed no difference in birth weight in LowerB and UpperB F3 male offspring (Fig. 1). However, the obesity phenotype observed in adult F1 and F2 males persisted into the third generation and LowerB and UpperB F3 male offspring were heavier in adulthood, although this difference did not become apparent until 5 months of age (Fig. 1), which is 6 weeks later than the observed phenotype in F1 and F2.Reference Susiarjo, Xin and Bansal 25 We determined body composition of these animals via DEXA scans, and LowerB F3 males had modestly increased fat mass (Mean ± SEM g: Control = 5.5 ± 0.61; LowerB = 7.6 ± 0.61, P = 0.04; UpperB = 7.1 ± 0.61, P = 0.13; n = 11 litters per group), which was not statistically different when corrected for body weight (i.e., percent body fat) relative to controls (Fig. 1). Despite increased body weight, UpperB F3 male offspring had no difference in either fat mass or percent body fat but trended towards increased bone mineral density relative to Controls (Fig. 1). Consistent with our previous findings, we saw no difference in body weight from birth to adulthood in LowerB and UpperB F3 female offspring (Supplemental Figure 3). We observed no difference in food intake between the groups in either sex (Supplemental Figure 4).

Fig. 1 Postnatal body weight and body composition of F3 male offspring. (a) Postnatal day (PD) 1 body weight, (b) body weight at 21 weeks of age, (c) % body fat at 21 weeks of age and (d) bone mineral density at 21 weeks of age. Data are individual litter data (n = 11 litters per group) with mean superimposed, and analysed using Dunnett’s test. P values are relative to Control.
F0 maternal BPA exposure increased GSIS from pancreatic islets in a sex- and dose-specific manner
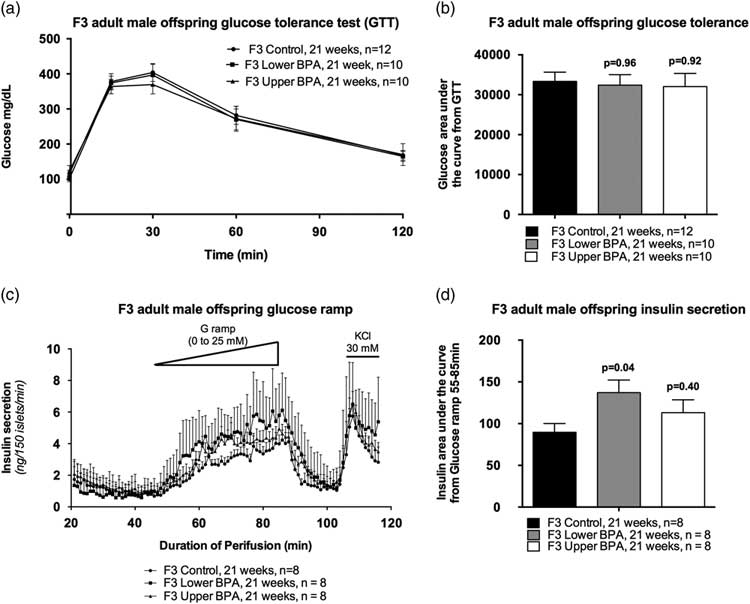
Because we observed impaired glucose homeostasis in heavy and fat F1 and F2 male offspring,Reference Susiarjo, Xin and Bansal 25 we performed GTTs to assess glucose homeostasis in adult F3 offspring. Surprisingly, we saw no differences in glucose tolerance between the groups (Fig. 2a and 2b), nor fasting insulin levels (Mean ± SEM ng/ml: Control = 0.45 ± 0.34; LowerB = 1.19 ± 0.34, P = 0.26; UpperB = 0.85 ± 0.34, P = 0.74; n = 5–6 litters per group) differed between the groups. Collectively, these data suggest that glucose tolerance and insulin sensitivity are not altered in F3 male offspring.

Fig. 2 Glucose tolerance test and insulin secretion in F3 adult male offspring. (a) Curve from glucose tolerance test, (b) Glucose area under the curve from the glucose tolerance test, (c) insulin secretion on islet perifusion with increasing concentration of glucose (from 0 to 25 mM) on a glucose ramp, potassium chloride (KCl) used as a depolarizing positive control and (d) glucose-stimulated insulin secretion determined as insulin area under the curve from time 55 to 85 min of the glucose ramp. Data are individual litter data (one animal per litter; n = 8–12 litters per group), and presented as mean + SEM, and analysed using Dunnett’s test. P values are relative to control.
Although a GTT provides a measure of glucose homeostasis, it does not provide a reliable assessment of insulin secretion. If insulin secretion from pancreatic islets is impaired, then this can increase the risk of developing glucose intolerance in the long term. Therefore, we assessed insulin secretion from pancreatic islets in response to glucose by perifusing the islets using a glucose ramp. UpperB adult F3 male offspring had comparable GSIS as controls (Fig. 2c and 2d), whereas LowerB adult F3 male offspring GSIS was increased relative to controls (Fig. 2c and 2d). Basal insulin secretion did not differ between the groups, however, the glucose concentration needed to stimulate insulin secretion is lower in the LowerB group (Fig. 2c). These data suggest that the islets of LowerB males are hypersensitive to glucose exposure.
In contrast to male F3 offspring, LowerB and UpperB adult F3 female offspring had similar glucose tolerance and GSIS (Supplemental Figure 5), and fasting insulin levels (Mean ± SEM ng/ml: control = 0.55 ± 0.17; LowerB = 0.70 ± 0.17, P = 0.75; UpperB = 0.89 ± 0.17, P = 0.29; n = 5–6 litters per group) as female Controls.
F0 maternal BPA exposure was associated with reduced pancreatic β-cell mass in a dose-specific manner in adult F3 male offspring
Increased insulin secretion from islets of F3 BPA offspring could be a result of increased numbers of insulin secreting β cells within islets. Therefore, we stained pancreatic sections with anti-insulin antibody and measured β-cell mass. F3 LowerB males had reduced, but UpperB males had comparable β-cell mass adjusted for body weight relative to controls in adulthood (Fig. 3). This reduction in β-cell mass in LowerB group was associated with a trend towards reduced islet size (Mean ± SEM µm2: control = 31309 ± 1557; LowerB = 24211 ± 2386, P = 0.07; UpperB = 26120 ± 2630, P = 0.20; n = 6 litters per group) compared to controls. We also determined changes in alpha and delta cell mass in these offspring, and observed no difference in alpha and delta cell mass adjusted for body weight between the groups in adulthood (Supplemental Figure 6).

Fig. 3 Beta cell mass, proliferation and cell death in F3 male offspring. (a–f) Representative photomicrographs of pancreatic immunofluorescent staining in 21-week-old (a–c) and 7 days old (d–f) control, lower bisphenol A (BPA) and upper BPA male mice, respectively. All images have insulin (red), and DAPI (blue). Images (a–c) have glucagon (green), somatostatin (yellow), while images (d–f) have Ki67 (green). Images are magnified at 20×. (g) Beta cell mass adjusted for body weight in 21 weeks old male offspring, (h) Percent proliferating beta cells in 7 days old male offspring, (i) Caspase 3 activity in 14 days old offspring. Data are individual litter data (one animal per litter; n = 5–6 litters per group) with mean superimposed, and analyzed by Dunnett’s test. P values are relative to control.
The rodent pancreas undergoes extensive remodeling during early neonatal life, which is critical for establishing β-cell mass in adulthood. This remodeling involves high rates of proliferation shortly after birthReference Scaglia, Smith and Bonner-Weir 32 and cell death in the neonatal period.Reference Scaglia, Cahill, Finegood and Bonner-Weir 33 – Reference Swenne 35 β-cell proliferation rates dramatically decrease after the postnatal period. Therefore, we examined whether these processes were altered shortly after birth (PD7; proliferation) and in neonatal life (PD14; caspase activity) in pancreas of LowerB F3 male offspring that had reduced β-cell mass in adult life. Although β-cell proliferation was higher at PD7 (Fig. 3), caspase activity was modestly increased at PD14 in LowerB compared to Controls (Fig. 3).
F0 maternal BPA exposure is associated with pancreatic immune system dysfunction in adult F3 male offspring
Several studies indicate that immune cells such as macrophages, dendritic cells and lymphocytes are present in islets and may play an important role in normal islet development.Reference Jansen, Voorbij and Jeucken 39 – Reference Banaei-Bouchareb, Gouon-Evans and Samara-Boustani 43 To explore whether β-cell-specific effects of BPA are associated with a perturbed immune response, we assessed the cytokine/chemokine profile in pancreatic lysates of F3 mice via Luminex assay. The levels of most cytokines/chemokines were not different among the groups; only 2 out of 16 detectable cytokines/chemokines had statistically different levels in BPA treated groups relative to controls (Table 1). These two cytokines (interleukin (IL)-1β, IL-12p70) are pro-inflammatory and, unexpectedly, their levels were reduced in BPA exposure groups relative to controls (Table 1). In our F1 and F2 mice, we observed increased levels of proinflammatory cytokines/chemokines.Reference Bansal, Rashid and Xin 26
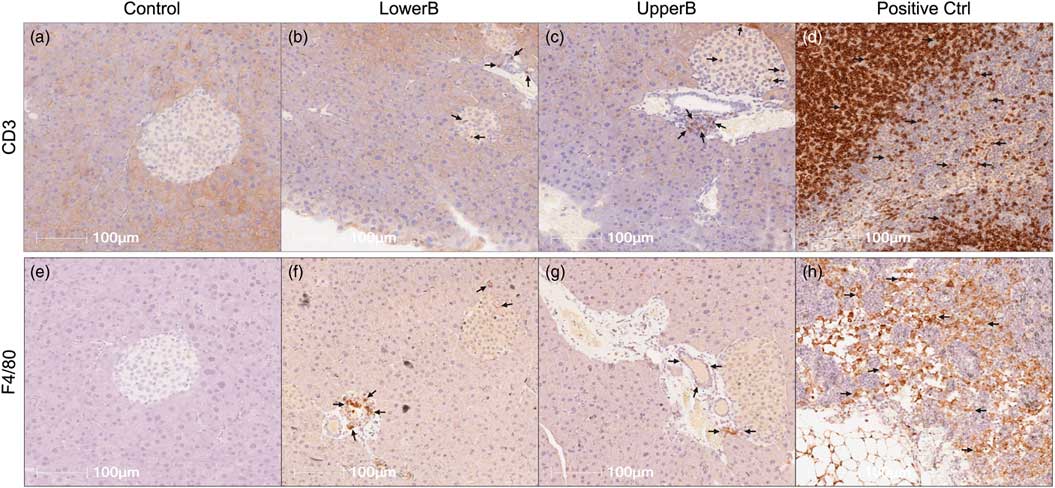
To determine if the immune cell population was altered, we stained pancreatic sections with CD3, a marker for T lymphocytes and with F4/80, a marker for macrophages. Surprisingly, we observed increased immunostaining of CD3 and F4/80 in islets of BPA exposed adult F3 male mice compared to controls (Fig. 4; Table 2). Because we saw minimal differences in cytokine/chemokine levels via Luminex in F3 males, the role of increased T lymphocytes and macrophages as reported via immunohistochemistry was unclear. Therefore, we looked at levels of other cytokines such as the TGF-β family that were not detected in the Luminex panel, but are produced by T lymphocytes and macrophages, and have been shown to increase insulin secretion.Reference Brown and Schneyer 44 – Reference Lin, Lee and Yadav 46 Interestingly, levels of TGF-β1 were statistically higher in the UpperB group, and trended higher in LowerB than controls (Mean ± SEM pg/µg: control = 0.0004 ± 0.0005; LowerB = 0.001 ± 0.0006, P = 0.09; UpperB = 0.003 ± 0.006, P = 0.01; n = 6 litters per group). Levels of TGF-β2 and TGF-β3 were below the lowest detection limit of the assay in most samples and therefore were excluded from any statistical testing.

Fig. 4 Representative photomicrographs of pancreatic immunohistochemical staining in F3 male offspring. (a–d) Sections stained for CD3: cluster of differentiation 3, marker for T lymphocytes and (e–h) Sections stained for F4/80: marker for macrophages. LowerB (lower bisphenol A (BPA)), UpperB (upper BPA), positive Ctrl (internal control–lymph node). Image magnified 20×. One animal per litter; n = 6 litters per group.
Table 2 Quantification of CD3 and F4/80 staining in pancreatic sections of F3 adult male offspring. Data are normalized to total analysis area and presented as mean (SEM). P values are from Dunnett’s test performed on log-transformed data, where required (F4/80 islets, F4/80 lymph nodes, F4/80 excluding islets and lymph nodes). One animal per litter; N = 6 litters per group.

Maternal metabolic milieu is not altered in mothers of F3 offspring
Abnormal glucose homeostasis of mothers during pregnancy increases the risk of impaired metabolic health of the offspring. Previously, we observed that maternal metabolic milieu was perturbed in mothers of F1, but not F2, offspring.Reference Susiarjo, Xin and Bansal 25 Consistent with the F2 findings, we observed that pregnancy efficiency and the maternal metabolic health of F3 UpperB and LowerB group was comparable to Controls. We found no difference in F3 LowerB and UpperB maternal body weight and food intake throughout gestation and lactation relative to Controls (Fig. 5). A subset of pregnant F2 mothers was fasted to determine additional metabolic parameters such as fasting glucose and insulin. To avoid any metabolic stressor that maternal fasting may impose, the offspring of these fasted mothers were not used for any experiments. These pregnant mothers from BPA groups had comparable fasting glucose (Mean ± SEM mg/dL: control = 194 ± 22; LowerB = 188 ± 26, P = 0.98; UpperB = 192 ± 25, P = 0.99; n = 5 litters per group), fasting insulin (Mean ± SEM ng/ml: control = 0.56 ± 0.18; LowerB = 0.37 ± 0.13, P = 0.75; UpperB = 0.44 ± 0.08, P = 0.88; n = 5 litters per group), and fasting glucose:insulin ratios (Mean ± SEM (mg/dL)/(ng/mL): control = 620 ± 130; LowerB = 640 ± 131, P = 0.99; UpperB = 497 ± 81, P = 0.68; n = 5 litters per group) when tested at E17 gestational age as control mothers. Thus, these findings suggest that these maternal metabolic parameters were not altered and are unlikely to confound the F3 male offspring metabolic outcomes.

Fig. 5 Parameters of mothers of F3 offspring. (a) Weekly body weight from mating until weaning (n = 8–9 litters per group) and (b) Food intake from pregnancy until weaning (n = 8–9 litters per group). Data are presented as mean + SEM, and analysed using Dunnett’s test. P values are relative to control, and were not statistically different.
Discussion
We recently reported that early life exposure to the EDC, BPA, in the mouse is associated with sex- and dose-specific metabolic health defects across two generations.Reference Susiarjo, Xin and Bansal 25 ,26 In the current study, we tested the hypothesis that maternal exposure to BPA via maternal transmission also alters metabolic health in third-generation offspring. We made the novel observation that maternal exposure to relevant human levels of BPA from preconception to weaning has sex- and dose-specific effects (Data summarized in Table 3). While some aspects of the metabolic phenotype observed in first- and second-generation offspring persist in third generation, most effects are no longer observed and the increase in body weight appeared six weeks later in third generation offspring compared to first and second generation.
Table 3 Summary of the effects of maternal bisphenol A exposure on metabolic health and pancreatic islets of third-generation offspring.

Note: LowerB: lower bisphenol A (BPA) (10 µg/kg/day); UpperB: upper BPA (10 mg/kg/day); n.s: not significant (P > 0.1); postnatal day (PD); body weight (BW); food intake (FI) and bone mineral density (BMD). Arrows indicate levels are statistically (P < 0.05) increased or decreased relative to controls. The offspring data are from 21 weeks of age, unless otherwise specified.
The reduction in β-cell mass in the lower BPA group also persisted into the third generation. Remodeling of β cells via proliferation and apoptosis in early life is critical for normal islet development and establishes β-cell mass in adulthood.Reference Scaglia, Smith and Bonner-Weir 32 – Reference Swenne 35 Either a reduction in proliferation rates, or an increase in cell death could underlie a reduction in β-cell mass. As proliferation rates were not decreased in lower BPA males it is likely that the reduction in β-cell mass in this group is due to increased cell death. This is supported by a trend toward increased caspase 3 activity early in life. This is similar to what we previously showed in the F1 and F2 lower BPA groups.Reference Bansal, Rashid and Xin 26
Interestingly, the F3 lower BPA group had smaller islets. Multiple studies show that small islets have increased insulin secretion which may explain the increase in insulin secretion that we observed in lower BPA mice.Reference Lehmann, Zuellig and Kugelmeier 47 , Reference MacGregor, Williams and Tong 48 Consistent with this, an increase in GSIS in the presence of reduced β-cell mass has been previously demonstrated by studies in partially pancreatectomized mice showing increased GSIS despite a reduction in β-cell mass.Reference Martin, Andreu and Rovira 49 Further, islets from lower BPA F3 animals are hypersensitive to glucose – that is, they secrete insulin at a lower glucose concentration. An abnormal increase in insulin secretion in the lower BPA group is likely to eventually lead to exhaustion of the limited pool of β cells and development of diabetes as the animals age. This is consistent with the existing evidence that a decline in β-cell function is typically preceded by an increased β-cell sensitivity to glucose in diabetic animals.Reference Leahy, Bumbalo and Chen 50 This is further supported by data from human and animal studies showing that a constant increase in insulin secretion can lead to mitochondrial dysfunction and endoplasmic reticulum stress, which leads to cellular injury and a progressive decline in β-cell function (i.e., β-cell exhaustion).Reference Nolan and Delghingaro-Augusto 51 , Reference Fridlyand and Philipson 52 Furthermore, the third-generation animals of the current study may display an altered metabolic response, if challenged by a second insult such as a high-fat diet as reported in pancreasReference Ding, Fan and Zhao 53 and other target tissues like mammary gland, sperm and liverReference Leung, Govindarajah and Cheong 54 – Reference Strakovsky, Wang and Engeseth 56 of the first-generation offspring. This requires further investigation.
Of interest, was our finding that T lymphocytes and macrophages were increased in pancreata of BPA-exposed mice, which was similar to what we observed in the F1 and F2 generations. However, the increase in immune cell infiltration was not associated with increased pro-inflammatory cytokine levels, rather we observed reduced IL-1β and IL-12 and increased TGF-β1 levels. It is known that immune cells could alter islet development and function.Reference Morris 57 For example, increased IL-1β or IL-12 production reduces insulin secretion,Reference Maedler, Sergeev and Ris 58 , Reference Taylor-Fishwick, Weaver and Grzesik 59 whereas TGF-β plays a critical role in pancreatic development and increases β-cell function.Reference Brown and Schneyer 44 – Reference Lin, Lee and Yadav 46 Consistent with these previous studies, we observed reduced IL-1β and IL-12 and increased TGF-β1 levels. These changes correlated with increased GSIS in the lower BPA group. Therefore, it is possible that in the third-generation offspring, the immune cell populations might be involved in increasing insulin secretion, which could be detrimental in the long term.
There is evidence suggesting that exposure to EDCs such as vinclozolin and BPA can alter behavioral, cardiac and reproductive outcomes that persist into the third generation.Reference Crews, Gore and Hsu 13 – Reference Lombo, Fernandez-Diez and Gonzalez-Rojo 21 , Reference Manikkam, Tracey, Guerrero-Bosagna and Skinner 24 However, evidence for transgenerational effects of EDCs on metabolic health is sparse. One study demonstrated that exposure to a commonly found environmental obesogen, tributyltin, throughout pregnancy and lactation resulted in transgenerational changes in adipose tissue of male mice.Reference Chamorro-Garcia, Diaz-Castillo and Shoucri 60 Similarly, a second study showed that exposure to the insecticide, dichlorodiphenyltrichloroethane (DDT), also has transgenerational effects on adipose tissue in male rats.Reference Skinner, Manikkam and Tracey 61 Interestingly, it has been shown that exposure to BPA in combination with other plastic derived compounds such as DEHP and DBP from 8 to 14 days of gestation was also associated with increased visceral adiposity in male and female rats across three generations.Reference Manikkam, Tracey, Guerrero-Bosagna and Skinner 24 Thus, these studies indicate that developmental exposure to EDCs is associated with transgenerational effects related to metabolic disorders. However, it was unclear in these studies whether the transmission was via the maternal, or paternal line because the F2, F3 or F4 offspring were generated by breeding exposed F1, F2 or F3 male and female rodents. Importantly in these previous studies, metabolic defects were reported in male (or in both male and female) offspring across all generations. Therefore, using the metabolically affected offspring to generate F2, F3 or F4 could have potentially confounded the reported outcomes. To our knowledge, the current study is the first to report the transgenerational effects of BPA exposure via the maternal line (F1s and F2s were bred with unexposed males) on metabolic health and in the pancreas. Our study is therefore different with respect to design (maternal exposure v. both parents exposed) as well as the end target tissue (pancreas v. adipose) from these previous studies. Importantly, as the female offspring were unaffected across the three generations in our study, we have excluded the potential confounding variable of maternal obesity and or impaired glucose homeostasis that could occur during pregnancy – factors known to affect the metabolic phenotype of the offspring. An additional strength of our study was that our exposure window included the pre-conception period and first trimester of pregnancy. The timing of exposure during pregnancy plays a critical role in influencing offspring metabolic health as has been shown by the landmark Dutch Hunger Winter studies.Reference Roseboom, de Rooij and Painter 62 , Reference Ravelli, van Der Meulen, Osmond, Barker and Bleker 63 Similarly, various humanReference Arendas, Qiu and Gruslin 64 – Reference Catalano and deMouzon 68 and animalReference Oliver, Hawkins and Harding 69 – Reference Stevens, Begum and Cook 71 studies have demonstrated that the preconception period is an equal, if not more, important contributor to offspring metabolic health. In fact, we previously reported that maternal BPA exposure from pre-conception through E12.5 resulted in loss of imprinting in the embryos, whereas E5.5–E12.5 exposure did not.Reference Susiarjo, Sasson, Mesaros and Bartolomei 28 Our study therefore adopted a chronic long-term developmental exposure approach and determined the effects of a preconception through lactation exposure that is relevant to human exposure levels of BPA on the metabolic health of the third-generation-offspring. Furthermore, an additional strength of our study was the use of animals that were generated across multiple cohorts in two separate animal care facilities.
In conclusion, findings from our current study indicate that maternal BPA exposure has sex- and dose-specific effects, but fewer effects on the metabolic health of the third-generation offspring. However, decreased β-cell mass persists across all three generations, and in the third generation lower BPA males there are increased numbers of small islets and increased insulin secretion which may eventually lead to significant impairments in β-cell function which has been shown in previous studies. Because the third-generation offspring were not exposed to BPA, the persistence of the metabolic abnormalities in the third generation suggests that epigenetic modifications may be involved in the transmission of the effects associated with BPA exposure across three generations.
Supplementary materials
To view supplementary material for this article, please visit https://doi.org/10.1017/S2040174418000764
Acknowledgements
The authors would like to acknowledge Martha Stefaniak, Chris Krapp, Yu-Chin Lien, and Amisha Jain for technical assistance. We are also grateful to the services of the Children’s Hospital of Philadelphia Pathology Core, and Translational Core, and University of Pennsylvania Radioimmunoassay and Biomarkers Core (P30 DK19525).
Funding
This work is supported by NIEHS ES023284 and ES013508 (MSB, RAS), CEET-ES-013508-05 (AB, RAS), March of Dimes (MSB), RO1DK098517 (CL), and T32 ES019851 (FX).
Disclosure statement
The authors declare no conflict of interest.