


1. Introduction
Many cylindrical structures in engineering applications, e.g. risers and flexible tethers, components of aircraft landing gears, wind turbine towers, etc. undergo significant flow-induced periodic loading generated from the well-studied vortex shedding phenomenon (e.g. Brika & Laneville Reference Brika and Laneville1993; Bokaian Reference Bokaian1994; Thomas, Kozlov & Corke Reference Thomas, Kozlov and Corke2005; Medici & Alfredsson Reference Medici and Alfredsson2006). This can lead to early fatigue failure of the structure and be a source of unwanted noise. Conversely, the fluctuating loading on a cylindrical structure can also be used for energy harvesting from flow induced vibrations (e.g. Bernitsas et al. Reference Bernitsas, Raghavan, Ben-Simon and Garcia2008). Over the past several decades, hundreds of experimental and numerical investigations have considered passive control methods for vortex shedding from cylindrical bodies (Zdravkovich Reference Zdravkovich1981). Geometrical modifications to a uniform cylinder, for example, the addition of splitter plates, roughness elements, helical wires, etc. can be used to alter vortex shedding characteristics, i.e. the spanwise coherence and strength of vortex shedding, and even suppress vortex shedding (Zdravkovich Reference Zdravkovich1981). There are a variety of modifications presently used for the passive control of vortex shedding in engineering applications and new modifications continue to be discovered as engineering applications evolve.
Recent studies have shown that variations in the diameter of cylindrical structures can be used as a means of reducing mean and unsteady loading (e.g. Lam, Wang & So Reference Lam, Wang and So2004; Nakamura & Igarashi Reference Nakamura and Igarashi2008). Nakamura & Igarashi (Reference Nakamura and Igarashi2008) showed that for a narrow range of geometric and flow parameters, a modest reduction (up to  $15\,\%$) in the mean drag on a cylindrical structure can be achieved using multiple stepwise discontinuities in cylinder diameter. At the same time, the majority of cylindrical structures encountered in practical flows, contain various discontinuities in diameters. From either a flow control perspective or for the characterization of flows over non-uniform cylindrical geometries, there is a need to understand the flow development over cylindrical structures with discontinuities in diameters. This is the main focus of the present study and such structures are approximated by a dual-step cylinder geometry. A dual-step cylinder consists of a large diameter cylinder
  $(D)$ attached coaxially to the mid-span of a small diameter cylinder
  $(d)$. The key geometric and flow parameters are expected to be the aspect ratio of the large diameter cylinder,
  $L/D$, the diameter ratio between the cylinders,
  $D/d$, and the Reynolds number,
  $Re_D$.
In the limiting cases, the dual-step cylinder geometry approaches that of a uniform circular cylinder ( $D/d \rightarrow 1; L/D \rightarrow 0$), a cantilevered cylinder (
 $D/d \rightarrow \infty; L \gg D$), a cylinder with two free ends (
 $D/d \rightarrow \infty; L \rightarrow D$), a coin-like cylinder (
 ${D/d \rightarrow \infty; L \ll D}$) or a single-step cylinder (
 $D/d > 1; L \gg D$). It is therefore instructive to consider the relevant literature on the cross-flow over these geometries. Focus is brought to the vortex shedding phenomenon which plays an important role in determining unsteady loading characteristics for bluff body geometries.
Vortex shedding from uniform circular cylinders occurs for  $Re_D\gtrsim 50$, and remains two-dimensional and laminar for
  $50<Re_D<190$ (Williamson Reference Williamson1996). For
  $Re_D\geq {190}$, the deformation of spanwise vortices at formation leads to the development of secondary streamwise vortices. With increasing Reynolds number up to approximately
  $1000$, the arrangement of streamwise vortices becomes less organized. Transition to turbulence occurs in the wake region, and with increasing Reynolds number the location of transition moves upstream. Transition to turbulence is reported to advance into the separated shear layers for
  $1000 \lesssim Re_D \lesssim 1900$ (Williamson Reference Williamson1996), where it remains for up to
  $Re_D \approx 200\,000$.
Depending on the aspect ratio of the cylinder and its end conditions, vortex shedding can occur parallel or oblique to the cylinder axis (Williamson Reference Williamson1989). End plates are often employed to achieve nominally two-dimensional flow conditions at the mid-span of a circular cylinder (Williamson Reference Williamson1989). However, the presence of end plates can also cause end cells to form. The end cells are distinct flow regions where the vortex shedding occurs at a lower frequency than that found at the mid-span of the cylinder. For about  $L/D > 50$, the vortex shedding frequency at the mid-span is similar to that from an ‘infinite’ cylinder (Norberg Reference Norberg1994). However, the vortex shedding frequency decreases gradually with decreasing
  $L/D$, which is partly attributable to the merging of end cells. For approximately
  $L/D < 7$, the vortex shedding frequency and wake characteristics become highly dependent on the Reynolds number (e.g. Szepessy & Bearman Reference Szepessy and Bearman1992; Norberg Reference Norberg1994). Differences between results may also be caused by a sensitivity of the end plate design to the flow development at these low aspect ratios (Norberg Reference Norberg1994).
Zdravkovich et al. (Reference Zdravkovich, Brand, Mathew and Weston1989), Zdravkovich et al. (Reference Zdravkovich, Flaherty, Pahle and Skelhorne1998) and Inoue & Sakuragi (Reference Inoue and Sakuragi2008) investigated the flow over circular cylinders with two free end conditions. At low Reynolds numbers in the laminar vortex shedding regime,  $50 \leq Re_D \leq 200$, Inoue & Sakuragi (Reference Inoue and Sakuragi2008) report that spanwise vortex shedding occurs for
  $L/D \geq 6$. For lower aspect ratios,
  $L/D < 6$, three possible wake patterns can occur depending on
  $Re_D$ and
  $L/D$: (i) spanwise vortex shedding, (ii) shedding of streamwise vortex pairs or (iii) the formation of two steady counter-rotating streamwise vortices from both ends of the cylinder. For Reynolds numbers pertaining to turbulent vortex shedding conditions,
  $6000 \leq Re_D \leq 26\,000$, Zdravkovich et al. (Reference Zdravkovich, Brand, Mathew and Weston1989) found that, for
  $2 \leq L/D \leq 8$, the vortex shedding is intermittent, with the shedding frequency varying with time. Later, Zdravkovich et al. (Reference Zdravkovich, Flaherty, Pahle and Skelhorne1998) performed experiments on very low aspect ratio cylinders with free ends for
  $200\,000 \leq Re_D \leq 600\,000$ and
  $0.02 \leq L/D \leq 0.9$, and found that no vortex shedding occurs from the cylinder. In particular, the wake is comprised of two steady counter-rotating streamwise vortices emanating from both ends of the cylinder, similar to that found by Inoue & Sakuragi (Reference Inoue and Sakuragi2008) for the same
  $L/D$ range. The results indicate a strong Reynolds number and aspect ratio effect on the flow development over cylinders with free ends.
The flow development over single-step cylinders has been considered in several studies over the last few decades (e.g. Lewis & Gharib Reference Lewis and Gharib1992; Dunn & Tavoularis Reference Dunn and Tavoularis2006; Morton & Yarusevych Reference Morton and Yarusevych2010, Reference Morton and Yarusevych2014b). The wake topology in both laminar and turbulent wake regimes is highly dependent on the ratio between the large and small cylinder diameters  $(D/d)$ (Lewis & Gharib Reference Lewis and Gharib1992). In the laminar shedding regime at low diameter ratios
  $(D/d < 1.25)$, Lewis & Gharib (Reference Lewis and Gharib1992) observed two dominant shedding cells characterized by distinct shedding frequencies of the small and large diameter cylinders. These cells interact downstream of the stepwise discontinuity in diameter through periodic vortex dislocations. However, for higher diameter ratios
  $(D/d > 1.55)$, a third vortex shedding cell is detected downstream of the large cylinder near the step discontinuity, referred to by Lewis & Gharib (Reference Lewis and Gharib1992) as the ‘modulated’ zone. The characteristic shedding frequency within the ‘modulated zone’ is a lower frequency than that in the large cylinder wake far from the step discontinuity. There is also a cyclic variation in the spanwise extent of the low frequency cell, which is reflected in the term ‘modulated’ region. For
  $1.25 \leq D/d \leq 1.55$, the type of wake development observed is strongly dependent on Reynolds number (Lewis & Gharib Reference Lewis and Gharib1992). Morton & Yarusevych (Reference Morton and Yarusevych2010) showed that in laminar flow conditions the presence of the ‘modulated’ zone is linked to fluctuations in downwash flow over the step region and into the large cylinder wake. In turbulent flow conditions, Morton & Yarusevych (Reference Morton and Yarusevych2014b) and Norberg (Reference Norberg1992) found that the vortex interactions between distinct vortex shedding cells are qualitatively similar to those taking place in laminar flow, including the existence of a ‘modulated’ zone (Morton & Yarusevych Reference Morton and Yarusevych2014b). Recent numerical studies on the vortex interactions in the wake (e.g. Tian et al. Reference Tian, Jiang, Pettersen and Andersson2017, Reference Tian, Jiang, Pettersen and Andersson2020) have provided further detail into the nature of the vortex interactions taking place downstream of the step junction.
Uniform flow over a dual-step cylinder has been considered by Williamson (Reference Williamson1992), Morton & Yarusevych (Reference Morton and Yarusevych2012), Morton & Yarusevych (Reference Morton and Yarusevych2014a), McClure, Morton & Yarusevych (Reference McClure, Morton and Yarusevych2015) and Ji et al. (Reference Ji, Cui, Xu, Yang and Srinil2019, Reference Ji, Yang, Cui and Chen2020a,Reference Ji, Yang, Yu, Cui and Srinilb). Williamson (Reference Williamson1992) investigated wake development of a dual-step cylinder for  $Re_D \leq 200$,
  $1.1 \leq D/d \leq 2$ and
  $L/d = 0.5$. The aim of his work was to force vortex dislocations through the attachment of a larger diameter cylinder with low aspect ratio to the mid-span of a uniform circular cylinder. His results show that periodic vortex dislocations form on both sides of the large diameter cylinder, and the frequency of dislocations is related to the difference in vortex shedding frequency in the small and large cylinder wakes. In the case where the small cylinder vortex shedding frequencies on both sides of the large cylinder match, vortex dislocations occur simultaneously and at the same frequency. However, if a small difference in shedding frequency exists, which is inevitable in most experimental facilities, the dislocations no longer occur at the same frequency, and hence, do not occur in phase. Williamson (Reference Williamson1992) investigated the influence of
  $D/d$ and
  $Re_d$ on the topology and frequency of vortex dislocations. His results indicate that the frequency of dislocations decreases with decreasing
  $D/d$. Williamson (Reference Williamson1992) proposed a model describing vortex interactions involved in a dislocation based on the difference in the vortex shedding frequencies and the circulation of the vortices. Morton & Yarusevych (Reference Morton and Yarusevych2012) investigated the effect of
  $L/D$ on vortex shedding from a dual-step cylinder for
  $Re_D = 1050$,
  $D/d = 2$ and
  $0.2 \leq L/D \leq 17$. The focus of the work was on identifying how the large cylinder flow development changes with
  $L/D$. Four distinct flow regimes were identified. (i) For
  $L/D \geq 15$, three vortex shedding cells form downstream of the large diameter cylinder. The vortex dislocations occurring between adjacent cells were similar to those observed in the wake of a single-step cylinder by Dunn & Tavoularis (Reference Dunn and Tavoularis2006). (ii) For
  $8 \leq L/D \leq 14$, a single vortex shedding cell forms in the large cylinder wake, and the frequency of the cell decreases with decreasing
  $L/D$. The transition between these regimes is attributed to the merging of low frequency cells forming near the ends of the large cylinder, similar to that observed in uniform and cantilevered cylinder flows (Williamson Reference Williamson1989). (iii) For
  $2 \leq L/D \leq 6$, vortex shedding from the large cylinder is highly three-dimensional, with large cylinder vortices deforming as they are shed into the wake. There is also a substantial reduction in the coherence and strength of the large cylinder vortices in this
  $L/D$ range. (iv)For
  $0.2 \leq L/D \leq 1$, similar to the findings of Williamson (Reference Williamson1992), vortex dislocations occur periodically between vortices in the small cylinder wakes. Morton & Yarusevych (Reference Morton and Yarusevych2014a) found no evidence of periodic vortex shedding occurring from the large diameter cylinder, and speculated that vortices visible in the large cylinder wake are in fact small cylinder vortex filaments connecting across the wake of the large cylinder. More recently, Morton, Yarusevych & Scarano (Reference Morton, Yarusevych and Scarano2016) investigated dual step cylinder wake development using tomographic particle image velocimetry (PIV), providing a more detailed classification of the changes in large cylinder wake topology observed for
  $1.33 \leq D/d \leq 2$,
  $0.5 \leq L/D \leq 5$ and
  $2000 \leq Re_D \leq 5500$. Their results reveal the complex turbulent wake topology of dual step cylinders, elucidating the interactions between the dominant coherent structures. Ji et al. (Reference Ji, Cui, Xu, Yang and Srinil2019, Reference Ji, Yang, Cui and Chen2020a,Reference Ji, Yang, Yu, Cui and Srinilb) have extended the Reynolds number range of dual step cylinder studies into the laminar vortex shedding regime and provided significant insight into the effects of
  $D/d$ on the vortex cell interactions.
While the previous investigations on the dual-step cylinders provide a substantial level of detail related to the wake topology associated with this geometry, added insight is required into the mechanisms associated with the changes between these regimes and the accompanying changes in flow characteristics. Moreover, the structural loads on dual-step cylinders are yet to be characterized. Thus, the goal of the present study is to provide a comprehensive classification and description of dominant wake topologies and the associated steady and unsteady structural loads for the dual-step cylinder geometry. This is accomplished based on a comprehensive investigation of the flow development and force measurements for a wide range of geometrical parameters, complemented by the synthesis of the results from previous studies. The outcome is a detailed flow regime map that incorporates the limiting cases of the dual-step geometry, namely, uniform cylinders, cylinders with free ends, single-step cylinders and dual-step cylinders, thus providing a novel framework for a wide range of related bluff body flows.
2. Experimental methodology
Experiments were carried out in a water flume facility at the University of Waterloo. The test section of the flume is 2.4 m long, with a cross-section of  $1.2 \times 1.2\ \textrm {m}^{2}$. The walls of the test section are constructed of glass, allowing for optical access. Models are placed vertically within a low turbulence, uniform flow region. The mean turbulence intensity in this region is less than
  $1\,\%$, and the flow uniformity is within
  $2.8\,\%$, and primarily caused by a gradual increase in free stream velocity with height. The models are mounted between circular Lexan end plates of 200 mm diameter, 3 mm thickness, with
  $60^{\circ }$ chamfered edges. The uniform and dual-step cylinder models investigated in the present study were constructed of stainless steel and aluminium. For the dual-step cylinders, a solid small diameter cylinder (
 $d$) is 40 cm in length and made of stainless steel. Larger diameter cylinders (
 $D$) are made of aluminium with a concentric orifice enabling a sliding fit on the smaller cylinder. The large diameter cylinders are secured through a frictional fit in a fixed position at the mid-span of the smaller diameter cylinder, creating the dual-step cylinder configuration shown in figure 1. A summary of the specific uniform and dual-step cylinder model geometrical configurations and associated experimental measurements is provided in tables 1 and 2, respectively.

Figure 1. Experimental set-up for planar PIV and force measurements. The origin of the coordinate system is located at the midspan of the large cylinder along its axis. Instantaneous velocity fields are shown in place of the raw particle images for illustrative purposes in (a,b).
Table 1. Uniform cylinder model configurations and associated experimental measurements completed in the present study.

Table 2. Dual-step cylinder model configurations and associated experimental measurements completed in the present study at  $Re_D = 2100$. The diameter of the large cylinder is fixed at
  $D = 25.4\ \textrm {mm}$. Model configurations studied are for discrete
  $D/d$ values of
  $1.33$,
  $1.6$,
  $2.0$,
  $2.67$ and
  $4.0$.

A LaVision PIV system was used to measure the velocity field in two-dimensional planes in the near wake. The PIV system consisted of a Photonics DM-20 Nd:YLF pulsed laser synchronized to a  $1024\times 1024$ pixel Photron SA4 camera equipped with a 50 mm focal length Nikon lens. The flow was seeded with
  $10\ \mathrm {\mu }\textrm {m}$ hollow glass spheres which are approximately neutrally buoyant in water (
 $SG= \rho _p/\rho _w= 1.05$, where
  $\rho _p$ is the equivalent density of the hollow glass spheres and
  $\rho _w$ is the fluid density). As illustrated in figure 1, the PIV system was employed to perform measurements in two configurations: (i) a single horizontal
  $(x\text {--}y)$ plane at
  $z/D = 0$ (figure 1a), and (ii) a single vertical
  $(x\text {--}z)$ plane at
  $y/d = 0$ (figure 1b).
Considering the relatively low free stream velocity  $(U = 85\ \textrm {mm}\,\textrm {s}^{-1})$, the PIV system was operated in single frame mode. The experiments involved obtaining a total of
  $5456$ particle images at a fixed frame rate of 100 Hz from each measurement plane, which is two orders of magnitude larger than the wake frequencies of interest (1–3 Hz). Following this, particle images were processed using LaVision's DaVis 8 software. Cross-correlation was performed using an iterative multi-grid technique (WIDIM) (Scarano & Riethmuller Reference Scarano and Riethmuller2000), with a final interrogation window size was
  $16 \times 16$ pixels and
  $75\,\%$ overlap. The final window size was selected such that the spatial resolution is maximized while ensuring that the mean number of particles in the window is equal to ten. The resulting vector spacing was approximately
  $0.03D$ for both vertical and horizontal measurement planes. The velocity data were post-processed using a universal outlier detection technique (Westerweel & Scarano Reference Westerweel and Scarano2005). Uncertainty in the instantaneous PIV measurements was estimated using correlation statistics (Wieneke Reference Wieneke2015). The local PIV uncertainty is estimated to be less than
  ${\pm }1\,\%$ in the free stream and less than
  ${\pm }6\,\%$ in the wake with
  $95\,\%$ confidence. Presentation of velocity field results in the sections to follow use a vector resolution that is
  $\frac {1}{4}$th of the true resolution in both
  $x$ and
  $y$ directions.
A Measurement Science Equipment (MSE) single component laser Doppler velocimetry (LDV) system was used to measure the streamwise velocity in the dual-step cylinder wake at a fixed point,  $(x/D,y/D,z/D) = (5,0.75,0)$. The MSE system is comprised of a 140 mW diode laser with a wavelength of 658 nm that is split into two equal intensity beams. One of the beams in each pair is frequency shifted in order to resolve flow direction in the measurement volume. The beam conditioning optics has a fixed focal length of 400 mm in air, which is increased to approximately 530 mm for measurements in water. Under these conditions, the measurement volume size created by the intersection of the two beams is estimated to be
  $(\triangle {x}/D,\triangle {y}/D,\triangle {z}/D) = (0.003, 0.02, 0.003)$. The water was seeded with the same particles used in the PIV experiments. The mean data acquisition rate was greater than 50 Hz for all measurements. Velocity data were re-sampled at 25 Hz using a sample-and-hold technique (Adrian & Yao Reference Adrian and Yao1986) in order to facilitate spectral analysis of the velocity fluctuations. For spectral analysis, the re-sampled data were divided into
  $48$ non-overlapping segments of
  $1024$ velocity points, which were averaged. The corresponding frequency resolution for velocity spectra is approximately
  ${\pm }0.003 fD/U$.
The drag and lift on uniform and dual-step cylinder models were measured using a cantilevered-beam strain gauge force balance, as illustrated in figure 1. In both lift and drag directions, four strain gauges were configured to create a Wheatstone bridge circuit. High resistance  $(350\ \Omega )$ precision strain gauges from Vishay Measurement Group were used, all of which had the same gauge factor of
  $2.05$. Futek CSG110 amplifiers were employed to amplify the signal output from the Wheatstone bridge. The signals were acquired with a National Instruments model 6320 DAQ board. The force balance system was first calibrated using sets of precision weights, and then assessed using force measurements on uniform circular cylinder models for
  $750 \leq Re_D \leq 2000$. The uncertainty in mean drag is estimated to be less than
  ${\pm }5\,\%$, while that in the fluctuating lift is
  ${\pm }50\,\%$. The notably higher uncertainty for lift measurements is due to the experiments being conducted within a Reynolds number range where the root-mean-square (r.m.s.) lift coefficient (
 $C_{L}^{\prime}$) is at a minimum value for a uniform circular cylinder at approximately 0.05 (Norberg Reference Norberg2003), while the mean drag coefficient (
 $C_D$) is between 0.9 and 1.3.
Flow visualizations were carried out using a hydrogen bubble technique. Hydrogen bubbles were generated on a thin, 0.085 mm diameter stainless steel wire via electrolysis by applying a DC voltage of approximately 15 V. The cylindrical aluminium rod acting as the upper support for the models served as the anode in the hydrogen bubble circuit. The models were insulated from the circuit through plastic threaded-rod connections. While producing adequate visualization, the hydrogen bubbles had a sufficiently small rising velocity to ensure insignificant displacement due to buoyancy within the wake region of interest. The hydrogen bubble wire was positioned less than  $0.7D$ upstream and offset from the model axis to visualize vortices on one side of the wake. The Reynolds number based on wire diameter is less than ten, which minimizes the adverse effects of the wire on the flow development since no shedding of vortices occurs from the wire. Three-dimensional visualizations of the wake were achieved with a laser volume illumination of the hydrogen bubbles via a
  $2W$ continuous wave Spectra-Physics laser. Monochrome images were recorded using a Photron SA4 camera under the same operating conditions as the PIV measurements discussed earlier.
Surface visualizations were also carried out using a hydrogen bubble technique using the methodology outlined by Morton & Yarusevych (Reference Morton and Yarusevych2015). Specifically, insoluble metal hydroxides and salts which form during the electrochemical reactions involved in electrolysis serve as the surface visualization agent. The visualization takes place when the insoluble particles detach from the hydrogen bubble wire, impact upon the stagnation region of the model, and are dragged along the surface of the model until flow separation occurs. Once the models have been allowed to dry, salient surface flow patterns can be discerned (Morton & Yarusevych Reference Morton and Yarusevych2015).
3. Results
The flow development over dual-step cylinders is found to change significantly with  $L/D$ and
  $D/d$ in the present study. The results of this investigation have enabled detailed quantitative classification of up to six distinct flow regimes pertaining to this geometry. First, a qualitative overview of the identified regimes is provided in § 3.1 to highlight their main topological features. Following this, a detailed analysis of the results is presented in § 3.2, leading to a qualitative flow regime map synthesized in § 3.3. Following this, an energy-based decomposition of the flow field is used to highlight important dynamical features of the flow regimes and the final section provides a summary of direct force measurements of drag and lift on the dual-step cylinder models.
3.1. Overview of flow regimes
Figure 2 presents an overview of distinct flow regimes identified based on the results of the present study. Each flow regime is represented by a sketch highlighting essential elements associated with the development of dominant vortical structures.

Figure 2. Sketch of flow regimes expected for a dual-step cylinder based on changes in  $D/d$ and
  $L/D$. The boundaries between different regimes are marked by dashed lines as they are approximated from consolidation of the results from other relevant studies. Note that this approximated map pertains to Reynolds numbers corresponding to the shear layer transition regime.
The cellular shedding (CS) regime occurs for high large cylinder aspect ratios and is characterized by multiple vortex shedding cells forming in the large cylinder wake. The vortex dynamics downstream of each step discontinuity in diameter matches that found for a single-step cylinder configuration (Morton & Yarusevych Reference Morton and Yarusevych2014b). Specifically, the nature of the vortex interactions can be related to the frequency difference between adjacent vortex cells often referred to as a beat frequency (Lewis & Gharib Reference Lewis and Gharib1992), a fundamental dislocation frequency (McClure et al. Reference McClure, Morton and Yarusevych2015) as well as the instantaneous relative phase alignment of the vortex cells. The dominant vortex interactions are initiated in the near wake at formation, where spanwise vortices forming behind the step region connect upstream to junction and edge vortices generated by the step discontinuity (Dunn & Tavoularis Reference Dunn and Tavoularis2006). Downstream of formation, the dominant vortex interactions involve vortex splitting, vortex merging and half-loop vortex connections as illustrated in figure 2 and shown by McClure et al. (Reference McClure, Morton and Yarusevych2015).
As the aspect ratio of the large diameter cylinder is reduced, transition to the low frequency shedding (LFS) regime takes place. In this regime, vortex shedding from the large cylinder occurs in a single cell across the entire span of the large diameter cylinder. The vortex shedding frequency of this cell is lower (up to  $10\,\%$) than that found for a uniform cylinder of diameter
  $D$. As illustrated in figure 2, vortices in the large cylinder wake are shed nearly parallel to the cylinder axis and form direct connections with the vortices shed from the small diameter cylinder. Large cylinder vortices are stronger than their small cylinder counterparts, which results in all vortices in the large cylinder wake splitting to facilitate connections with small cylinder vortices at the boundary between the cells.
Further reduction in large cylinder aspect ratio leads to a more complex flow regime behaviour dependent on the diameter ratio. At higher diameter ratios, the irregular shedding (IS) regime is observed (figure 2), which is characterized by the lack of consistent vortex shedding pattern in the large cylinder wake. The coherence and strength of vortex shedding is reduced substantially when compared to the LFS and CS regimes and the vortex shedding frequency varies with time, similar to the results of Morton & Yarusevych (Reference Morton and Yarusevych2014a). The presence of distinct large cylinder vortices is difficult to identify instantaneously, but in a phase-average reconstruction, Morton et al. (Reference Morton, Yarusevych and Scarano2016) showed that the large cylinder vortices deform into hairpin-like structures as they are shed into the wake region. Small cylinder vortex filaments terminate at the stepwise discontinuities, form half-loop connections, or connect with vortex filaments in the large cylinder wake (figure 2). In some cases, an irregular vortex shedding behaviour is accompanied by an asymmetry in the flow topology with respect to the  $zx$ symmetry plane. This is labelled in figure 2 as the asymmetric irregular shedding (AIS) regime.
Within a comparable  $L/D$ range at which the IS regime is observed, a distinct flow state referred to as the high frequency shedding (HFS) occurs at lower
  $D/d$. Large cylinder vortex shedding is present in this regime, but the frequency of shedding is higher (up to
  $30\,\%$) than that of a uniform circular cylinder of diameter
  $D$. Similar to the LFS regime, small and large cylinder vortices interact in the large cylinder wake through direct vortex connections, which involves vortex deformations and splitting of large cylinder vortices as the vortex cells move in and out of phase. Vortex dislocations occur periodically and are manifested by small cylinder vortices forming half-loop vortex connections (Morton et al. Reference Morton, Yarusevych and Scarano2016), similar to that observed at vortex cell boundaries in the LFS and CS regimes.
For sufficiently low aspect ratios ( $L/D$), the shear layers forming on the large cylinder do not roll up periodically into spanwise structures, and the large cylinder effectively acts as a perturbation inducing local dislocations of small cylinder vortices (Williamson Reference Williamson1992). In this no shedding (NS) regime, the separated shear layers extending from the large cylinder collapse in the near wake as depicted in figure 2. The vortices shed from the small diameter cylinders interact through complex vortex connections across the wake of the large cylinder, and the presence of the large cylinder perturbs the development of these connections. This results in periodic vortex dislocations occurring between small cylinder vortices.
3.2. Mean and instantaneous wake topology
This section elucidates quantitative changes in wake characteristics associated with the identified flow regimes and regime transitions.
3.2.1. Instantaneous and mean wake characteristics in the  $x$–$y$ plane


As a baseline for comparison, figure 3 illustrates instantaneous vorticity ( $\omega$), mean streamwise velocity (
 $\bar {u}$) and root mean square streamwise velocity
  $\sqrt {\langle {u'^2}\rangle }$ flow at the midspan of a uniform cylinder. The uniform circular cylinder wake features the alternate shedding of vortices which can be seen in figure 3(a). The mean recirculation region behind the cylinder is characterized by two counter-rotating eddies that are symmetric relative to the wake centreline (figure 3b). The recirculation region extends approximately
  $2.5D$ downstream of the model axis, matching that reported by Zdravkovich (Reference Zdravkovich2003) for a uniform circular cylinder at the same Reynolds number. The
  $\sqrt {\langle {u'^2}\rangle }$ field shows that velocity fluctuations attain maximum amplitudes directly downstream of the recirculation region, with the peak strength of
  $\sqrt {\langle {u'^2}\rangle }$ fluctuations reaching approximately
  $30\,\%$ of the free stream velocity at
  $x/D = 2.5$ (figure 3c). The agreement between this
  $x/D$ location and that marking the end of the mean recirculation region illustrates the equivalence of the two definitions commonly used for the vortex formation length for uniform circular cylinders (e.g. Bloor Reference Bloor1964; Bearman Reference Bearman1965; Roshko Reference Roshko1993). While a similar definition is not, strictly speaking, directly applicable to the dual-step cylinder, where the vortex formation region varies along the span, it can be used to estimate the extent of the formation length along the span. The mean and r.m.s. velocity fields as well as instantaneous vorticity fields can provide insight into how vortex formation changes with dual-step cylinder geometry, and if a traditional von Kármán vortex street exists.

Figure 3. Mean, r.m.s. and instantaneous wake topology of a uniform circular cylinder at  $Re_D = 2100$.
  $(a)$ Instantaneous vorticity.
  $(b)$ Mean velocity.
  $(c)$ The r.m.s. velocity.
Figures 4, 5 and 6 illustrate changes in the instantaneous, mean and r.m.s. wake flow fields, respectively, obtained at the mid-span of the dual-step cylinder (i.e. in the large cylinder wake). Comparing the results with that of a uniform cylinder (figure 3), distinct changes in wake characteristics can be identified.

Figure 4. Changes in the instantaneous vorticity field in the wake for each identified flow regime at  $Re_D = 2100$.
  $(a)$ LFS regime,
  $L/D = 3$,
  $D/d = 1.33$.
  $(b)$ LFS regime,
  $L/D = 5$,
  $D/d = 2$.
  $(c)$ IS regime,
  $L/D = 5$,
  $D/d = 2$.
  $(d)$ IS regime,
  $L/D = 5$,
  $D/d = 2.67$.
  $(e)$ AIS regime,
  $L/D = 0.5$,
  $D/d = 4.0$.
  $(\,f)$ HFS regime,
  $L/D = 1$,
  $D/d = 2.0$.
  $(g)$ NS regime,
  $L/D = 0.2$,
  $D/d = 2.0$.
  $(h)$ NS regime,
  $L/D = 0.5$,
  $D/d = 2.0$.

Figure 5. Changes in the mean velocity in the wake for each identified flow regime at  $Re_D = 2100$.
  $(a)$ LFS Regime
  $(L/D = 3,\ D/d = 1.33)$.
  $(b)$ LFS regime
  $(L/D = 5,\ D/d = 2)$.
  $(c)$ IS regime
  $(L/D = 5,\ D/d = 2)$.
  $(d)$ IS regime
  $(L/D = 5,\ D/d = 2.67)$.
  $(e)$ AIS regime
  $(L/D = 0.5,\ D/d = 4.0)$.
  $(\,f)$ HFS regime
  $(L/D = 1,\ D/d = 2.0)$.
  $(g)$ NS regime
  $(L/D = 0.2,\ D/d = 2.0)$.
  $(h)$ NS regime
  $(L/D = 0.5,\ D/d = 2.0)$.

Figure 6. Changes in the r.m.s. velocity in the wake for each identified flow regime at  $Re_D = 2100$.
  $(a)$ LFS regime
  $(L/D = 3,\ D/d = 1.33)$.
  $(b)$ LFS regime
  $(L/D = 5,\ D/d = 2)$.
  $(c)$ IS regime
  $(L/D = 5,\ D/d = 2)$.
  $(d)$ IS regime
  $(L/D = 5,\ D/d = 2.67)$.
  $(e)$ AIS regime
  $(L/D = 0.5,\ D/d = 4.0)$.
  $(\,f)$ HFS regime
  $(L/D = 1,\ D/d = 2.0)$.
  $(g)$ NS regime
  $(L/D = 0.2,\ D/d = 2.0)$.
  $(h)$ NS regime
  $(L/D = 0.5,\ D/d = 2.0)$.
In general, in the LFS and HFS flow regimes (figure 4a,b,f), a clear pattern of alternating vortex shedding can be seen in the large cylinder wake. The corresponding mean (figure 5) and r.m.s. (figure 6) fields display symmetric recirculation zones and a peak r.m.s. velocity fluctuation at the end of the mean recirculation zones, agreeing with the uniform cylinder results (figure 3). Other flow regimes (e.g. NS, AIS and IS) show a significant departure from a traditional von Kármán type wake topology. For the IS regime, it is instructive to first consider the transition from an infinitely long uniform cylinder, to the LFS regime and then to the IS regime. As mentioned earlier, the LFS regime is established when two low frequency cells near the ends of the large cylinder merge at the mid-span. Hence, the LFS regime is characterized by a lower vortex shedding frequency and larger vortex formation length when compared to a uniform cylinder (cf. figures 6a and 3c). As the LFS and IS regime boundary is approached (e.g.  $L/D = 5$,
  $D/d = 2$ in figure 6b,c), the mean recirculation zone elongates further until the formation of von Kármán vortices almost ceases within the field of view (cf. figure 4b,c). The observed wake topology is similar to that observed qualitatively by Roshko (Reference Roshko1954) using a splitter plate, indicating that the interaction between the separated shear layers is inhibited for this narrow range of geometric parameters. This abrupt change in flow development is best seen by comparing the results for
  $L/D = 5$,
  $D/d = 2$, which pertains to the boundary between the LFS and IS flow regimes. Here, an intermittent switching between IS and LFS flow regime characteristics is observed (cf. figure 4b,c). The switching between flow states occurred at a very low frequency relative to the shedding frequency and was easily identifiable through proper orthogonal decomposition (POD) analysis of the vector fields. This enabled conditional averaging to be performed for computing time-averaged statistics in this bistable wake configuration (figures 5b,c and 6b,c). In the IS regime, the formation region is dominated by an instability of the separated shear layers. The Kelvin–Helmholtz (KH) instability vortices can be seen, for example, in figure 4(c), as well as the flow visualizations shown in figure 7 (see supplementary movie 1 available at https://doi.org/10.1017/jfm.2020.593 for time-resolved hydrogen bubble visualization recordings at
  $D/d = 2.67$ and
  $L/D = 3$). The corresponding mean wake topology shows recirculation zones extending beyond
  $x/D = 4$, which is over
  $150\,\%$ larger than that for a uniform cylinder of the same diameter. The r.m.s. fields identify most significant velocity fluctuations within the cores of the two separated shear layers (
 $y/D \approx \pm 0.7$), with maximum values attained where KH rollers form.

Figure 7. Wake vortex topology in the IS regime for  $L/D = 3$ and
  $Re_D = 2100$:
  $(a)$
$(a)$ $D/d = 1.6$,
  $(b)$
$(b)$ $D/d = 2$,
  $(c)$
$(c)$ $D/d = 2.67$.
In the AIS regime, there is a single recirculation eddy behind the cylinder model in the mean field (figure 5e), this results in the asymmetric orientation of the mean recirculation zone, which is inclined at approximately ten degrees relative to the  $y = 0$ axis (figure 5e). The maximum r.m.s. wake velocity fluctuations (figure 6e) are less than half those found for a uniform circular cylinder, and the r.m.s. field features the same distinct asymmetry relative to the
  $y = 0$ axis. The instantaneous PIV image in figure 4(e) and analysis of video records confirms that vortices are shed periodically on one side of the wake, with the opposite side being relatively steady. The formation of von Kármán-like vortices on one side of the large cylinder wake necessitates the presence of vortices of opposite sign. This leaves two possible scenarios, both of which require further investigation: (i) the vortex shedding is highly three-dimensional such that the planar PIV data in figure 4(e) do not fully capture the process, or (ii) the unsteady vortical structures shed from the body arise from a different type of instability.
In the NS regime, a clear pattern of Kármán-like vortices can be seen in the large cylinder wake (figure 4g,h). However, in the mean field there is no detectable recirculation eddies (figure 5g,h) and the r.m.s. velocity distribution displays a peak well outside the recirculation zone (i.e. there is no correspondence between r.m.s. velocity fluctuation and the recirculation zone). The results affirm that no vortex shedding occurs in the selected plane of measurement, and the vortices visible in instantaneous images and video records are footprints of small cylinder vortices connecting across the large cylinder wake.
Figure 8 presents the variation of the recirculation zone  $L_F$ with
  $D/d$ and
  $L/D$ for all models investigated. Also shown in the figure are
  $L_F$ estimates for uniform small diameter cylinders at
  $L/D = 0$, and uniform large diameter cylinder at
  $L/D = \infty$. For a given
  $D/d$, the
  $L_F$ increases with increasing
  $L/D$, and for a given
  $L/D$, the
  $L_F$ does not change significantly with
  $D/d$. Peak values in the
  $L_F$ are obtained for models investigated at
  $L/D = 5$. However, it is expected that, as
  $L/D$ continues to increase, the
  $L_F$ at the large cylinder mid-span will plateau and then decrease, eventually approaching that expected for an infinitely long uniform circular cylinder (figure 8). These trends in the formation length are linked to the instantaneous wake topology images shown in figure 4. From a qualitative comparison of the instantaneous shear layer trajectories, it can be seen that when the shear layer is at a positive angle relative to the free stream direction, this corresponds to an elongated formation length. In contrast, for negative angles, a shorter formation length is observed. Projecting upstream, the mean trajectory of the shear layer may be indicative of the flow separation angle on the cylinder surface, as is the case for two-dimensional circular cylinders (Wu et al. Reference Wu, Wen, Yen, Weng and Wang2004).

Figure 8. Variation in the vortex formation length in the  $x$–
$x$– $y$ plane at
  $z/D = 0$.
3.2.2. Mean wake characteristics in the $x$–$z$ plane


Figures 9 and 10 illustrate changes in the mean and r.m.s. wake topology of dual-step cylinders using PIV measurements obtained in the  $x$–
$x$– $z$ plane at
  $y/D = 0$. The results are presented for IS, LFS, HFS and NS flow regimes. For all the cases, there is notable variation in both the spanwise and streamwise extent of the recirculation zone in the large cylinder wake. The presence of the large cylinder also substantially affects the flow development in the small cylinder wake in the vicinity of the stepwise discontinuities. In the LFS regime (figure 9a), there is a gradual change in the recirculation length between the large and small cylinder, and the
  $x/D$ location of the peak r.m.s. in the wake (figure 10a) approximately matches the end of the recirculation region for any given
  $z/D$ location. The length of the recirculating flow region increases in the small cylinder wake from
  $x/D = 2$ to
  $x/D = 2.5$ as the discontinuities in diameter are approached, maintaining a nearly constant recirculation length of
  $x/D = 2.5$ in the wake of the large cylinder. In the IS regime (figure 9b), the recirculation region elongates substantially to
  $x/D \approx 4.0$, and contains two counter-rotating eddies downstream of both step discontinuities in the large cylinder wake (
 $x/D = 1.5$ and
  $z/D = \pm 1.25$ in figure 9b). Near each stepwise discontinuity, there is a relatively high velocity that delineates the recirculation zones in the large and small cylinder wakes. Near the step, this high velocity region is directed at an angle relative to the free stream and further downstream attains a streamwise orientation. The location of this high velocity region closely coincides with the location and trajectory of transverse-oriented shear layer instability vortices that have been identified in the hydrogen bubble flow visualization images presented in figure 7. In the HFS regime (figures 9c and 10c), the recirculation zone extends up to
  $2D$ downstream of the cylinder axis in the large cylinder wake. The spanwise region affected by the presence of the large cylinder in the HFS regime includes the large cylinder wake, and spanwise regions extending into the small cylinder wakes near the step discontinuities,
  $0.5 \leq z/D \leq 1.0$, and
  $-1.0 \leq z/D \leq -0.5$ in figure 9(c). Wake velocity fluctuations are the highest downstream of the step locations (figure 10c), and correspond to where vortex interactions occur between large and small cylinder vortices. In the NS regime (figures 9d and 10d), the large cylinder is relatively small (in terms of
  $D/d$ and
  $L/D$) compared to other flow regimes, and has only a minor effect on mean and instantaneous wake topology. The main features of the near wake surrounding the large cylinder model consist of a slightly elongated recirculation zone when compared to that of the small cylinder, and a more rapid wake recovery. This is speculated to be caused by more significant spatial variations in the vortex connections in the large cylinder wake, which, on the average, lead to a higher mean velocity downstream of the large cylinder.

Figure 9. Changes in the mean wake velocity deficit in the  $x$–
$x$– $z$ plane for each identified flow regime at
  $Re_D = 2100$.
  $(a)$ LFS regime,
  $L/D = 3.0$,
  $D/d = 1.33$.
  $(b)$ IS regime,
  $L/D = 3.0$,
  $D/d = 2$.
  $(c)$ HFS regime,
  $L/D = 1.0$,
  $D/d = 2$.
  $(d)$ NS regime,
  $L/D = 0.2$,
  $D/d = 2$.

Figure 10. Changes in the r.m.s. velocity of the wake in for an  $x$–
$x$– $z$ plane at
  $y/D = 0$ for
  $Re_D = 2100$.
  $(a)$ LFS regime,
  $L/D = 3.0$,
  $D/d = 1.33$.
  $(b)$ IS regime,
  $L/D = 3.0$,
  $D/d = 2$.
  $(c)$ HFS regime,
  $L/D = 1.0$,
  $D/d = 2$.
  $(d)$ NS regime,
  $L/D = 0.2$,
  $D/d = 2$.
3.2.3. Boundary layer separation and shear layer development
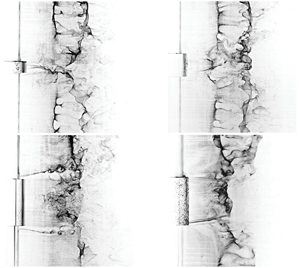
The foregoing discussion shows that the identified flow regimes are associated with substantial changes in large cylinder wake development. Evidently, the observed changes in mean flow topology and formation length are related to changes in boundary layer development, in particular, boundary layer separation. This is confirmed by the changes in the mean separated shear layer trajectories that can be seen in figure 5. Surface flow visualizations with hydrogen bubble technique (Morton & Yarusevych Reference Morton and Yarusevych2015) were employed to quantify boundary layer separation for a uniform cylinder of diameter  $D$ and dual-step cylinder models corresponding to the IS, HFS and NS flow regimes. The results for each of the three dual-step cylinder cases are presented in figure 11, where separation lines are marked by solid white lines and dashed lines correspond to the separation line on a uniform cylinder of the same diameter (
 $90^{\circ }$) at this Reynolds number). Figure 11 shows that, relative to the uniform cylinder, separation occurs earlier in the IS regime, and is delayed for both the HFS and NS regimes. This explains the elongation of the formation length
  $L_F$ seen in figure 8 and confirms that the shear layer development at the mid-span of the large diameter cylinder (figure 4) provides a qualitative indication of the flow separation angles (Wu et al. Reference Wu, Wen, Yen, Weng and Wang2004).

Figure 11. Surface visualization of flow separation and wake visualizations for dual-step cylinders: (a,b) IS regime,  $D/d = 2$ and
  $L/D = 3$, (c,d) HFS regime,
  $D/d = 2$ and
  $L/D = 1$ and (e,f) NS regime,
  $D/d = 2$ and
  $L/D = 0.5$. Vertical white dashed lines in the surface visualization images (a, c, e) identify the separation location for a uniform cylinder of diameter
  $D$.
$D$.
3.2.4. Spectral energy content
To determine the dominant frequency in the large cylinder wake and gain better insight into the flow regimes depicted in figure 13, spectral analysis of streamwise velocity data was performed and the results are presented in figure 12. All spectra were computed based on velocity data acquired in the wake of the large cylinder at  $x/D = 5, y/D = 0.75,$ and
  $z/D = 0$. As a reference, the dimensionless shedding frequency of a uniform cylinder of diameters
  $d$ and
  $D$ is included in the figure. For a uniform cylinder, well-defined peaks appear in the spectra at the vortex shedding frequency (figure 12), with the corresponding Strouhal numbers (
 $St = fD/U$) matching those reported by Norberg (Reference Norberg2003) to within the frequency resolution bandwidth (
 ${\pm }0.003 fD/U$). The results illustrate that variations in the dominant frequency occur in the wake of a dual-step cylinder with both
  $D/d$ and
  $L/D$. Consider, for example, spectra pertaining to
  $D/d = 1.6$ (figure 12b). The velocity spectrum for
  $L/D = 3$ shows a broad peak centred on a frequency lower than that expected for a uniform cylinder at the same Reynolds number. As the aspect ratio of the large cylinder is decreased to
  $L/D = 2$ and
  $1$, the dominant frequency in the large cylinder wake increases, exceeding the vortex shedding frequency for a uniform cylinder (figure 12). Also, the energy content of the corresponding spectral peak increases, indicating an increase in coherence of wake structures. A further decrease in the large cylinder aspect ratio below
  $L/D = 1$, produces a dual peak in the spectrum, with one peak centred at a frequency matching the expected vortex shedding frequency of the small diameter cylinder, and the other at a slightly lower frequency, as can be seen in the spectrum pertaining to
  $L/D = 0.5$ in figure 12. At
  $L/D = 0.2$, the energy content associated with the small cylinder shedding frequency becomes dominant (figure 12). These trends can also be seen for other diameter ratios investigated. The observed changes in velocity spectra in figure 12 are reflecting changes in the large cylinder wake topology within each of the identified flow regimes. Through a comparison of the velocity spectra with hydrogen bubble flow visualizations and PIV measurements, each flow regime can be shown to have unique spectral characteristics associated with the dominant vortical structures detectable in the large cylinder wake. In the LFS regime, a single, narrow-banded peak is observable in the spectra, but the central frequency of the peak is lower than that expected for a uniform cylinder. For example, for
  $L/D = 3$ and
  $D/d = 1.33$, the dimensionless shedding frequency is approximately
  $0.175$, which is approximately
  $13\,\%$ lower than that produced by a uniform cylinder of the same diameter. Velocity spectra pertaining to the IS and AIS regimes are characterized by a low energy content single dominant peak, associated with a decrease in the coherence of the vortices shed from the large cylinder. In some cases, e.g.
  $D/d = 4$ in figure 12, there is no discernible peak in the spectra, despite the fact that there are organized structures in the near wake. The HFS regime is characterized by a single, narrow peak in the spectra whose frequency is higher than that expected for a uniform circular cylinder of the same diameter. For example, the dimensionless vortex shedding frequency for
  $L/D = 1$ and
  $D/d = 2$ (figure 12) is approximately
  $0.26$, approximately
  $30\,\%$ higher than that produced by a uniform cylinder of the same diameter. The NS regime is characterized by a dual peak in the velocity spectra, one peak centred on the small cylinder vortex shedding frequency and the other centred on a slightly lower frequency (e.g.
  $L/D = 0.2$ and
  $D/d = 2$ in figure 12). These spectral peaks detected in the streamwise velocity spectra for the NS regime are attributed to the periodic passage of small cylinder vortices linking across the wake of the large cylinder. Specifically, the vortex filaments linking across the wake have a reduced convective velocity when compared to the small cylinder vortices forming away from the step, producing the lower frequency peak in the spectra. The higher frequency peak in the spectra matches the small cylinder shedding frequency and is present due to the velocity fluctuations produced by the nearby shedding of small cylinder vortices. Not surprisingly, as the size of the large cylinder disturbance is reduced (e.g.
  $L/D$ or
  $D/d$ decreases), the dual peaks in the spectra begin to merge.

Figure 12. Spectral analysis of velocity measurements obtained in the wake of a dual-step cylinder at  $x/D = 5, y/D = 0.75, z/D = 0$, for
  $Re_D = 2100$. (a)
  $D/d = 1.33$. (b)
  $D/d = 1.6$. (c)
  $D/d = 2.0$. (d)
  $D/d = 2.67$. (e)
  $D/d = 4.0$.

Figure 13. Diagram of large cylinder wake regimes expected for a dual-step cylinder. The boundaries between different regimes are marked by solid and dashed lines, with the latter drawn based on extrapolation of the present data and results from other relevant studies.  $+$ symbols represent the
  $L/D$ and
  $D/d$ investigated at
  $Re_D = 2100$,
  $\bigcirc$ symbols represent the
  $L/D$ and
  $D/d$ investigated at
  $Re_D = 1050$ by Morton & Yarusevych (Reference Morton and Yarusevych2012),
  $\square$ are data from Zdravkovich et al. (Reference Zdravkovich, Brand, Mathew and Weston1989),
  $\times$ are data from Zdravkovich et al. (Reference Zdravkovich, Flaherty, Pahle and Skelhorne1998),
  $\triangle$ are data from Inoue & Sakuragi (Reference Inoue and Sakuragi2008),
  $\triangleright$ are data from Dunn & Tavoularis (Reference Dunn and Tavoularis2006) and
  $\triangledown$ are data from Lewis & Gharib (Reference Lewis and Gharib1992). Solid grey is used to identify the region where the dual-step cylinder flow regime is unknown. Note that this map pertains to Reynolds numbers corresponding to the shear layer transition regime.
3.3. Quantitative flow regime map
In this section, the results from the present investigation and the findings of previous studies on related geometries are synthesized and projected onto a flow regime map (figure 13) which contains supporting insets of quantitative information (figure 13). Supplementary hydrogen bubble flow visualization Movies 2–5 can also be viewed as they correspond to each of the insets. The boundaries of the distinct flow regimes identified in figure 13 are marked by solid and dashed lines. Solid boundary lines represent an extrapolation between data points in the present study. The uncertainty in the placement of the boundary lines can be inferred based on the spacing between adjacent data points in  $D/d$ and
  $L/D$ directions (figure 13). Dashed lines are an extrapolation between results of the present study and the results of studies on similar geometries, such as uniform cylinder (Gerich & Eckelmann Reference Gerich and Eckelmann1982), cylinder with free ends (Farivar Reference Farivar1981; Gerich & Eckelmann Reference Gerich and Eckelmann1982) and a single-step cylinder (Lewis & Gharib Reference Lewis and Gharib1992; Dunn & Tavoularis Reference Dunn and Tavoularis2006; Morton & Yarusevych Reference Morton and Yarusevych2012), shown schematically at the corresponding map boundaries. While the map is strictly drawn for Reynolds numbers which pertain to turbulent vortex shedding conditions within the shear layer transition regime, it is recognized that much of the reported flow characteristics and regime transitions may persist for a wider range of Reynolds numbers. The specific
  $L/D$ and
  $D/d$ values for regime transitions are expected to be a function of
  $Re_D$, while some regimes, such as the IS and AIS regime, may manifest differently at lower Reynolds numbers pertaining to laminar shedding conditions.
Experimental studies on cylinders with two free ends under turbulent flow conditions by Zdravkovich et al. (Reference Zdravkovich, Brand, Mathew and Weston1989) and Zdravkovich et al. (Reference Zdravkovich, Flaherty, Pahle and Skelhorne1998), and laminar flow conditions by Inoue & Sakuragi (Reference Inoue and Sakuragi2008), form the basis for the extrapolation of the flow regime boundaries for  $D/d \rightarrow \infty$. In particular, for very low aspect ratio coin-like cylinders whose aspect ratio is less than approximately
  $L/D = 1$ (Zdravkovich et al. Reference Zdravkovich, Flaherty, Pahle and Skelhorne1998; Inoue & Sakuragi Reference Inoue and Sakuragi2008), no vortex shedding occurs from the cylinder. This flow topology corresponds to the NS regime for a dual-step cylinder (figure 13).
At higher  $L/D$, in the range
  $2 \leq L/D \leq 8$, vortex shedding occurs from a cylinder with two free ends (Zdravkovich et al. Reference Zdravkovich, Brand, Mathew and Weston1989). The shedding is described by Zdravkovich et al. (Reference Zdravkovich, Brand, Mathew and Weston1989) as irregular, with a variation in vortex shedding frequency with time. Asymmetrical patterns are noted by Zdravkovich et al. (Reference Zdravkovich, Brand, Mathew and Weston1989) in skin friction line visualizations suggesting asymmetry in the flow development. Given that Inoue & Sakuragi (Reference Inoue and Sakuragi2008) did not observe such irregular behaviour for laminar flow cases, this is thought to be a Reynolds number dependent characteristic of the flow development, with irregular vortex shedding occurring only within a turbulent vortex shedding regime. The characteristics are similar to those observed in the IS and AIS regimes in the present study. Therefore, a transition between the NS and IS regime is expected to occur within
  $1 \leq L/D \leq 2$ for
  $D/d \rightarrow \infty$ (figure 13). On the other hand, the IS regime will persist up to at least
  $L/D \approx 8$. The results of Zdravkovich et al. (Reference Zdravkovich, Brand, Mathew and Weston1989) suggest that with increasing
  $L/D$ in the range
  $2 \leq L/D \leq 8$, the coherence of the vortex shedding increases. For
  $L/D > 8$, it is speculated that this trend continues, and a transition from the IS to the LFS flow regime will occur for
  $L/D \approx 10$ (figure 13).
Under laminar vortex shedding conditions, Inoue & Sakuragi (Reference Inoue and Sakuragi2008) found that vortex shedding from a cylinder with two free ends occurs in a single vortex shedding cell up to  $L/D \approx 20$. Three distinct vortex shedding cells form in a free end cylinder wake for
  $L/D > 20$. This critical aspect ratio is similar to that reported for cantilevered cylinders under both laminar and turbulent shedding conditions (Farivar Reference Farivar1981; Gerich & Eckelmann Reference Gerich and Eckelmann1982), and, hence, with increasing
  $D/d$ the boundary between the LFS and CS regime is expected to asymptotically approach
  $L/D \approx 20$ for
  $D/d \rightarrow \infty$, as shown in figure 13. At
  $D/d = 2$ (Morton & Yarusevych Reference Morton and Yarusevych2012), transition from the LFS to the CS regime occurs at approximately
  $L/D = 14\text {--}15$ (figure 13). Hence, for
  $2 < D/d < \infty$, results are extrapolated between
  $L/D = 14.5$ and
  $20$. For
  $D/d < 2$, insight into the
  $L/D$ boundary between the LFS and CS regime can be gained from experimental data available for single-step cylinders (Lewis & Gharib Reference Lewis and Gharib1992). Note that in figure 13 the results of Lewis & Gharib (Reference Lewis and Gharib1992) are assumed to be representative of
  $L/D \approx \infty$ since the aspect ratio of their larger diameter cylinder was greater than 100. In the CS regime, the flow development within
  $z/D > 0$ and
  $z/D < 0$ matches that found for a single-step cylinder for the same diameter ratio and Reynolds number (Morton & Yarusevych Reference Morton and Yarusevych2014b). According to Lewis & Gharib (Reference Lewis and Gharib1992), for a single-step cylinder geometry with
  $D/d$ greater than approximately 1.25–1.55, under laminar vortex shedding conditions, a low frequency vortex shedding cell forms near the step discontinuity in the large cylinder wake, and a higher frequency vortex shedding cell forms across the remainder of the large cylinder span. The wake topology corresponds to the CS regime due to the presence of multiple vortex shedding cells in the large cylinder wake. For
  $D/d < 1.25$, the low frequency cell is absent (Lewis & Gharib Reference Lewis and Gharib1992). While this suggests the wake topology would match that of the LFS regime, it is well documented that, in uniform circular cylinder wakes, unless end conditions are intentionally modified (e.g. inclining endplates in Williamson Reference Williamson1989), cellular shedding will take place for models with aspect ratios greater than about
  $L/D \approx 20\text {--}30$ (Gerich & Eckelmann Reference Gerich and Eckelmann1982). Further experimentation is necessary to clarify dual-step cylinder flow development at these low diameter ratios, which is illustrated in figure 13 with a solid grey region.
3.4. POD analysis
The coherent structures forming in the large cylinder wake were analysed using a POD analysis of the horizontal ( $x\text {--}y$) plane PIV measurements. The snapshot POD method of Sirovich (Reference Sirovich1987) enables a decomposition of the time-varying velocity field into a finite sum of spatial eigenmodes,
  $\phi _k$, multiplied by time-dependent temporal modal coefficients,
  $a_k$. Each eigenvalue,
  $\lambda _k$, represents the energy contribution of the corresponding eigenmode. It has been well established that the coherent structures embedded in an otherwise turbulent flow are linked to the primary eigenmodes contributions to the fluctuating kinetic energy (Berkooz, Holmes & Lumley Reference Berkooz, Holmes and Lumley1993). Thus, the aim of the POD analysis is to link the observed changes in wake topology to changes in the fluctuating kinetic energy associated with the vortex shedding dynamics. Figure 14 shows the energy distribution over the first one hundred POD modes for each investigated model as well as for a uniform circular cylinder of diameter
  $D$. Based on previous studies conducted on uniform cylinder geometries (Perrin et al. Reference Perrin, Braza, Cid, Cazin, Barthet, Sevrain, Mockett and Thiele2007), a superposition of the mean flow and the first harmonic pair of POD modes serves to approximate vortex shedding in the cylinder wake. The results pertaining to a uniform cylinder at
  $Re_D = 2100$ show that the first two modes capture approximately
  $60\,\%$ of the fluctuating kinetic energy content, agreeing with previous studies on uniform cylinders (e.g. Perrin et al. Reference Perrin, Braza, Cid, Cazin, Barthet, Sevrain, Mockett and Thiele2007; Kourentis & Konstantinidis Reference Kourentis and Konstantinidis2012). For dual-step cylinders, depending on
  $L/D$ and
  $D/d$, the first two modes in the large cylinder wake account for between
  $12\,\%$ and
  $60\,\%$ of the energy content (figure 14), reflecting the changes in strength and coherence of the large cylinder vortices in different flow regimes (figure 12). In the LFS and HFS regimes, where strongly coherent shedding takes place from the large cylinder, the first two modes capture between
  $45\,\%$ and
  $60\,\%$ of the fluctuating kinetic energy content in the wake, similar to that of a uniform circular cylinder (figure 14). The IS and AIS flow regimes are characterized by low energy content in the first two modes (between
  $12\,\%$ and
  $30\,\%$), indicating that the dominant coherent structures are significantly weaker than those found for a uniform cylinder. Finally, for the NS regime, the energy content contained in the first two modes increases with decreasing aspect ratio, from less than
  $25\,\%$ for
  $L/D = 0.5$, to more than
  $40\,\%$ for
  $L/D = 0.2$ for a fixed
  $D/d = 2$ (figure 14). To confirm that the dominant vortical structures in each flow regime are associated with vortices being shed periodically from the large diameter cylinder, the first few spatial modes and corresponding temporal coefficients were studied in more detail (not shown here for brevity). For all dual-step cylinder models investigated, no low frequency modes or higher harmonics were present in the third, fourth or fifth spatial modes, indicating fundamentally different shedding dynamics when compared to a uniform circular cylinder (e.g. Noack et al. Reference Noack, Afanasiev, Morzynski, Tadmor and Thiele2003). Instead, the higher modes for dual step cylinders correspond to asymmetric structures in the wake that may be linked to oblique vortex shedding, vortex stretching, vortex splitting and associated vortex interactions with the adjacent vortex cells in the small cylinder wake.

Figure 14. Distribution of the eigenmode energy obtained from a POD analysis of two-dimensional PIV measurements in the wake of a dual-step cylinder in an  $x\text {--}y$ plane at
  $z/D = 0$. The legend in
  $(a)$ applies to both images.
3.5. Structural loads
Simultaneous drag and lift measurements were performed on dual-step cylinder models for  $Re_D = 2100$,
  $1.6 \leq D/d \leq 4$ and
  $0.5 \leq L/D \leq 5$. Additionally, measurements of drag and lift were performed on uniform circular cylinders for baseline comparison. The aim of this section is to relate the measured forces to the dominant wake regimes (figure 13).
The effect of diameter ratio and aspect ratio on the drag coefficient for a dual-step cylinder is shown in figure 15. Herein, the drag coefficient is defined based on the drag force normalized by the dynamic pressure and frontal projected area of the model or model section of interest. Note that the data at  $D/d = 1$ (figure 15a) correspond to the drag coefficient of a uniform circular cylinder of diameter
  $D$, and the data at
  $L/D = 0$ (figure 15b) correspond to the drag coefficient measured for a uniform circular cylinder of diameter
  $d$. The results in figure 15(a) show that, for
  $L/D \geq 2$, the drag coefficient decreases with increasing
  $D/d$ up to
  $D/d = 2.67$. For
  $D/d \geq 2.67$, the drag coefficient remains approximately constant. On the other hand, for
  $L/D \leq 1$, the drag coefficient does not change significantly with increasing
  $D/d$ up to
  $D/d = 2.67$ (figure 15a), and the drag coefficient increases with increasing
  $D/d$ beyond
  $D/d = 2.67$. To establish how the drag coefficient trends are linked to changes in the flow development in the large cylinder wake, figure 16(a) presents a contour plot of the drag coefficient values overlaid with the two-dimensional map of flow regimes (figure 13). The contour plot shows that the drag coefficient decreases with increasing
  $D/d$ and
  $L/D$ towards the IS regime (figure 16a). Within the IS regime, the drag coefficient reaches a minimum for
  $L/D = 5$ and
  $D/d = 4$ (figure 16a). The results of the present study have shown that within the IS regime, the vortex formation region is elongated substantially and exhibits a lower shedding frequency. This relationship between formation length, vortex shedding frequency and drag force is analogous to the splitter plate experiments by Roshko (Reference Roshko1955). The IS regime corresponds to a case where interference with the vortex shedding instability shifts the formation of the vortices downstream and reduces suction near the base region of the large cylinder.

Figure 15. Effects of diameter ratio and aspect ratio on the drag coefficient for a dual-step cylinder at  $Re_D = 2100$. The drag coefficient is computed based on the frontal area of the dual-step cylinder model. Data at
  $D/d = 1$ in
  $(a)$ pertain to a uniform cylinder of diameter
  $D$, while data at
  $L/D = 0$ in
  $(b)$ pertain to a uniform cylinder of diameter
  $d$.
$d$.

Figure 16. Contour plots of the drag coefficient at  $Re_D = 2100$ for:
  $(a)$ a dual-step cylinder, and
  $(b)$ the large cylinder. Note, boundaries between different flow regimes are marked with solid and dashed lines, with the latter drawn based on extrapolation of the present data and results from other relevant studies. See figure 13 for additional details.
In order to evaluate the influence of the large cylinder on the drag of the dual-step cylinder, the drag force on the large cylinder is estimated by subtracting the drag produced on the small cylinders of diameter  $d$ above and below the large cylinder. The drag on the small cylinders is estimated based on uniform cylinder drag data which were also collected as part of this study. A validation of the large cylinder drag estimation method is illustrated in figure 17. The results in this figure show that, as
  $D/d$ increases, the estimated drag coefficient on the large cylinder decreases to a value approximately matching that obtained by Wieselsberger (Reference Wieselsberger1922) for
  $L/D = 5$ and
  $D/d = \infty$. The effect of the small diameter cylinders on the large cylinder wake development and its structural loading becomes negligible for
  $D/d \geq 2.67$ (figure 17). It can be inferred from these results that the drag force on the large cylinder can be coarsely estimated for all dual-step cylinder models.

Figure 17. Estimates of the large cylinder drag coefficient at  $Re_D = 2100$ for
  $L/D = 5$. Data from Wieselsberger (Reference Wieselsberger1922) are shown with a dashed line.
The overlaid plot of the large cylinder drag coefficient data with the map of flow regimes (figure 16b) shows that a local minimum in the large cylinder drag at  $D/d = 2$, and the lowest drag on the large cylinder at
  $L/D = 0.5$ and
  $D/d = 2$. The latter corresponds approximately with the intersection of the HFS, NS, and IS flow regimes. It should be noted that the presence of the large diameter cylinder affects the flow development in the wake of the small diameter cylinders as well, especially near the step discontinuities.
Figure 18 shows the lift force fluctuations on the dual-step cylinder relative to a uniform cylinder of diameter  $d$. For all dual-step cylinder models, there is a substantial reduction in the measured r.m.s. lift when compared to that of a uniform circular cylinder model. This is attributed to the disruption of the spanwise coherence of the vortex shedding due to the presence of the large cylinder. In particular, the small cylinder vortex shedding above and below the large cylinder will continuously move in and out of phase due to small differences in the shedding frequency above and below the large cylinder, leading to the observed reduction in total r.m.s. lift. The largest reduction in lift force fluctuation, corresponding to a
  $60\,\%$ reduction, is found within the IS regime for high
  $L/D$ and
  $D/d$ values. This is expected since, in the IS regime, the shear layer roll-up in the large cylinder wake is displaced away from the wake centreline and farther downstream (figure 4). As a result, surface pressure fluctuations over the aft portion of the large cylinder are expected to be reduced when compared to those of a uniform circular cylinder. Note that for smaller
  $D/d$ and
  $L/D$ within the IS regime, the lift force fluctuations are substantially higher.

Figure 18. Contour plot of the lift force fluctuations on the dual-step cylinder relative to a uniform cylinder of diameter  $d$ for
  $Re_D = 2100$. Note: the boundaries between different regimes are marked by solid and dashed lines, with the latter drawn based on extrapolation of the present data and results from other relevant studies. See figure 13 for additional details.
4. Conclusion
The flow over dual-step cylinders has been investigated experimentally using flow visualization, velocity measurements, and force measurements for two Reynolds numbers,  $Re_D = 1050$ and
  $2100$, a range of aspect ratios,
  $0.2 \leq L/D \leq 17$, and diameter ratios,
  $1.33 \leq D/d \leq 4$. Through a comprehensive analysis of the complementary qualitative and quantitative measurements, six distinct flow regimes have been identified based on observed changes in the flow development downstream of the large cylinder.
In the CS and LFS regimes, which are characteristic of high aspect ratio dual-step cylinders, vortex shedding from the large cylinder occurs in one or more distinct cells, with the coherence and strength of vortex shedding resembling that of a uniform circular cylinder. The vortex interactions between the distinct cells in these flow regimes is similar to those observed in the wakes of single-step cylinders and uniform cylinders with free end(s), where vortex dislocations occur periodically and are manifested by both vortex splitting and half-loop vortex connections. At lower  $L/D$, a transition to the IS regime occurs. In this regime, vortex shedding in the wake of the large cylinder is highly three-dimensional, and characterized by lower coherence when compared to a uniform cylinders shedding. Kelvin–Helmholtz instability vortices intermittently form within the separated shear layers of the large cylinder, as well as within the transverse-oriented shear layers forming downstream of each step discontinuity.
Within a narrow range of diameter ratios around  $L/D = 1.5$, the coherence and strength of the shed vortices increases, with well-defined periodic vortex shedding occurring from the large cylinder at a frequency higher than that expected for a uniform cylinder. In this HFS regime, small and large cylinder vortices form vortex connections downstream of each step discontinuity in diameter, and vortex dislocations occur periodically due to the difference in the characteristic shedding frequencies of the dominant wake structures. When
  $L/D$ is reduced below approximately one, the wake narrows and becomes asymmetric. In this AIS regime, vortex shedding from the large cylinder is irregular and more prevalent vortex formation occurs on one side of the wake. With further decrease in aspect ratio, vortex formation in the large cylinder wake ceases. In the ensuing NS regime, small cylinder vortices connect across the large cylinder wake, with the large cylinder acting as a local perturbation, which induces progressive deformations of vortex filaments and periodic formation of vortex dislocations, manifested by half-loop vortex connections.
The Reynolds number has an effect on the wake characteristics within each regime, and the transition between flow regimes. Within the IS regime, at  $Re_D = 2100$, shear layer instability vortices intermittently form within the separated shear layers and downstream of each step discontinuity. At lower Reynolds numbers of
  $Re_D = 1050$, shear layer instability vortices do not form but the main flow regimes persist. At Reynolds numbers in the laminar shedding regime, the dynamics of the wake development changes significantly and needs further investigation (Tian et al. Reference Tian, Jiang, Pettersen and Andersson2017; Ji et al. Reference Ji, Cui, Xu, Yang and Srinil2019, Reference Ji, Yang, Cui and Chen2020a,Reference Ji, Yang, Yu, Cui and Srinilb; Tian et al. Reference Tian, Jiang, Pettersen and Andersson2020).
Declaration of interests
The authors report no conflict of interest.
Supplementary movies
Supplementary movies are available at https://doi.org/10.1017/jfm.2020.593.


