


Introduction
Despite being the most abundant group of seabirds in the Southern Ocean, the global population of burrow-nesting petrels is poorly known (Paleczny et al. Reference Paleczny, Hammill, Karpouzi and Pauly2015). Many petrel species breed on remote islands where burrows are often widely distributed, making populations difficult to count and monitor accurately (Brooke Reference Brooke2004). Obtaining reliable estimates of population sizes and trends is central to the effective conservation of seabirds, but collecting quality data for burrow-nesting petrels is often more challenging than for surface-nesting birds; hence, burrow-nesting petrels remain relatively understudied (Rodríguez et al. Reference Rodríguez, Arcos, Bretagnolle, Dias, Holmes and Louzao2019).
Early records of numbers of burrow-nesting petrels on remote oceanic islands were usually crude; order of magnitude estimates of population sizes were made on brief visits to breeding colonies (Blackburn et al. Reference Blackburn, Cassey, Duncan, Evans and Gaston2004). More accurate survey methods are increasingly being developed and used to estimate population sizes and trends over time (Rayner et al. Reference Rayner, Clout, Stamp, Imber, Brunton and Hauber2007, Ryan et al. Reference Ryan, Dilley and Jones2012, Schumann et al. Reference Schumann, Dann, Hoskins and Arnould2013, Whitehead et al. Reference Whitehead, Lyver, Jones, Bellingham, Macleod and Coleman2014). These surveys usually extrapolate burrow densities calculated from transects or plots to the area of available nesting habitat on an island or island group (Barbraud & Delord Reference Barbraud and Delord2006, Lawton et al. Reference Lawton, Robertson, Kirkwood, Valencia, Schlatter and Smith2006, Parker et al. Reference Parker, Rexer-Huber and Thompson2017). This process can result in large error margins, since bias (e.g. observer or habitat availability bias) or error (e.g. incomplete detection of burrows or burrow occupants) are also extrapolated, resulting in imprecise estimates of population size (Parker & Rexer-Huber Reference Parker and Rexer-Huber2015). Reducing this error is especially important if estimates are to be used for detecting trends in the population size over time (e.g. short-term changes after rodent eradications and long-term trends influenced by varied marine threats, climate change and pollution), because small or moderate changes may not be detected if error margins are too large (e.g. Oppel et al. Reference Oppel, Hervías, Oliveira, Pipa, Silva and Geraldes2014). However, error margins around population estimates can be reduced by designing a survey specific to species and sites (Parker & Rexer-Huber Reference Parker and Rexer-Huber2015).
Sub-Antarctic Marion Island (46°54'S, 37°45'E; 293 km2) in the south-west Indian Ocean provides not only a sobering example of the consequences of introduced domestic cats (Felis catus L.; introduced 1948, eradicated by 1991) and house mice (Mus musculus L.; early 1800s to present), but also an opportunity to develop methodologies to reduce the effects of bias and error when surveying burrow-nesting petrel populations. Post-cat eradication, the recovery of burrow-nesting petrel numbers on Marion Island has been much slower than anticipated, and continuing predation by mice is the most probable explanation for the limited recovery of the island's petrel populations (Dilley et al. Reference Dilley, Schramm and Ryan2017a). Currently, mice are suppressing the recovery of burrow-nesting petrel populations, especially among petrel species that breed in winter, through depredation of eggs and chicks (Dilley et al. Reference Dilley, Schoombie, Stevens, Davies, Perold and Osborne2017b).
A mouse eradication attempt using aerial baiting is planned for the winter of 2021 (Preston et al. Reference Preston, Dilley, Cooper, Ryan, Veitch, Clout, Martin, Russell and West2019). In preparation for this, we endeavoured to establish baseline population estimates of three key burrow-nesting petrel species pre-eradication. The distribution and abundance of white-chinned (Procellaria aequinoctialis L.) and blue (Halobaena caerulea (Gmelin)) petrels were assessed with independent systematic surveys at Marion Island in 2009 (Ryan et al. Reference Ryan, Dilley and Jones2012) and in 2012 (Dilley et al. Reference Dilley, Davies, Schramm, Connan and Ryan2017c), respectively. In the present study, we test the effect of sampling strategy (random transect or systematic survey) on population size estimates of burrow-nesting petrels on this large sub-Antarctic island. White-chinned, blue and great-winged petrel (Pterodroma macroptera (Smith)) burrows were recorded along random 25 m-wide strip transects from the coast to the upper limit of petrel breeding habitat inland. We hypothesize that random transects are suitable for species such as great-winged petrels that are widely distributed at low densities, but become increasingly poor for estimating the population sizes of species with loosely (white-chinned petrels) or strongly clustered distributions (blue petrels).
Methods
Study area
Marion Island is the summit of a Hawaiian-type shield volcano and is relatively flat for its size (293 km2), with a predominantly gentle slope rising to 1240 m in the central highland (Hedding Reference Hedding2008). The geology is dominated by older Pleistocene basaltic ‘grey’ lavas and younger Holocene ‘black’ basaltic lavas and scoria (Boelhouwers et al. Reference Boelhouwers, Meiklejohn, Holness, Hedding, Chown and Froneman2008). Above 750 m, there is a barren polar desert (Hedding Reference Hedding2008). Areas below 300 m are well vegetated, especially the steep slopes of the grey lava ridges, which have well-drained soils and support mosaics of tussock grassland, herbfield and fernbrake (Gremmen & Smith Reference Gremmen, Smith, Chown and Froneman2008). Several volcanic eruptions subsequent to glaciations have resulted in extensive areas of broken rocky black lava flows and scoria cones that cover 80% of Marion Island. The older black lavas are now undulating vegetated hummocks, whereas the younger flows remain raw black lava expanses with little to no soil or vegetation cover. More detailed descriptions of the geological and vegetation classes used in this study are listed in Supplemental Table S1.
Designing the random transect survey
BJD and PGR led systematic island-wide surveys of white-chinned (16 April to 5 May 2009; Ryan et al. Reference Ryan, Dilley and Jones2012) and blue petrels (18 April to 6 May 2012; Dilley et al. Reference Dilley, Davies, Schramm, Connan and Ryan2017c) on Marion Island. During these surveys, we visited all suitable-looking habitat, paying particular attention to areas with the tussock grass (Poa cookii (Hook.f.)), which is indicative of seabird manuring (Schramm Reference Schramm1986; see methods in Ryan et al. Reference Ryan, Dilley and Jones2012, Dilley et al. Reference Dilley, Schramm and Ryan2017a). Systematic surveys were chosen since both species have clustered distributions: white-chinned petrels breed in loose colonies and blue petrels in dense colonies. Although we focused on recording the distribution of one species during each of these two independent systematic surveys, we also noted how great-winged petrel burrows appeared to be widely dispersed at low densities. To estimate the number of the great-winged petrel burrows, we conducted random strip transects in 2015 and took the opportunity to also record all white-chinned and blue petrel burrows we encountered in the transects to test the accuracy of random and targeted survey methods for estimating populations of petrels with varying spatial distributions. We selected 52 transect lines that started where the coast intersected each 1.0' of longitude and 0.5' of latitude, and we proceeded inland perpendicular to the coast to the upper limit of suitable habitat (Figs 1–4). Since burrows of our study species are not found in bare rock/unvegetated habitat, transect lines ended at the vegetation line (250–400 m elevation). Start and end waypoints of transects were determined in Google Earth prior to walking transects and located using handheld Garmin Global Positioning System (GPS) units in the field. A 25 m-wide strip along the full length of the transect was surveyed by two observers who walked in parallel on the outer edges of the strip and counted all burrows within this strip. To minimize observer bias, the four observers walked the first transect together to standardize the methodology and identification of burrows; thereafter, we walked in pairs, regularly switching partners. Strip transects were later broken down into smaller plots of a standard size (25 m wide × 50 m long), which resulted in a string of adjacent plots extending inland from the coast.
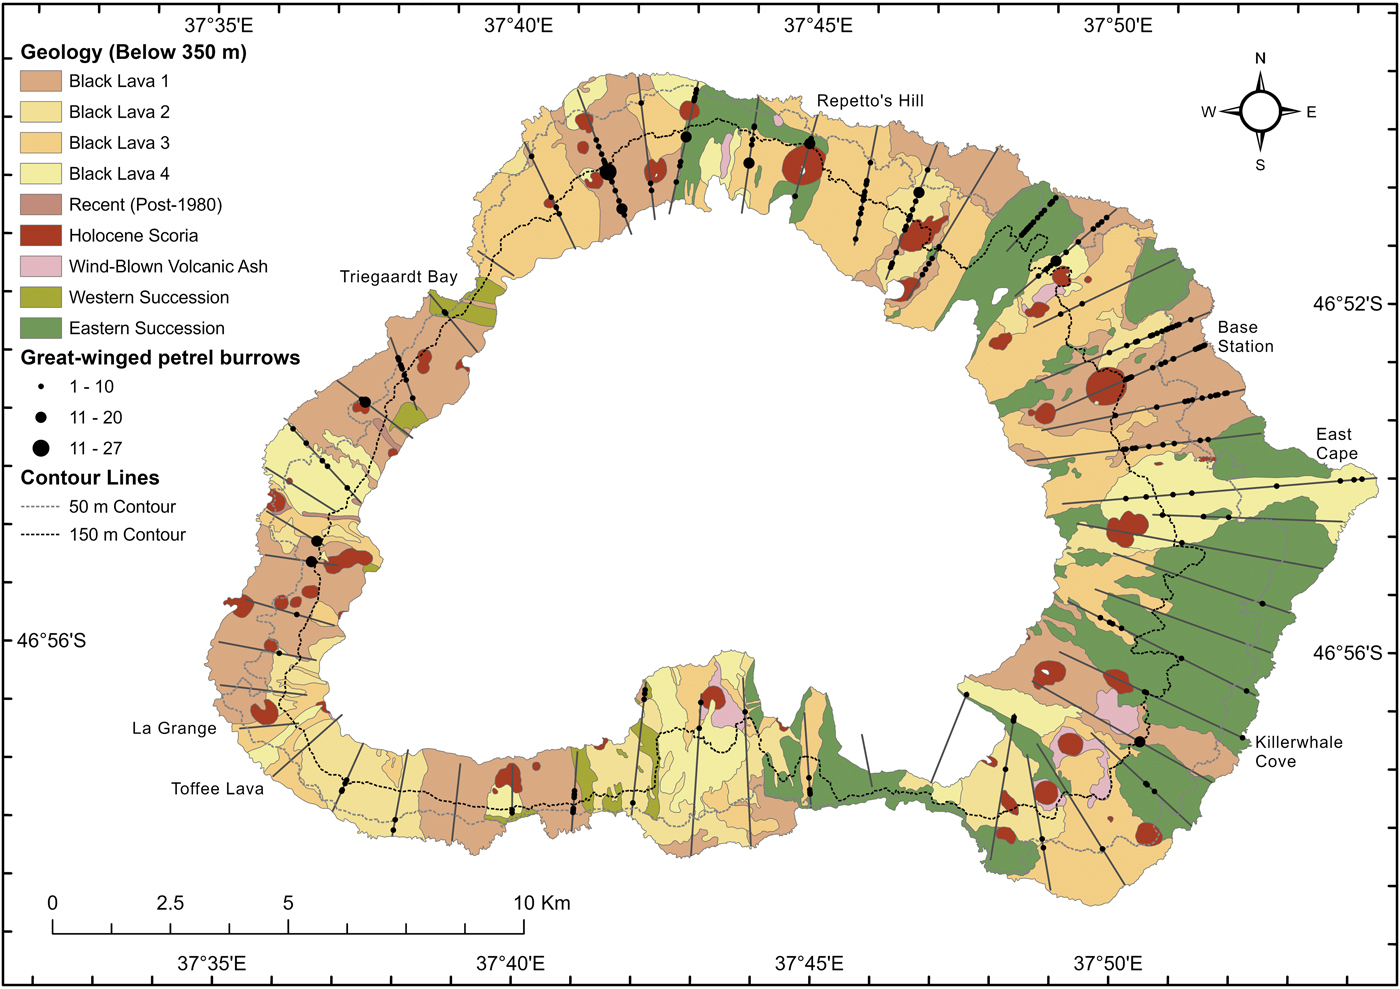
Fig. 1. The distribution of great-winged petrel burrows found along 52 random strip transects (25 m-wide lines running inland from the coast) sampled at Marion Island in 2015 relative to the main geological features (below 350 m) (Boelhouwers et al. Reference Boelhouwers, Meiklejohn, Holness, Hedding, Chown and Froneman2008).
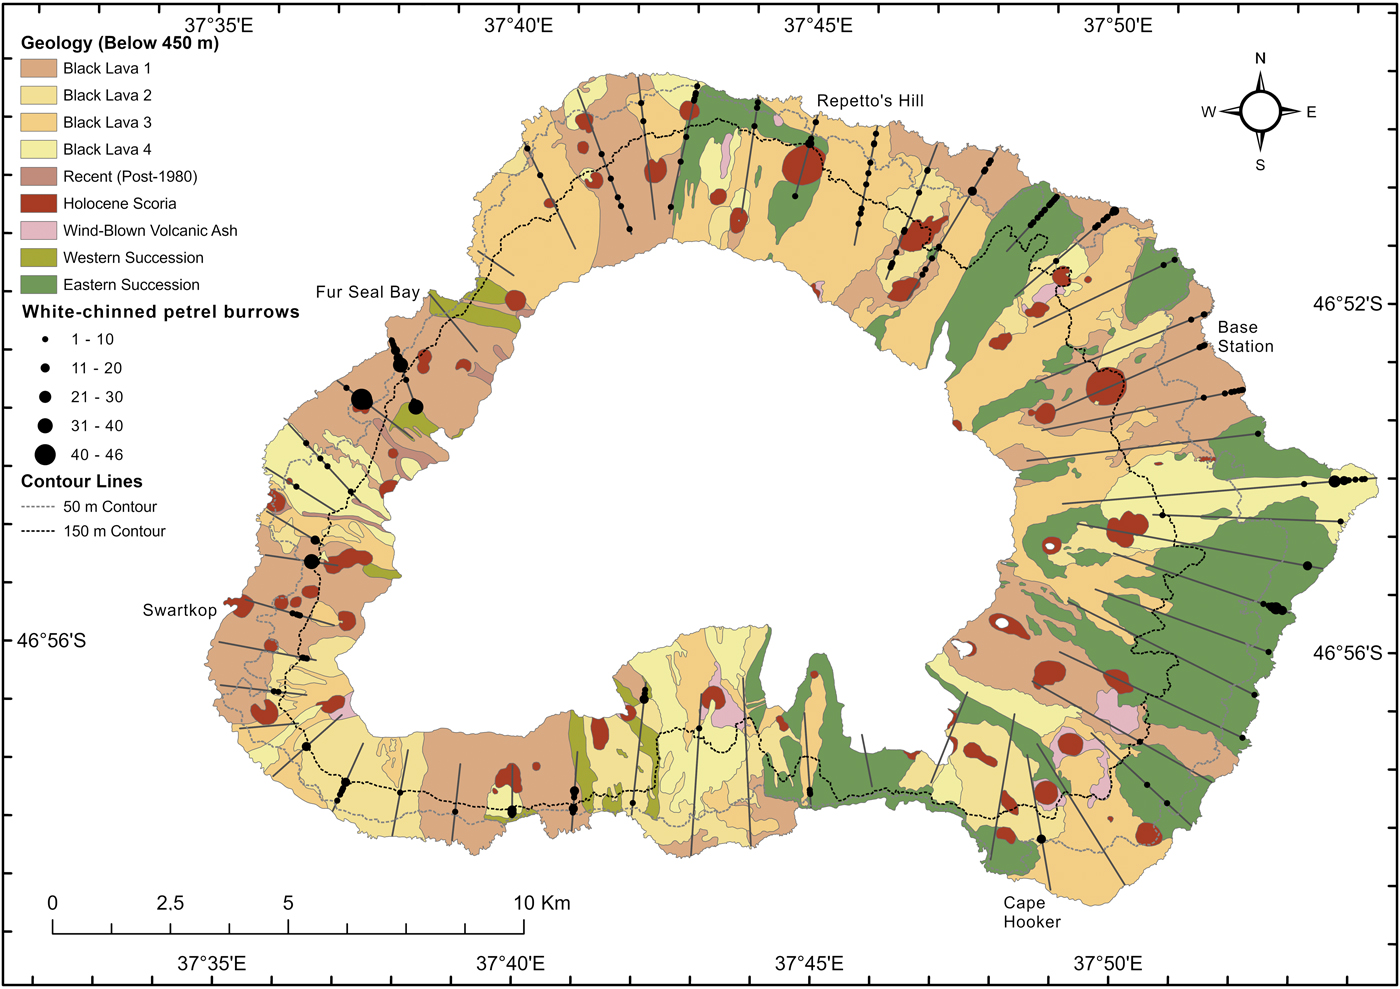
Fig. 2. The locations of white-chinned petrel burrows found along 52 random strip transects (25 m-wide lines running inland from the coast) sampled at Marion Island in 2015 relative to the main geological features (below 450 m) (Boelhouwers et al. Reference Boelhouwers, Meiklejohn, Holness, Hedding, Chown and Froneman2008).
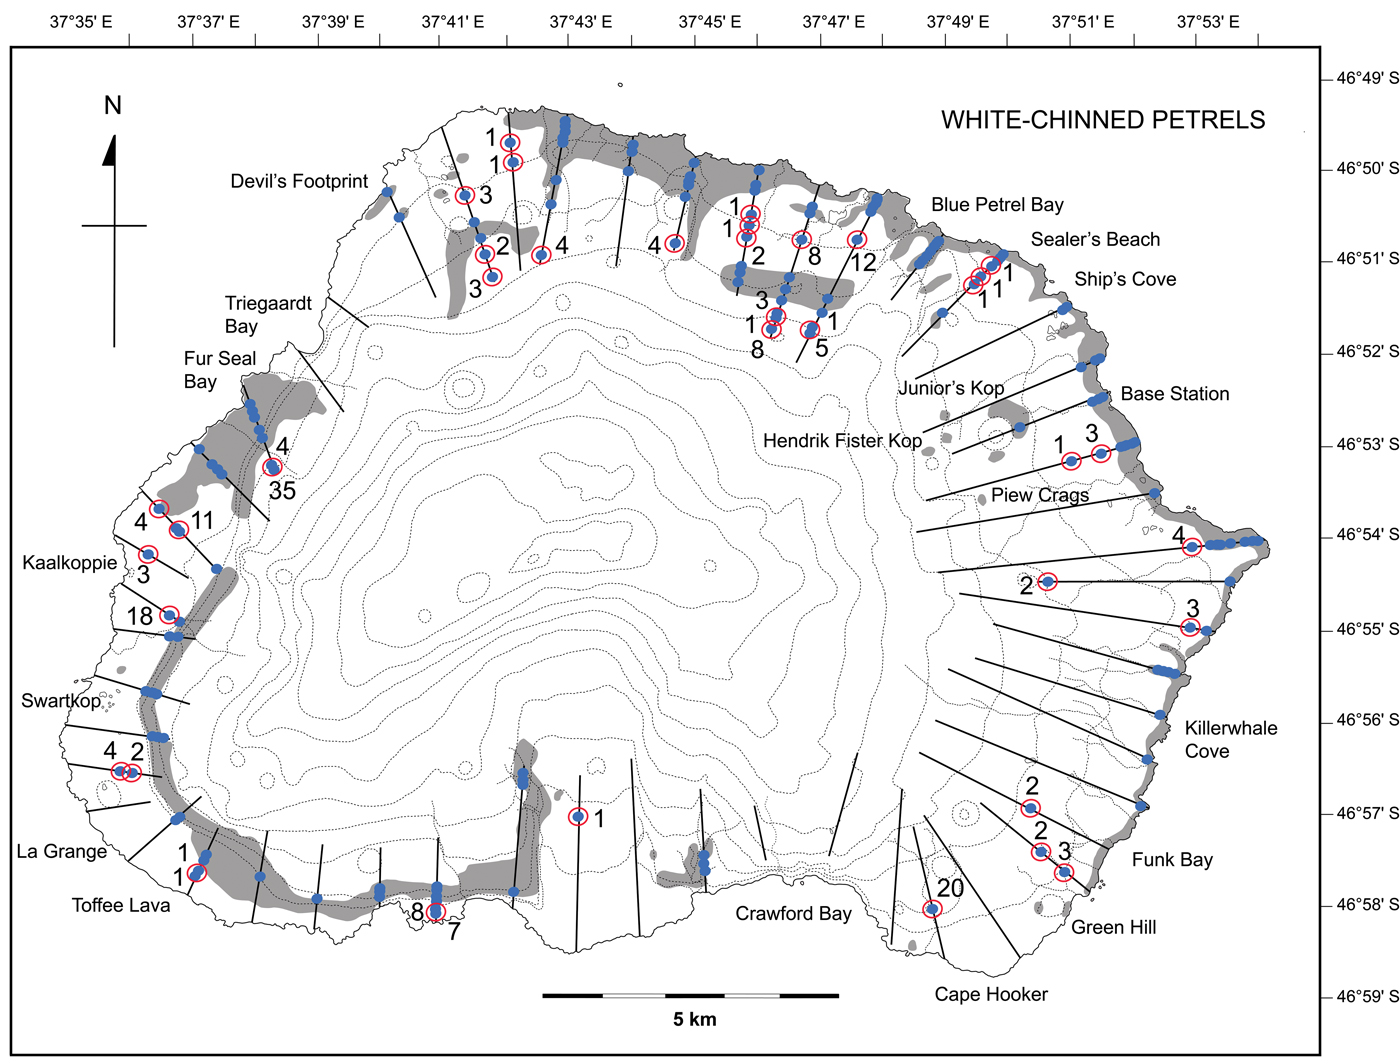
Fig. 3. The distribution of white-chinned petrel burrows at Marion Island (adapted from Ryan et al. Reference Ryan, Dilley and Jones2012) assessed using two sampling techniques: systematic in 2009 (whole-island counts, grey shading) and random in 2015 (52 strip transects = black lines running inland from the coast; total 144 km). The blue dots indicate the locations of burrows within the 25 m-wide strip transects; those circled in red were not recorded in the systematic survey (numbers indicate burrow counts at these sites).

Fig. 4. The distribution of blue petrel burrows at Marion Island (adapted from Dilley et al. Reference Dilley, Davies, Schramm, Connan and Ryan2017c) assessed using two sampling techniques: systematic in 2012 (whole-island counts, light shade = low and medium density, dark shade = high and very high density) and random in 2015 (52 strip transects = black lines running inland from the coast; total 144 km). The blue dots indicate the locations of burrows within the 25 m-wide strip transects; those circled in red were not recorded in the systematic survey (numbers indicate burrow counts at these sites).
Identifying burrows and timing of the surveys
Two pairs of people completed 2–6 transects per day, and all 52 transects were walked between 14 April and 1 May 2015. This coincides with the annual relief voyage to Marion Island, which is the only time when there is a sufficiently large team on the island to undertake such a labour-intensive task. This was before the great-winged petrels lay (laying occurs from late May to early July; Fig. 5), but breeding pairs were renovating their burrows before their pre-laying exodus. Great-winged petrels (c. 500–650 g) have some temporal overlap with white-chinned petrels (c. 950–1800 g), which breed in summer (Dilley et al. Reference Dilley, Davies, Stevens, Schoombie, Schoombie and Ryan2019; Fig. 5); however, most white-chinned petrel chicks have already fledged or are near to leaving their burrows by late April. White-chinned petrel burrows could be identified by tufts of down stuck to vegetation at the burrow entrance (from near-fledged chicks exercising their wings at night), an acrid smell of a well-used burrow and no fresh vegetation lining. There is evidence that some burrows are shared between summer- and winter-breeding species on Marion Island (Dilley et al. Reference Dilley, Davies, Stevens, Schoombie, Schoombie and Ryan2019); thus, some recently vacated white-chinned petrel burrows might be used by great-winged petrels (and vice versa). Grey petrel (Procellaria cinerea (Gmelin)) burrows were not surveyed, but are mentioned here as they are the only other petrel species on Marion Island that also breeds in large burrows (Schramm Reference Schramm1986). On Marion Island, grey petrels breed in caves and burrows (Schramm Reference Schramm1986, Dilley et al. Reference Dilley, Schoombie, Stevens, Davies, Perold and Osborne2017b), but nests are extremely scarce; burrows are renovated in late February with peak laying from late March to mid-April (Fig. 5), so at the time of the survey, grey petrels were incubating.

Fig. 5. Breeding cycles of four species of burrow-nesting petrels on Marion Island. Abbreviations refer to the periods of renovation of burrows (R), pre-lay exodus (Ex), laying and incubation (Inc), hatching and chick rearing (Chicks) and fledging (Fl). The period between the vertical lines indicates the timing of the white-chinned (2009), blue (2012) and great-winged petrel (2015) surveys during the annual relief voyages. Although not surveyed, the grey petrel breeding cycle is included here for comparison with white-chinned petrels, which have similar-sized burrows.
Although this survey was outside of the blue petrel's (summer) breeding season, blue petrels (c. 160–250 g) were present, as they return to the island from mid-April to mid-May, after a post-breeding moult period at sea (Fugler et al. Reference Fugler, Hunter, Newton and Steele1987), to reoccupy and renovate their burrows.
Only burrows that were overgrown or obviously collapsed were excluded from the count; all other burrows were identified and included. We did not account for burrow detection probability since the low vegetation allowed observers to easily detect burrows in the 25 m-wide strip transect. For details of systematic surveys for white-chinned and blue petrel burrows, see methods in Ryan et al. (Reference Ryan, Dilley and Jones2012) and Dilley et al. (Reference Dilley, Davies, Schramm, Connan and Ryan2017c).
Petrel burrows were located and identified using a combination of the following indicators.
1) Vegetation: pockets of taller vegetation where there is deep soil - mainly Blechnum penna-marina (Poir.) or Acaena magellanica (Lam.)/P. cookii mix. Single burrows often have a few tufts of Poa at the entrance (Smith 1976) that are easily spotted on a Blechnum slope, even at a distance.
2) Burrow entrance characteristics: active burrows showed signs of fresh excavations, feathers, down and droppings; active great-winged petrel burrows have extensive cropping of vegetation adjacent to the burrow entrance in a distinct ‘oblong’ L-shaped strip and typically have a dry tunnel entrance, whereas white-chinned petrels crop vegetation randomly around the burrow entrance and usually have a moat or wet mud in the entrance tunnel (Dilley et al. Reference Dilley, Schramm and Ryan2017a); blue petrels tend to have very sparse nest lining and consequently very little cropped vegetation around the entrance.
3) Burrow entrance shape and size: great-winged petrel burrow entrances are generally slightly smaller and lower (average 217 ± 50 mm wide by 167 ± 33 mm high) than white-chinned (269 ± 28 mm wide by 207 ± 31 mm high) and grey petrel (238 ± 32 mm wide by 200 ± 29 mm high) burrow entrances (Dilley et al. Reference Dilley, Schramm and Ryan2017a). Blue petrel entrances are markedly smaller (142 ± 23 mm wide by 110 ± 10 mm high), but are readily distinguished from the even-smaller burrows of Salvin's prions (112 ± 10 mm wide by 96 ± 9 mm high; Dilley et al. Reference Dilley, Davies, Schramm, Connan and Ryan2017c). Blue petrels also readily responded to an imitated call-back (also used in the systematic survey; Dilley et al. Reference Dilley, Davies, Schramm, Connan and Ryan2017c).
4) Physical confirmation: this involved observing a bird in the burrow or feeling a response to probing into the nesting chamber of the burrow with a stick (Ryan et al. Reference Ryan, Dilley and Jones2012).
Mapping burrow locations
When a burrow was found, we recorded the species, aspect and location waypoint. We selected five habitat attributes most likely to affect the distribution and abundance of petrel burrows: geology (G), vegetation (V), slope (S), elevation (E) and aspect (A). These habitat attributes were selected based on Schramm (Reference Schramm1986) and on our field experience. Spatial data of the five habitat attributes were plotted using the Geographic Information System (GIS) ArcGIS® 10.1. Slope and aspect data were derived from a 5 m digital elevation model generated using 10 m contour data for Marion Island supplied by National Geo-spatial Information, a component of the Department of Rural Development and Land Reform in South Africa. Slope data were categorized into 5° segments up to 45°, with the last category being 45°–90°. Aspect data were divided into eight categories of equal extent of 45° (e.g. N, NE, E, etc.). Geology and spatial vegetation data were obtained from Boelhouwers et al. (Reference Boelhouwers, Meiklejohn, Holness, Hedding, Chown and Froneman2008) and Mucina & Rutherford (Reference Mucina and Rutherford2006), respectively (Table S1). The spatial locations of burrows for each target species were mapped within each 25 m-wide transect using handheld GPS units with a horizontal accuracy of c. 3 m. The five habitat attributes associated with each burrow location could then be determined. We chose the elevation cut-offs (rounded up to the nearest 50 m) for density extrapolations based on the highest burrow recorded for each species in this transect survey: great-winged petrels 350 m, white-chinned petrels 450 m and blue petrels 200 m.
Estimating the number of burrows
Using GIS, we calculated the surface areas of categories for each habitat attribute (geology, vegetation, slope, elevation and aspect) within the 52 transects and within the total island area being sampled (species specific). All area calculations were based on planimetric area using a transverse Mercator projection. Burrow densities within transects were calculated as the number of burrows counted in each category of an attribute relative to the category surface area. To estimate confidence intervals (CIs) for the extrapolated population estimates, we used burrow counts in standardized plots generated within the strip transects (plots were 25 m wide × 50 m length, extending inland from the coast) with no associated habitat variables. These plot count data were grouped by 50 m elevation bands. We dealt with the excess of zeros (plots with no burrows) by hierarchical non-parametric bootstrapping of the data to generate means, standard errors and 95% CIs for each elevation band, run using library boot in R (R Core Team 2014) with 5000 iterations. Burrow estimates are reported to the nearest 100 burrows and as means ± SD unless otherwise stated.
Statistical analysis of burrow abundance
We used generalized linear models (GLMs) to quantify the relationship between transect-level burrow abundance and five habitat attributes for white-chinned and great-winged petrels. Due to the low sample size, we excluded blue petrels from the analysis. We developed five candidate models with different combinations of habitat attributes and a null model for each species, and we used Akaike information criterion (AIC) model selection (Burnham & Anderson Reference Burnham and Anderson2002) to assess relative model quality. Given that the response variable was burrow counts, we used a Poisson error structure with a log link function in the GLMs. Model fit was assessed by examining residual plots, and spatial autocorrelation was investigated by checking spatial bubble plots of the residuals. All models were run in R using the glm function for linear models and the aictab function from the AICcmodavg package (https://cran.r-project.org/package=AICcmodavg) for model selection.
Comparison with systematic surveys
Burrow-nesting petrel surveys usually involve an initial survey to estimate the total number of burrows, followed by occupancy trials to determine what proportion of the burrows contain breeding pairs. For white-chinned and blue petrels, we compared the 2015 random transect results with the results from systematic surveys (years 2009 and 2012) using the estimated total number of burrows (before adjusting for occupancy). For comparison of the survey efforts between the systematic and random surveys, we compared the ‘main survey person-days’ (i.e. total person-days to complete main surveys during the relief voyages), the ’finish-off days’ (i.e. total survey days spent completing the surveys after the relief voyages) and the occupancy trial days.
Results
An area of 360 ha (1.2% of the island area and 2.0% below 350 m) was surveyed during the 143.9 km of transects (n = 52, length 2.7 ± 1.2 km (SD), range 0.9–6.7 km). The relatively flat terrain allowed access to all transects apart from two inaccessible areas of steep, barren cliffs near the coast at Crawford Bay, which we could not access (Figs 1–4, each < 5% of the respective transects). We assumed that these rocky habitats were unlikely to support any burrows.
Burrow counts
Great-winged petrel burrows were recorded in 44 of the 52 transects around the island, most frequently in transects on the north and north-eastern sections of the island (Fig. 1). Burrows were not found in areas of large black lava flows (e.g. Toffee Lava, La Grange, north of Kaalkop, north of Triegaardt Bay), where the soils are too shallow to support burrows. Other transects that intersected patches of seemingly favourable habitat also did not include any burrows (e.g. the east coast inland from Killerwhale Cove). A total of 774 burrows was recorded at 237 sites (Table I); most sites had only one (35%) or two (19%) burrows. Great-winged petrel burrows were found up to 5.3 km inland from the coast at East Cape and at up to 325 m elevation inland of Repetto's Hill (Fig. 1). The greatest concentrations of burrows (51% of all burrows) occurred in the northern sector of the island.
Table I. The estimated number of great-winged, white-chinned and blue petrel burrows (before correcting for occupancy) on Marion Island using systematic (whole-island counts) and random (52 transects, 25 m wide, total 144 km) sampling techniques.

The percentage difference is relative to the relevant systematic estimate.
aBurrow densities estimated from 52 random transects and extrapolated to the planar surface area of five habitat attributes to generate island-wide estimates (abbreviations for model combinations: G = geology, V = vegetation, E = elevation, A = aspect, S = slope).
bCount data were bootstrapped with 5000 iterations (see ‘Methods’ section for details).
cRyan et al. (Reference Ryan, Dilley and Jones2012).
dDilley et al. (Reference Dilley, Davies, Schramm, Connan and Ryan2017c).
A total of 1070 white-chinned petrel burrows were recorded along 44 of the 52 transects (Table I); the greatest concentrations were found in the north-west (Swartkop to Fur Seal Bay, 35% of burrows) and the north-east (Repetto's Hill to Sealers' Beach, 19% of burrows; Fig. 2). Half (49%) of the 184 sites had > 3 burrows in clusters (average 5.8 ± 7.2 burrows per site), and 51% of the sites contained 1–3 burrows. Three moderate-sized colonies were found that were missed in the systematic survey in 2009: inland of Cape Hooker on the south-east coast (n = 20 burrows), south of Kaalkoppie (n = 18) and inland of Fur Seal Bay (n = 35) on the west coast, representing 6.8% of all burrows counted (Fig. 3). An additional 39 previously unrecorded sites were found around the island (Fig. 3), mostly inland of the high-density coastal areas. Overall, 200 burrows were counted in areas outside the range recorded in 2009, representing 18% of the 1070 burrows counted along transects in 2015.
Blue petrels were recorded at 29 sites along 13 of the 52 transects containing a total of 2680 burrows (Table I). Five new sites were found that were missed in the systematic survey in 2012, comprising a total of 120 burrows (4% of total burrow count; Fig. 4).
Model selection
For great-winged petrels, the top model included vegetation, elevation, aspect and slope (VEAS), but the full model with all habitat attributes (GVEAS) also received considerable support (ΔAIC < 2; Table II). We selected the VEAS model as the most parsimonious, which was supported by an Akaike weight of 0.61. For white-chinned petrels, the top model included all habitat attributes (GVEAS; Table II). This model had a high Akaike weight (0.95), which indicated a high probability that, of the candidate models, the full model best described the data. In both species, the model residuals were approximately normally distributed and the bubble plots indicated no significant spatial autocorrelation (Figs S1–S3).
Table II. Results of the Akaike information criterion (AIC) model selection for generalized linear models of burrow abundance and habitat attributes for two petrel species.

K = number of model parameters; ΔAIC = the difference in AIC between sequential models; w AIC = Akaike model weight; Cum. w AIC = cumulative model weights.
The white-chinned petrel model showed an effect of aspect and vegetation on burrow abundance, with abundance being higher on west-facing slopes and in mire-slope and fellfield vegetation. There was no clear effect of geology, slope or elevation. Similarly, great-winged petrel burrow abundance was higher on west-facing slopes, and there were significantly more burrows in mire-slope, fellfield and coastal vegetation compared to cinder cones.
Total burrow estimates
Estimates of the number of great-winged petrel burrows on Marion Island in 2015 ranged from 28 500 to 36 800 burrows (32 model combinations; Table S2). The top model (VEAS) estimated 33 300 burrows (95% CI 16 900–47 000; Table I) and predicted that 52% of burrows should occur from 50 to 150 m, where birds favour the deep soils associated with the oldest black lavas in the fellfield and mire-slope habitats (44% of burrows).
The projected number of white-chinned petrel burrows on Marion Island in 2015 ranged from 40 200 to 56 400 (Table S2). The top model (GVEAS) estimated 40 200 burrows (95% CI 19 850–57 500; Table I), with 83% of burrows at < 100 m elevation and 59% of burrows in the oldest (most weathered) ‘black lava 1’ habitats in either the coastal, fellfield or mire-slope vegetation. This is 31% greater than the 2009 systematic estimate of 30 800 white-chinned petrel burrows (Table I) (Ryan et al. Reference Ryan, Dilley and Jones2012).
Blue petrel burrow estimates ranged from 102 500 to 152 800 burrows (Table S2), 44% (31–83%) less than the systematic estimate of 214 700 burrows (Table I) (Dilley et al. Reference Dilley, Davies, Schramm, Connan and Ryan2017c). Based on field experience (low sample size excluded statistical model selection analysis), we selected the model GVEA as the most representative, since according to this model most burrows (> 95%) should occur at < 100 m elevation, and 25% are expected in old weathered black lavas and 19% on eastern succession fellfield and mire-slope vegetation. This model estimated there were 124 100 blue petrel burrows on Marion Island in 2015 (95% CI 40 500–191 000; Table I).
Discussion
The design of burrow-nesting petrel surveys on remote oceanic islands requires careful consideration of multiple factors that are likely to influence the accuracy of their results. Survey effort may be constrained by resources (e.g. time on islands, boating schedules, budgets and availability of personnel) and the island structure (e.g. accessibility, vegetation height and density; see Schumann et al. Reference Schumann, Dann, Hoskins and Arnould2013). On small islands (< 200 ha) where burrow distributions are relatively uniform within clearly defined habitats (e.g. 143 ha Moutohora in New Zealand; Imber et al. Reference Imber, Harrison, Wood and Cotter2003), a systematic survey is practical to achieve accurate estimates with a modest survey effort. However, larger islands where burrow-nesting petrels have patchy distributions and specific habitat associations (e.g. Marion Island 293 km2, Schramm Reference Schramm1986; Campbell Island 112 km2, Parker et al. Reference Parker, Rexer-Huber and Thompson2017) usually require a substantial survey effort.
The survey effort for this random transect survey was substantially less than for the systematic surveys (Table III) (Ryan et al. Reference Ryan, Dilley and Jones2012, Dilley et al. Reference Dilley, Davies, Schramm, Connan and Ryan2017c). However, the systematic surveys had narrower CIs than the random surveys. Systematic surveys are more laborious, involving extensive coverage of the island to search for colonies and detailed mapping of colonies that probably provide better estimates of the variance in densities and occupancies in various habitats than random transect surveys would. Both random and systematic surveys might overlook some colonies and thus underestimate the total population, but for species that are widely dispersed at low densities on large islands, such as the great-winged petrel, systematic surveys are not always possible. When repeat systematic surveys are carried out, it is important to control for sampling effort, especially if population trends are mainly driven through changes in the density or extent of existing colonies (rather than the formation/disappearance of entire colonies).
Table III. Summary of the survey effort to estimate the population sizes of great-winged petrels in 2015 (52 random transects, 25 m wide, total 144 km) compared to systematic whole-island counts of white-chinned and blue petrels at Marion Island in 2009 (Ryan et al. Reference Ryan, Dilley and Jones2012) and 2012 (Dilley et al. Reference Dilley, Davies, Schramm, Connan and Ryan2017c).

Establishing good baseline estimates of burrow-nesting petrel populations requires as much ‘real’ data as possible (i.e. ideally, 100% coverage of the habitat a species uses). However, this is not always possible or practical, but identifying and limiting the sources of error when planning a survey can improve accuracy and reduce the error margins (Parker & Rexer-Huber Reference Parker and Rexer-Huber2015) and ultimately improve the ability to detect trends in population sizes over time. On Marion Island, the relatively flat terrain allows for easy access to 95% of the island, and the low vegetation allows for reliable burrow detection within fairly wide strip transects (25 m for two observers). This approach would be ineffective where deep vegetation conceals burrow entrances or in more mountainous terrain. Solutions to ensure high burrow detection rates in spite of terrain and/or deep vegetation include distance sampling and using shorter, narrow transects (e.g. 2 m wide) or small plots (e.g. Lawton et al. Reference Lawton, Robertson, Kirkwood, Valencia, Schlatter and Smith2006, Rayner et al. Reference Rayner, Clout, Stamp, Imber, Brunton and Hauber2007, Parker et al. Reference Parker, Rexer-Huber and Thompson2017, Rexer-Huber et al. Reference Rexer-Huber, Parker, Sagar and Thompson2017).
The availability and use of accurate GIS habitat maps enable large swathes of unsuitable habitat to be excluded from future surveys (e.g. grey lava, recent black lava on Marion Island). Large petrel burrows also gradually disappear above 350 m elevation since the higher elevation areas (> 600 m) are unsuitable for most large burrow-nesting petrel species. The wide variance in the overall burrow estimates is strongly influenced by the skewed distribution of burrows within the sample transects. Although extrapolating burrow densities by habitat attributes in multiple combinations produced island-wide estimates, assessing the accuracy of these estimates required further analysis of burrow counts in standardized plots. The standard error around the mean burrow count per plot was largest for blue petrels (clustered) and smaller for the more dispersed species (Fig. 6).

Fig. 6. The mean (± standard error) number of petrel burrows counted within sample plots (25 m wide × 50 m long) along 52 random transect lines extending inland from the coast at Marion Island. Count data were bootstrapped by elevation band using hierarchical non-parametric bootstrap analysis run using library boot (Canty & Ripley Reference Canty and Ripley2012) in R (R Core Team 2014) with 5000 iterations to generate the means and standard errors presented here. Note the y-axis scale is different for the blue petrels.
Great-winged petrels
This was the first attempt to estimate the number of great-winged petrel burrows on Marion Island. Rand (Reference Rand1954) reported that in the early 1950s ‘many [great-winged petrel] nests were isolated but others were grouped on tussock slopes and ridges (e.g. on Long Ridge) where the soft soil was easily worked’ and that ‘burrows were usually sited where surface water could not settle’ (p. 194). Our random transects confirmed that great-winged petrel burrows are widely distributed at low densities around Marion Island; 54% of the 237 sites had only 1–2 burrows. Vegetation and elevation proved to be strong predictors of burrow distribution, with birds favouring deep soils (see Schramm Reference Schramm1986) associated with the oldest black lavas in the fellfield and mire-slope habitats (44% of burrows), especially at 50–150 m elevation (Fig. 6). Nevertheless, the patchy and dispersed distribution of burrows makes a systematic survey of all great-winged petrel burrows impractical on such a large island. Random sampling proved to be a time-effective approach to estimating the numbers of this widely distributed petrel, but its usefulness is limited by the large variances resulting from truly randomized (rather than targeted) sampling. Large variances restrict our ability to detect subtle changes in population density in future surveys, but we should be able to detect range expansions. Close monitoring of breeding colonies would be a useful adjunct to document population changes over time, provided disturbance from repeated burrow checks does not unduly influence the persistence of birds in the study area.
White-chinned petrels
The random transects intersected most of the large areas where concentrations of white-chinned petrels were found in 2009 (Ryan et al. Reference Ryan, Dilley and Jones2012). However, by the nature of random transects, some core areas were missed, either partly or entirely, such as the B. penna-marina slopes below Junior's Kop, Hendrik Fister Kop and Piew Crags. Although burrow distribution was broadly represented by the random transects, the estimates of the total number of white-chinned petrel burrows based on model extrapolations were all higher than the systematic estimate. The greater population estimate in 2015 partly reflects the location of burrows outside areas identified in 2009 (18% of all burrows), as well as ongoing growth in this species' population on Marion Island (Dilley et al. Reference Dilley, Schramm and Ryan2017a). However, it is also probable that the patchy distribution skews results when random sampling data are extrapolated across all suitable habitat from a relatively small sampling base (2.4% of area < 450 m elevation).
Blue petrels
Random transect sampling greatly underestimated the number of blue petrel burrows on the island compared to the estimate from the systematic count (Dilley et al. Reference Dilley, Davies, Schramm, Connan and Ryan2017c). This resulted from the failure of the relatively coarse grid of random transects to sample some key areas of blue petrel distribution (e.g. Green Hill and Grey-headed Ridge). Other key areas were intersected by transects, but the more densely clustered colonies were missed (e.g. south of Kampkoppie, La Grange and Junior's Kop). Overall, the results were skewed by the small number of sites encountered by random transects, which failed to represent the habitats favoured by blue petrels or the range of sites where blue petrels are known to breed. These results highlight the value of targeted sampling for species with highly clustered distributions.
Conclusions
Random sampling protocols remain a standard tool for estimating burrowing petrel populations, and they are valuable for detecting changes in population range and density. However, where resources and time allow, random samples should be augmented by systematic surveys, as they provide a more reliable estimate of the total population, particularly for species with highly clustered distributions. Standardizing sampling effort during systematic surveys is difficult for monitoring long-term population changes, but the information gained from a systematic survey is valuable to inform the design of a less intensive set of fixed transects to be sampled repeatedly for longer-term monitoring. However, it is important to note that repeated fixed transects might overlook colony-scale changes in populations (i.e. the formation/disappearance of colonies), which require occasional systematic surveys to check for large-scale range changes.
It is also important to consider the interval between surveys when designing a monitoring programme for burrow-nesting petrels. These birds have conservative life histories characterized by low reproductive rates and long lifespans, which usually makes it difficult to detect increases in population size over the short to medium term. There are exceptions, such as the steady increase in spectacled petrels (Procellaria conspicillata (Gould)) surveyed in 1999, 2004, 2009 (Ryan & Ronconi Reference Ryan and Ronconi2011) and 2018 (FitzPatrick Institute unpublished data) at Inaccessible Island. However, more frequent surveys may be appropriate for declining populations, where catastrophic events or a substantial increase in mortality can lead to rapid population declines.
Acknowledgements
The Department of Environmental Affairs provided logistical support through the South African National Antarctic Programme. Financial support was received from the University of Cape Town and the National Research Foundation. Thanks to Vonica Perold for help with the 2015 field survey. We thank two anonymous reviewers for extensive edits and helpful suggestions.
Author contributions
BJD, SS, AO and PGR planned the fieldwork and completed the survey and post-survey fieldwork (SS); DWH completed all GIS analyses; DAWH completed all model statistics; BJD analysed the data and wrote the draft; PGR assisted with manuscript edits/preparation; KR-H and GCP contributed to drafts.
Supplemental information
Three figures and two tables will be found at https://doi.org/10.1017/S0954102019000300.
Data deposit
Raw data files will be archived for future reference with Figshare and with the Niven Library at the University of Cape Town (http://www.fitzpatrick.uct.ac.za/fitz/nivenlibrary/about).


