1. INTRODUCTION
Laser-produced plasma (LPP) has broad prospects for application, such as inertial confinement fusion, laser-induced breakdown spectroscopy, x-ray sources, etc. (Salik et al., Reference Salik, Hanif, Wang and Zhang2014; Pisarczyk et al., Reference Pisarczyk, Gus'kov, Renner, Demchenko, Kalinowska, Chodukowski, Rosinski, Parys, Smid, Dostal, Badziak, Batani, Volpe, Krousky, Dudzak, Ullschmied, Turcicova, Hrebicek, Medrik, Pfeifer, Skala, Zaras-Szydlowska, Antonelli, Maheut, Borodziuk, Kasperczuk and Pisarczyk2015; Roy et al., Reference Roy, Harilal, Hassan, Endo, Mocek and Hassanein2015; Wu et al., Reference Wu, Higashiguchi, Li, Arai, Hara, Kondo, Miyazaki, Dinh, Dunne, O'Reilly, Sokell and O'Sullivan2016). Within the laser parameters of 1010 ≤ I LλL ≤ 1012, which I L (W/cm2) is the laser intensity and λL (μm) is the laser wavelength, LPP has been developed as a practicable candidate for the extreme ultraviolet lithography (EUVL) sources. Due to it emits strongly in the in-band EUV region (13.5 nm with 2% bandwidth), tin has been identified as the most efficient target material of interest for LPP–EUVL sources (Richardson et al., Reference Richardson, Koay, Takenoshita, Keyser and Al-Rabban2004; George et al., Reference George, Silfvast, Takenoshita, Bernath, Koay, Shimkaveg and Richardson2007), especially pure tin-droplet target has been employed in the high volume manufacturing EUVL source (Mizoguchi et al., Reference Mizoguchi, Nakarai, Abe, Nowak, Kawasuji, Tanaka, Watanabe, Hori, Kodama, Shiraishi, Yanagida, Soumagne, Yamada, Yamazaki, Okazaki and Saitou2015). To improve the EUV conversion efficiency (CE), a pre-pulse technology is employed in CO2 laser-produced tin-droplet plasma (Fujioka et al., Reference Fujioka, Shimomura, Shimada, Maeda, Sakaguchi, Nakai, Aota, Nishimura, Ozaki and Sunahara2008). However, the debris generated along with EUV emissions will directly impact the collector mirror, which placed about 150–200 mm from the plasma source. This debris mainly contains energetic ions and neutral atoms in laser-produced Sn plasma. To protect the collector mirror in EUVL source, the energetic ions of which the debris are reduced to a low population by some approaches, such as magnetic fields (Ueno et al., Reference Ueno, Soumagne, Sumitani, Endo, Higashiguchi and Yugami2008; Roy et al., Reference Roy, Murtaza Hassan, Harilal, Endo, Mocek and Hassanein2014), mass-limited targets (Higashiguchi et al., Reference Higashiguchi, Hamada and Kubodera2007). Hence, the ions kinetic characteristics of the laser-produced tin-droplet plasma is worthy of attention.
Except for improving the CE, pre-pulse technology is benefit to reduce the energetic ions for extending the lifetime of EUVL source. A 1064 nm picosecond laser is induced as a pre-pulse in Tao's study of ions mitigation in laser-irradiating solid tin target (Tao & Tillack, Reference Tao and Tillack2006). Compared with that without pre-pulse, the flux peak of the ion kinetic energy has been reduced to more than 30 times without loss of in-band EUV CE. In effect, the target irradiated by the pumping laser is replaced by the preformed Sn plasma when employing a pre-pulse. In the case of tin-droplet target, Okazaki et al. (Reference Okazaki, Nakamura, Akiyama, Toya, Takahashi and Okada2009) investigated Sn atoms kinetic behavior by a laser-induced fluorescence method and a high-speed imaging, respectively, where the target is irradiated by a CO2 laser combined with a pre-pulse Nd:YAG laser. It is found that pre-pulse technology is useful for the mitigation of the particle debris. With the same combination of CO2 laser and a Nd:YAG pre-pulse laser, Hassanein (Reference Hassanein2011) studied the combined effects of pre-pulse and target geometry on EUV emission. Their results suggest an optimal spot size is of the order of 300 µm, which is for the CO2 laser irradiating on 100 µm droplet-target with the pre-pulse to generate the highest EUV CE.
It is generally known that the critical density in plasma for a 10.6 µm CO2 laser is two orders of magnitude smaller than that for a 1.06 µm Nd:YAG laser (Banine et al., Reference Banine, Koshelev and Swinkels2011). Thus, shorter wavelength Nd:YAG laser easily produces dense plasma that is opaque for longer wavelength CO2 laser, which make the CO2 laser radiation more easily absorbed during the plasma expansion. Because of this, a long wavelength laser with a shorter wavelength pre-pulse laser is commonly employed in pre-pulse technology. Many of the droplet-based studies are focus on single-pulse laser-produced Sn plasma. It is illustrated that the Sn ion average kinetic energy increases with the angle closing to the incident Nd:YAG laser beam (Gambino et al., Reference Gambino, Brandstätter, Rollinger and Abhari2014). Meanwhile, the ion kinetic energy has been found to increase with increasing the ionization stage of Sn ion in study of Nd:YAG laser-produced Sn plasma (Rollinger et al., Reference Rollinger, Morris, Chokani and Abhari2010; Giovannini et al., Reference Giovannini, Gambino, Rollinger and Abhari2015). As to laser-produced tin-droplet plasma with a pre-pulse laser, there are few studies on the characteristic of ions kinetic energy yet. Further study of the ion debris in CO2 laser-produced tin-droplet plasma with a pre-pulse laser is necessary.
In this paper, the kinetic characteristics of Sn ions was investigated by CO2 laser-irradiating tin-droplet target with and without a Nd:YAG pre-pulse laser in vacuum. Ion average kinetic energy has been comparatively studied between Nd:YAG and CO2 laser-produced tin-droplet plasma. The dependence of ion average kinetic energy on the delay time between pre-pulse and pumping pulse has been studied. And we discussed the variation mechanism of ion average kinetic energy in terms of ion acceleration during plasma expansion. In addition, a superimposed Maxwell–Boltzmann (MB) distribution formula is proposed to analyze the detected Sn ion signals from CO2 LPP with the pre-pulse. The plasma temperature and mass-center velocity in CO2 laser-produced preformed plasma are obtained as well by fitting the MB formula with measured ions average kinetic energy.
2. EXPERIMENT ARRANGEMENTS
The schematic of the experimental arrangement is illustrated in Figure 1. A self-made tin-droplet generator has been used for generating uniform 20 kHz tin-droplets with 180 µm diameter in 10−3 Pa vacuum. A continuous Helium–neon laser beam is set to probe the regenerative tin-droplets. Then the generated pulsed signal of Helium–neon laser is detected by a photodiode, and transmitted to a self-made signal delay & generation system, which has a 250 ps time-delay accuracy. This system can produce multiple-independent signals with division and time-delay to trigger one or more lasers. In present operating, the high-frequency tin-droplet signal is divided to 1 Hz, and then triggers the pulse laser working. By coupling the jet velocity of droplet and laser trigger delay, it ensures that one tin-droplet can be accurately hit by the laser pulse below the illumination position of the Helium–neon laser beam. Two lasers are employed: one is 1064 nm Nd:YAG laser with 7.5 ns full-width at half-maximum (FWHM); another one is 10.6 µm CO2 laser with 75 ns FWHM, which has a tail of the order of 1 µs. The Nd:YAG laser and CO2 laser are combined by a self-made mirror, and the combined laser beam is focused by a commons lens with a focal length of 100 mm. The focal spot sizes are 300 and 60 µm, corresponding to the CO2 laser and Nd:YAG laser, respectively.
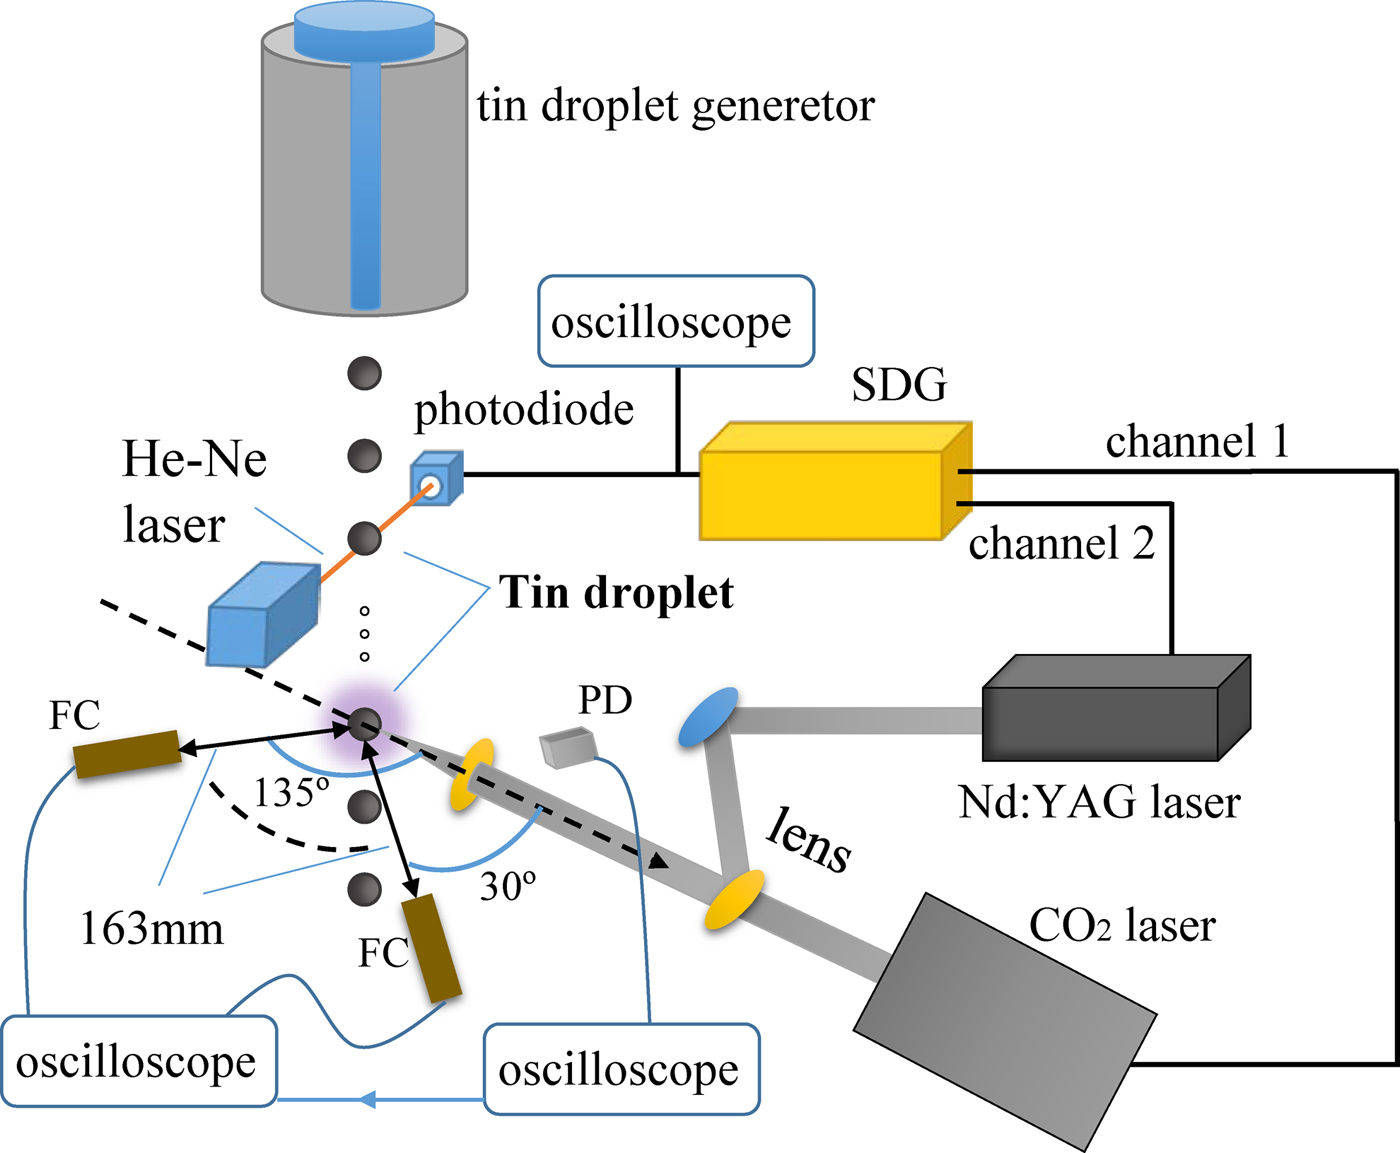
Fig. 1. The schematic of the experimental arrangement for CO2 laser-irradiating tin-droplet with a Nd:YAG pre-pulse laser (SDG, signal delay & generation system; PD, photoelectric detector).
A series of Faraday cups (FCs), which has an open aperture diameter of 6 mm, are employed to detect ions signal. The FCs are biased with a −30 V dc voltage to reject electrons from the laser-produced tin-droplet plasma and protect the secondary electron emission, which placed at the same equatorial plane with the laser axis. The distance from the tin-droplet target to the FCs is 163 mm, and the latter is placed at various angles from 30° to 135° with respect to the laser beam incident direction, which displayed in Figure 1. What's more, the laser temporal waveforms are acquired by a photoelectric detector to obtain the delay time of CO2 laser-irradiating preformed plasma that is the peak interval between CO2 laser and Nd:YAG laser. An oscilloscope is used to record signals from the FCs, which is triggered by another oscilloscope used to recorded laser temporal waveform.
3. RESULTS AND DISCUSSION
In the current experiment, the Nd:YAG laser energy is 48 mJ with the laser intensity of 2.2 × 10¹¹ W/cm2, and the CO2 laser energy is 600 mJ with the laser intensity of 1.2 × 10¹⁰ W/cm2. Many of the Sn droplet-based researches are concentrated on the plasma produced by Nd:YAG laser (Rollinger et al., Reference Rollinger, Morris, Chokani and Abhari2010; Gambino et al., Reference Gambino, Brandstätter, Rollinger and Abhari2014; Chen et al., Reference Chen, Wang, Duan, Lan, Chen, Zuo and Lu2015; Giovannini et al., Reference Giovannini, Gambino, Rollinger and Abhari2015). There is rarely comparison of Sn ions kinetic energy between Nd:YAG laser and CO2 laser yet. Hence, the ions kinetic characteristic are compared between Nd:YAG LPP and CO2 LPP firstly. The Sn ion signals in plasma are detected at different angle θ along with the laser beam incident direction, which are shown in Figure 2 where (a) is for Nd:YAG LPP and (b) is for CO2 LPP. The time marker of ions signal is from the detected laser signal, and the corresponding laser temporal waveform is attached in Figure 2. As shown in Figure 2a, the Sn ion signal from Nd:YAG laser irradiation is a smooth single peak, which decays with the θ increasing. This broad and intense signal of Sn ion is called main peak. The main peak of Sn ion signal from CO2 laser irradiation is not a smooth single peak, and an underintense peak that appears earlier than the main peak is called fast peak, which can be observed in Figure 2b. This fast peak is usually generated by the tail of CO2 laser. If the laser tail is cut off by a plasma shutter, the fast peak will disappear, while the main peak is almost unchanged in CO2 laser-irradiating Sn target (Takahashi et al., Reference Takahashi, Nakamura, Tamaru, Akiyama and Okada2008).
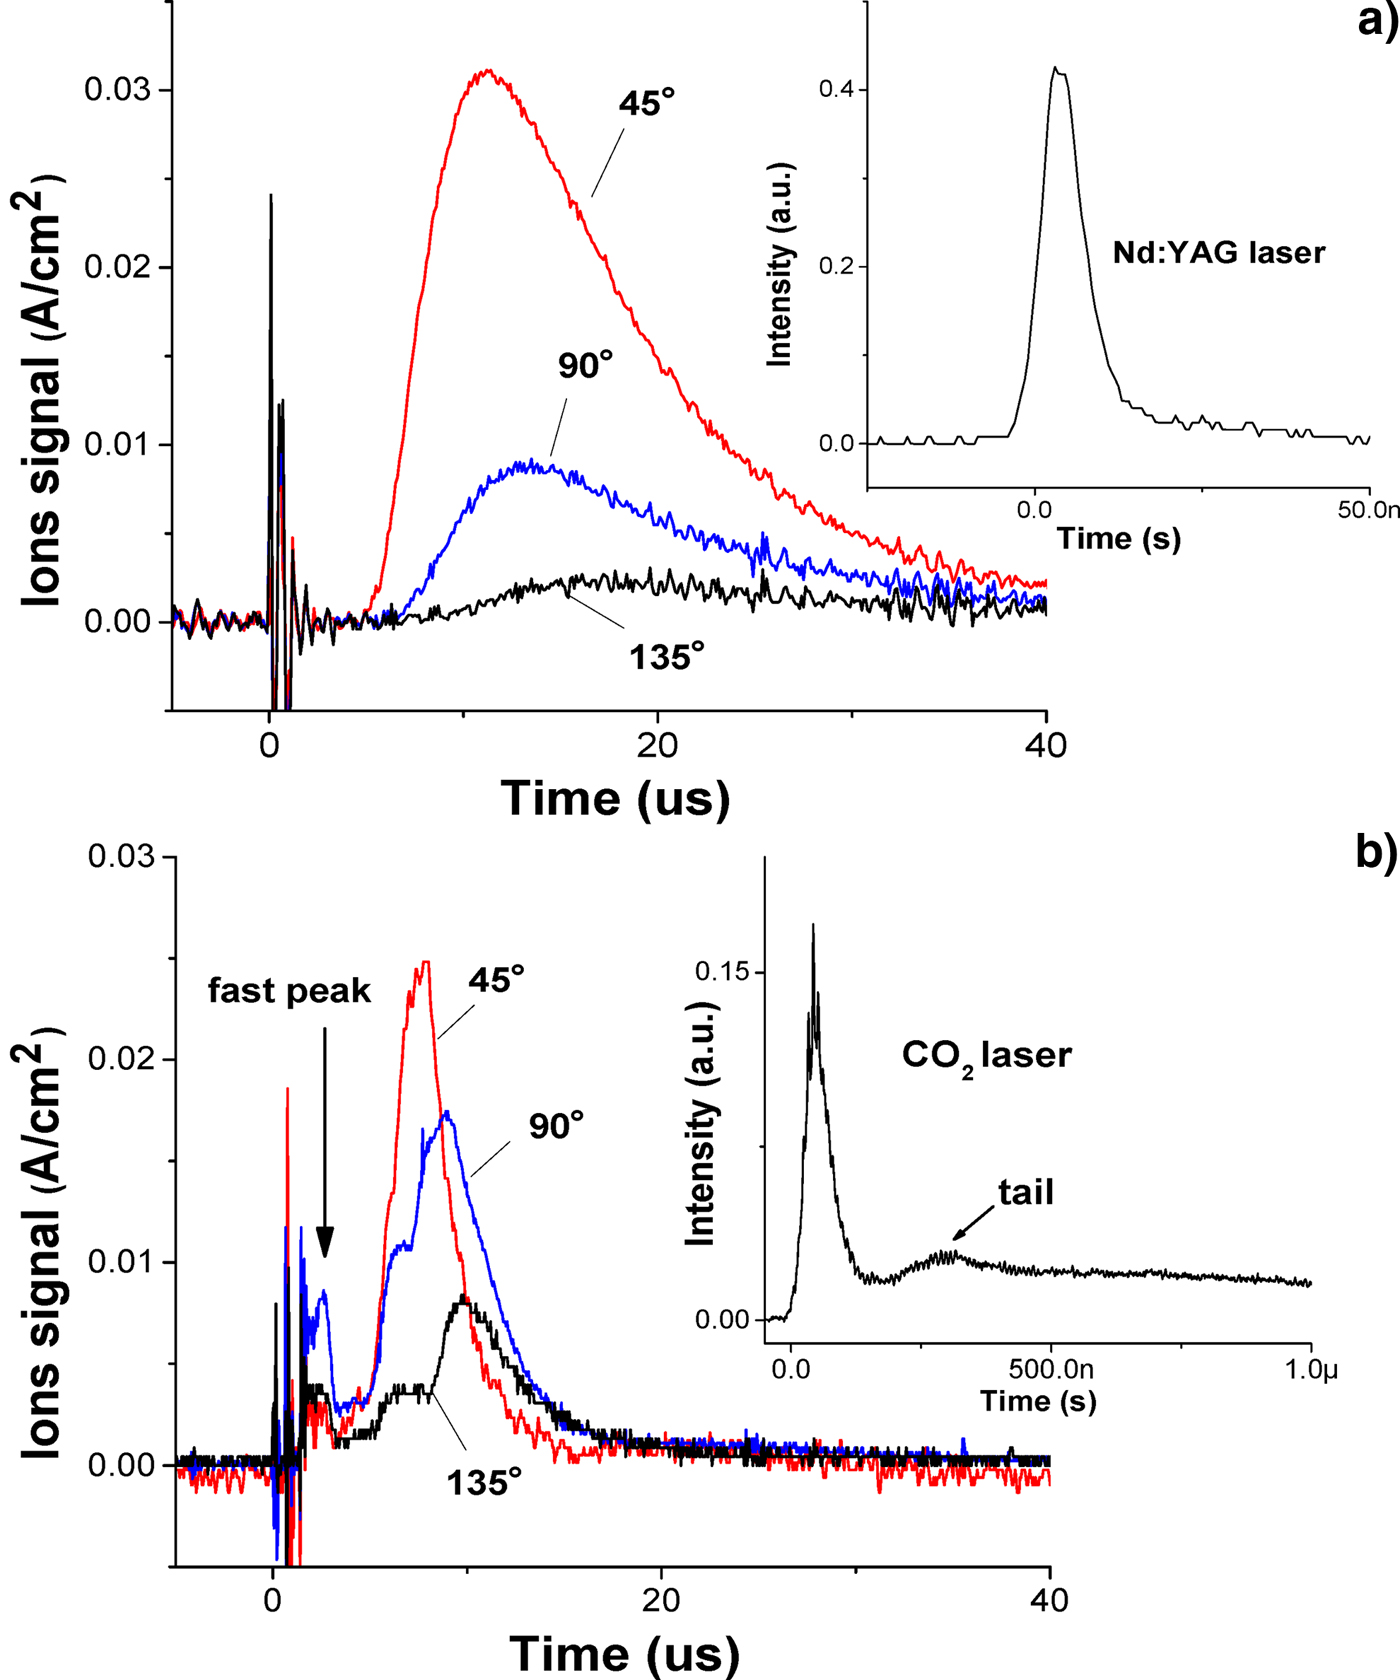
Fig. 2. The Sn ion signals of the plasma with the angle θ of 45°, 90° and 135°. (a) for Nd:YAG LPP; (b) for CO2 LPP.
The ion kinetic energy distribution f (E) in eV−1 derived from the signals in Figure 2 are shown in Figure 3. Considering of the Sn ion signal from CO2 laser irradiation presents more than one peak, the ion average kinetic energy E a is calculated to represent the ion kinetic characteristic in LPP. In the case of CO2 laser-irradiating tin-droplet target, the E a are calculated as 281, 207, and 166 eV corresponding to the θ of 45°, 90°, and 135°, respectively. In the case of Nd:YAG laser-irradiating tin-droplet target, the E a are calculated as 94, 63, and 41 eV corresponding to 45°, 90°, and 135°, respectively. It is illustrated that CO2 laser irradiation promotes more energetic ions than Nd:YAG laser irradiation, although the laser intensity of CO2 laser is smaller than that of Nd:YAG laser. A similar result has been observed at the plate-based Sn target in Takahashi et al.'s study (Takahashi et al., Reference Takahashi, Nakamura, Tamaru, Akiyama and Okada2008) The reason could be attributed to the significant difference in the critical density between CO2 laser and Nd:YAG laser. Compared to CO2 laser, Nd:YAG laser has stronger penetrability and thus the laser radiation absorption appears in deeper region of target surface (Freeman et al., Reference Freeman, Harilal and Hassanein2011). Accordingly, the collision with the surrounding particles will lead to more ion kinetic energy loss during plasma expansion in case of the Nd:YAG laser compared with that of CO2 laser.

Fig. 3. Ion kinetic energy spectrum for Nd:YAG laser and CO2 laser-produced Sn plasma at angle θ of 45°, 90° and 135°.
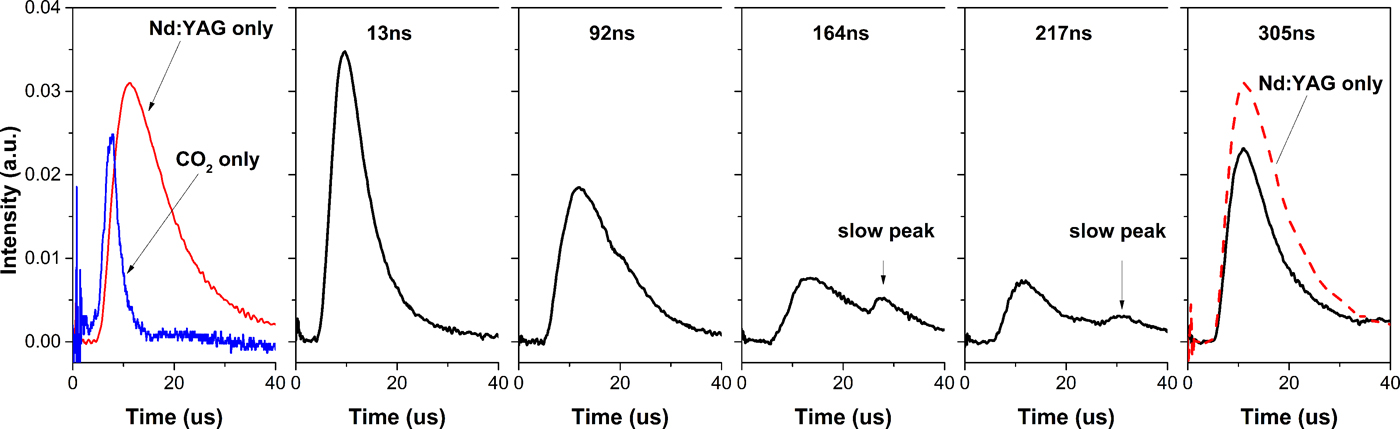
In the plasma generated by CO2 laser with a Nd:YAG pre-pulse laser, the Sn ion signals with several delay times at the θ of 45° are shown in Figure 4. The corresponding Sn ion signals from Nd:YAG laser irradiation and CO2 laser irradiation are presented for a comparison. At 13 ns delay time, the main peak of Sn ion signal is a single peak that sharper than it for Nd:YAG laser irradiation. From delay time of 92 to 217 ns, a slow peak of Sn ion signal comes on which is the underintense signal after main peak. Then the slow peak disappears at 305 ns delay time where the main peak is close to that for Nd:YAG laser irradiation. There is no fast peak appears when employing the Nd:YAG pre-pulse in the current experiment.

Fig. 4. The Sn ion signals (black lines) at the θ of 45° from the plasma generated by CO2 laser with a 48 mJ Nd:YAG pre-pulse. The signals with various delay times are under the same intensity scale as that for 48 mJ Nd:YAG laser (leftmost part).
In order to understanding the variation of the E a in CO2 laser-irradiating preformed plasma, a 32 mJ pre-pulse has also been employed in this experiment for a comparison. The consequent E a with various delay times at the θ of 45° are shown in Figure 5. The dash lines indicate the corresponding E a in 48 and 32 mJ pre-pulse laser-produced Sn plasma. As shown in Figure 5, the maximum E a up to 180 eV in CO2 laser-irradiating preformed plasma which is smaller than the E a of 281 eV for CO2 laser irradiation tin-droplet target. It is illustrated that ion average kinetic energy in CO2 laser-produced Sn plasma can be reduced by employing a Nd:YAG pre-pulse. At the same delay time, CO2 laser-produced Sn plasma with 32 mJ pre-pulse presents smaller ion average kinetic energy than that with 48 mJ pre-pulse. With increasing the delay time, the E a in Sn plasma generated by CO2 laser irradiation with both of 32 and 48 mJ pre-pulse are follow a trend: rapidly increases, then decreases and finally recovers, which in comparison with that of the plasma generated by Nd:YAG pre-pulse laser irradiation. With 32 mJ pre-pulse, the maximum E a of CO2 laser-produced Sn plasma appears at 10 ns delay time which is earlier than the 23 ns in the case of 48 mJ pre-pulse. The minimum E a of CO2 laser-produced Sn plasma with 32 mJ pre-pulse appears at 100 ns delay time, which is also earlier than the 164 ns in the case of 48 mJ pre-pulse, as shown in Figure 5. What's more, the angle dependence of the E a in the case of 48 mJ pre-pulse are shown in Figure 6. It is illustrated that the decreases with the increasing of the angle θ. This is attributed to that the laser energy deposited into preformed plasma mainly focus on the side of incident laser.
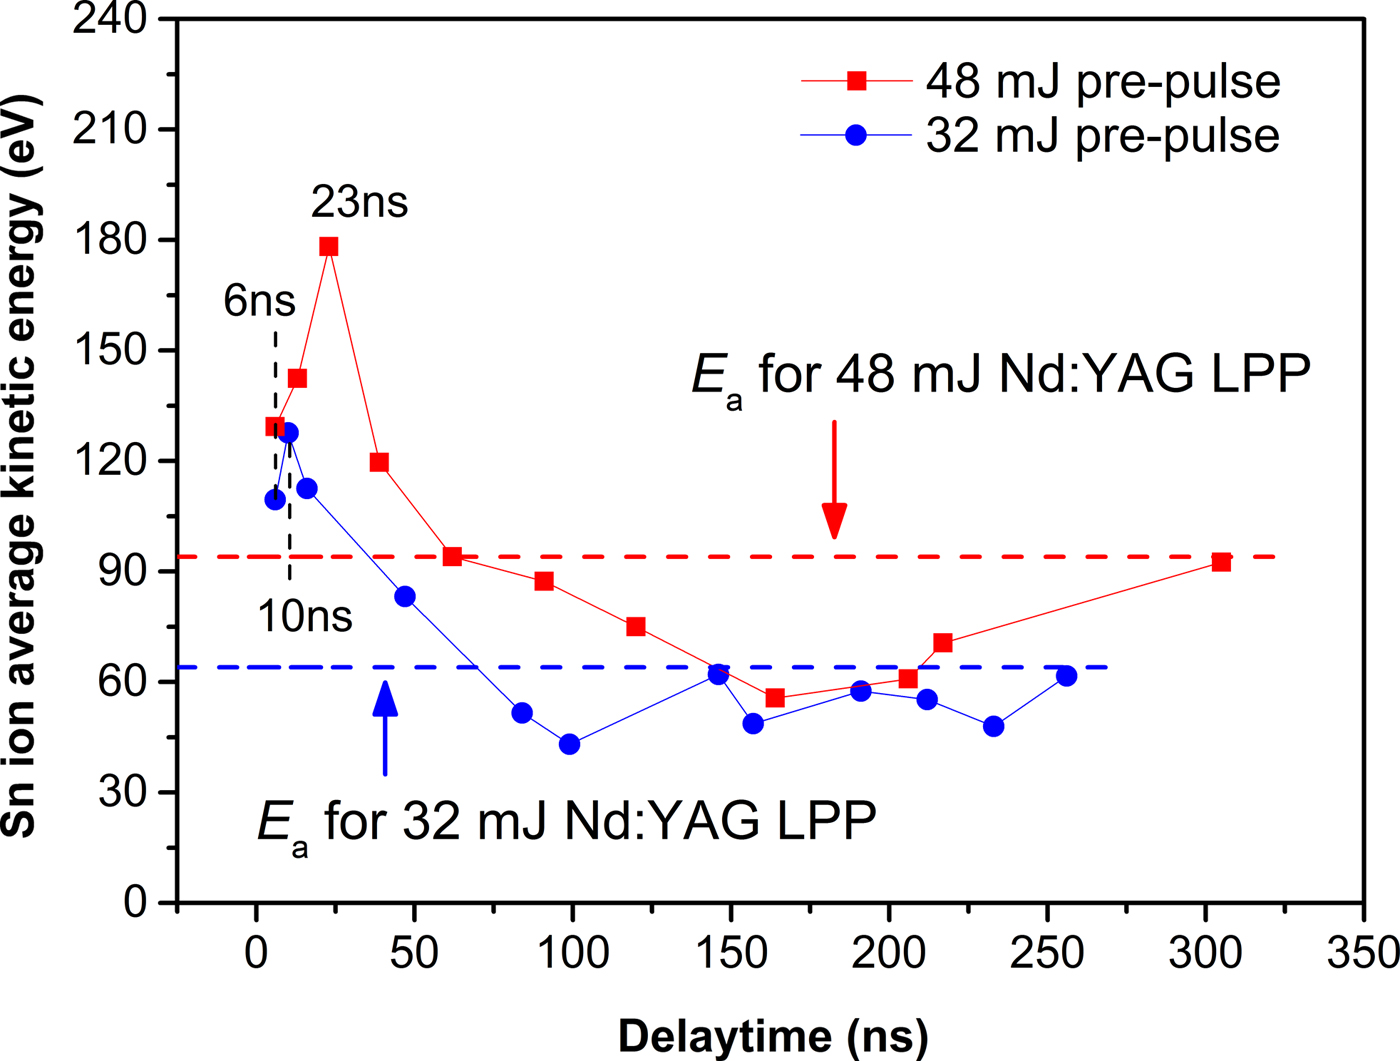
Fig. 5. The variation of E a versus delay times at the θ of 45° in CO2 laser-produced Sn plasma with two pre-pulse energies.
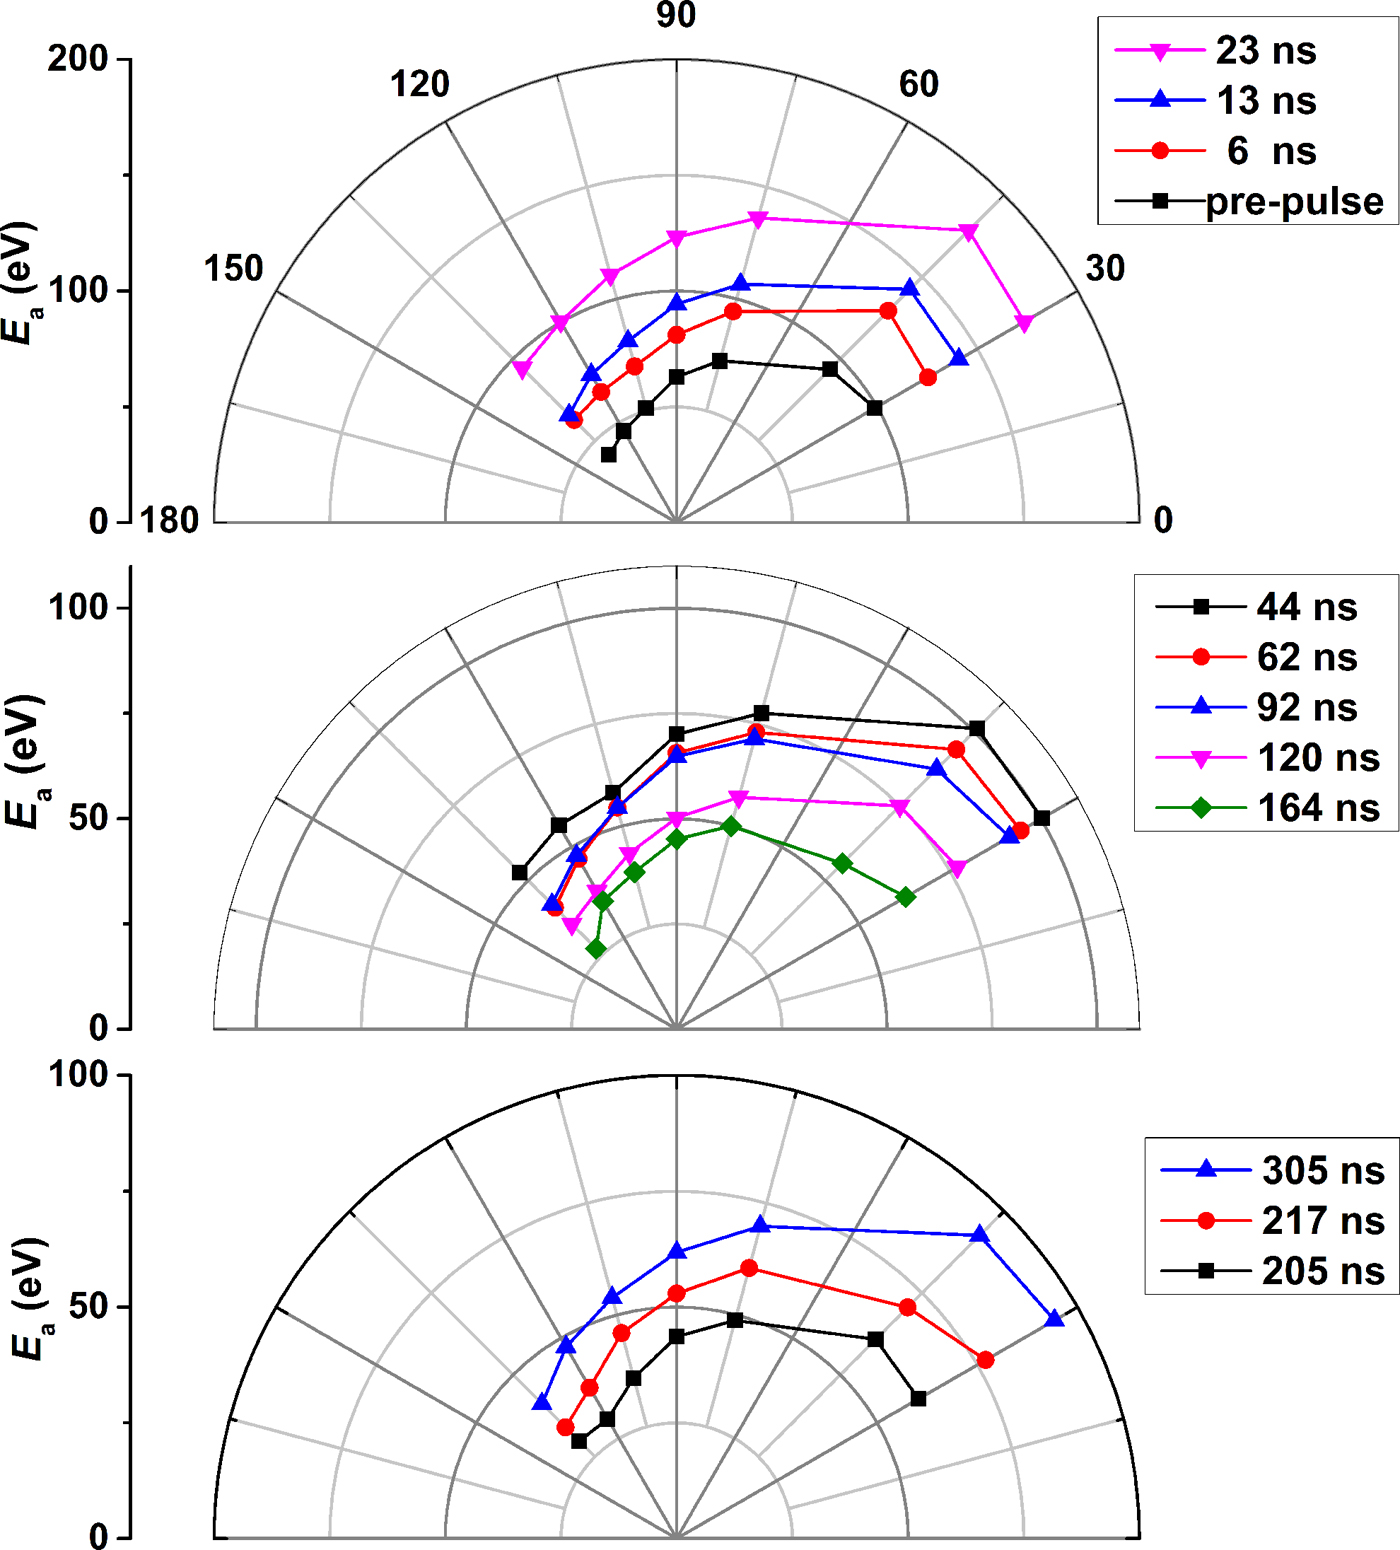
Fig. 6. The angle dependence of the E a versus delay times under 48 mJ pre-pulse.
Here, the results and the variation mechanism of ion average kinetic energy are interpreted and discussed in terms of the interaction between the laser pulse and the expanding plasma in vacuum. In range of 1010 ≤ I LλL 2 ≤ 1019, where I L (W/cm2) is the laser intensity and λL (μm) is the laser wavelength, the dominant mechanism of ion acceleration is due to the electrostatic field created by fast electrons leaving the plasma (Murakami et al., Reference Murakami, Kang, Nishihara, Fujioka and Nishimura2005). The strength of the accelerated electric field is related to the Debye length where quasi-neutrality breaks down in plasma. Under the quasi-neutrality conditions, the plasma has an initial density scale length l ss which is greater than or equal to the local Debye length. The plasma can be regarded as a composition of the positive and negative layers separated by a neutral zone, such as the capacitor model (Eliezer et al., Reference Eliezer, Nissim, Martínez Val, Mima and Hora2014), which is generally called double layer (DL) (Bulgakova et al., Reference Bulgakova, Bulgakov and Bobrenok2000). Hence, the electric field associated with the l ss can be written as (Grismayer & Mora, Reference Grismayer and Mora2006)
 $$E = {{k_{\rm B}T_{\rm e}} / {el_{{\rm ss}}}},$$
where k B is the Boltzmann constant, T e is the initial electron temperature in plasma, and e is the elementary charge. This electric field plays a crucial role in the ion acceleration of the plasma and distinguishes between the pumping laser with and without pre-pulse. In nanoseconds LPP, the formation time of initial plasma is much shorter than the duration of the laser, and most of the laser energy are deposited onto the generated plasma. With the CO2 laser-irradiating tin-droplet, this cold target has a sharp density profile with l ss ≈ 0. When the tin-droplet target has been pre-irradiated by the pre-pulse laser, the preformed Sn plasma has a smooth density profile with the l ss ≫ 0. According to Eq. (1), the electric field for ion acceleration is significant reduced when the performed plasma instead of the tin-droplet target in LPP. And T. Grismayer and Mora (Reference Grismayer and Mora2006)'s simulation results demonstrate that the efficiency of the ion acceleration is reduced with larger l ss in the plasma. In addition, the laser intensity in the present experiment is at a moderate range that is I LλL 2 ≤ 1015. The electrons in the plasma present a single thermal population and the initial electron density in corona region of the plasma will approximately equal the critical density (Burdt et al., Reference Burdt, Tao, Tillack, Yuspeh, Shaikh, Flaxer and Najmabadi2010). The lower initial electron density for CO2 laser leads to relatively more energy depositing per electron and higher initial electron temperature. In contrast with Nd:YAG laser, CO2 laser is easily to produce stronger electric field for accelerating ions in LPP in accordance with Eq. (1). This can also explains the different E a between Nd:YAG LPP and CO2 LPP presented above.
It is interesting to compare the E a of CO2 combining pre-pulse laser-produced Sn plasma with that of pre-pulse laser-produced Sn plasma only. Due to the rise time of CO2 laser is approximately 35 ns, the tin-droplet target is actually irradiated by both of Nd:YAG pre-pulse laser and CO2 laser within a short delay time. The superposition of Nd:YAG laser and CO2 laser leads to higher ion charge stage and thus the larger ion acceleration in plasma. With increasing the delay time, the Nd:YAG pre-pulse laser will far away from the time domain of CO2 laser gradually. This leads to the decreasing of CO2 laser energy directly depositing into preformed Sn plasma. Furthermore, the electron temperature rapidly decreases during the adiabatic expansion of preformed plasma since the end of pre-pulse. From Eq. (1), the reduced T e and increased l ss for the preformed plasma resulting the reducing of E and thus the E a of CO2 laser-produced Sn plasma with pre-pulse.
There is a moderate delay time for reducing the E a of CO2 laser-produced Sn plasma with pre-pulse below that of pre-pulse laser-produced Sn plasma only, as shown in Figure 5. In fact, the preformed plasma cloud is expands with a high speed after the ending of the Nd:YAG pre-pulse laser-irradiating tin-droplet. And the density in preformed plasma core is greatly decreased at a longer delay time, such as 150 ns for 48 mJ pre-pulse. Then, the preformed plasma ion, where the pumping laser energy deposition, will be accelerated all directions due to the unrestrained electron flight. This is similar to the fast electrons could leave target surface or through the target when the pulse laser-irradiating thin-foil target (Eliezer et al., Reference Eliezer, Nissim, Martínez Val, Mima and Hora2014). And for a common plate target, the fast electrons only escape along the target normal due to the target constraint. When the CO2 laser irradiate the un-dense preformed plasma in the current experiment, the electrons that are moving inward will weaken the associated electric field and against the DL formation. It is the reason that the decreasing of E a of preformed plasma when it has been irradiated by pumping laser. At this moderate delay time, the CO2 laser energy deposits deeper into the preformed plasma compared with that with shorter delay time. Only the ions close to the preformed plasma core have been affected and decelerated by the pumping laser, which resulting in the double-peak structure of Sn ion signals shown in Figure 4.
With further increasing the delay time, the associated electric field decreases with the preformed plasma scale exceeding the region of CO2 laser gradually. In fact, the velocity of ions expanding is of order of 105 ~ 106 cm/s (Gambino et al., Reference Gambino, Brandstätter, Rollinger and Abhari2014), and the un-ablated target material are broken into the fragment and ejected at opposite direction of the laser incident direction (Mizoguchi et al., Reference Mizoguchi, Nakarai, Abe, Nowak, Kawasuji, Tanaka, Watanabe, Hori, Kodama, Shiraishi, Yanagida, Soumagne, Yamada, Yamazaki, Okazaki and Saitou2015). Therefore, the E a in CO2 laser-produced Sn plasma with the pre-pulse is firstly up and downward later, finally upward again with increasing the delay time. The maximum enhanced E a is about two times of the E a of pre-pulse laser-produce Sn plasma only, and the maximum reduced E a is of the order of one-third of the maximum E a. This amplitude of enhancement or reduction for the E a of CO2 combining pre-pulse laser-produced Sn plasma is the same for both with the 32 and 48 mJ pre-pulse.
According to the mechanism of E a variation with delay time shown in Figure 5, the interaction process between the CO2 laser and the preformed plasma could be considered as three different stages associated with delay time. These three different stages are shown in Figure 7, which (a) is the E a increasing stage, (b) is the E a decreasing stage, and (c) is the E a re-increasing stage. The delay time plays a crucial role in the variation of the E a. As a consequence, there exists an optimal delay time for reducing ion average kinetic energy of CO2 laser-produced Sn plasma with a Nd:YAG pre-pulse laser. With 48 mJ pre-pulse, the optimal delay time is of the order of 164 ns, which is longer than 100 ns for that with 32 mJ pre-pulse. This phenomenon can be explained by that larger pre-pulse energy is more easily to produce the dense plasma with longer duration.

Fig. 7. The different stages of ion kinetic energy changing in the interaction between CO2 laser and preformed plasma. (a) the E a increasing stage; (b) the E a decreasing stage; (c) the E a re-increasing stage.
In addition, many ion measurements performed under LPP conditions demonstrate that the ion signal can be fitted a shifted Maxwell–Boltzmann (SMB) distribution (Hess, Reference Hess and Hess1989; Kools et al., Reference Kools, Baller, De Zwart and Dieleman1992), which can be written as
 $$S(t) \sim {\rm C}t^{ - 3}\exp \left\{ { - {{m{\left( {\displaystyle{l \over t} - u} \right)}^2} / {2k_{\rm B}T_{{\rm eff}}}}} \right\},$$
where S(t) is the signal intensity at distance l from the target and at time t after the laser pulse arrived the target; C is a dimensional normalization factor, m is the ion mass. The u is the velocity of the plasma center of mass along the normal to the target surface. And T eff with unit of K is the kinetic temperature in a coordinate system flowing with velocity u based on local thermodynamic equilibrium (LTE) assumption. The velocity of moving plasma cloud can be deduced from ion signal fitting. And this SMB distribution has been well applied on the ion signal generated by single-pulse irradiating tin solid target (Harilal et al., Reference Harilal, O'Shay, Tao and Tillack2006). However, angular distributions have shown that ion distributions for different angles cannot be described by one pair of parameters. Kools et al. (Reference Kools, Baller, De Zwart and Dieleman1992) proposed the elliptic MB distribution by taking into consideration the angular dependence. The form of elliptic MB distribution in polar coordinates is written as
 $$\eqalign{S(t) & \sim {\rm C}t^{ - 3}\exp \left\{ { - {{m{\left( {\displaystyle{{l\sin {\rm \theta }} \over t}} \right)}^2} / {2k_{\rm B}T_{xy}}}} \right. \cr & \quad \left. { - {{m{\left( {\displaystyle{{l\cos {\rm \theta }} \over t} - u} \right)}^2} / {2k_{\rm B}T_z}}} \right\},} $$
where l is the distance from target to the detector and θ is the angle with respect to the incident laser direction. The T eff from Eq. (2) has been be decomposed into T xy and T z , which are called transversal and longitudinal temperatures (elliptical temperatures) in Eq. (3). And u in Eq. (3) is regarded as the plasma mass-center velocity along with laser beam incident beam. The Sn ion signals at various angles from 30° to 135° from the plasma generated by 48 mJ Nd:YAG laser have been fitted by Eq. (3) The fitting results are as follows: T xy = 69 × 104 K (59 eV) that is approximate to T z = 72 × 104 K (62 eV) and u = 6.0 km/s; the R 2 is 0.99. Then limiting T xy equals to T z , which taking T eff instead of T xy and T z , the re-fitting results are as follows: T eff = 66 × 104 K (57 eV) and u = 6.7 km/s; the R 2 is 0.99. The thermal motion of Sn plasma is well described by Eq. (3) with T eff ≈ T xy ≈ T z despite this elliptical temperatures missing clear physical meaning (Morozov, Reference Morozov2015). A similar process of the fitting based on Eq. (3) for Nd:YAG laser-irradiating tin-droplet target can be observed elsewhere (Chen et al., Reference Chen, Wang, Duan, Lan, Chen, Zuo and Lu2015).
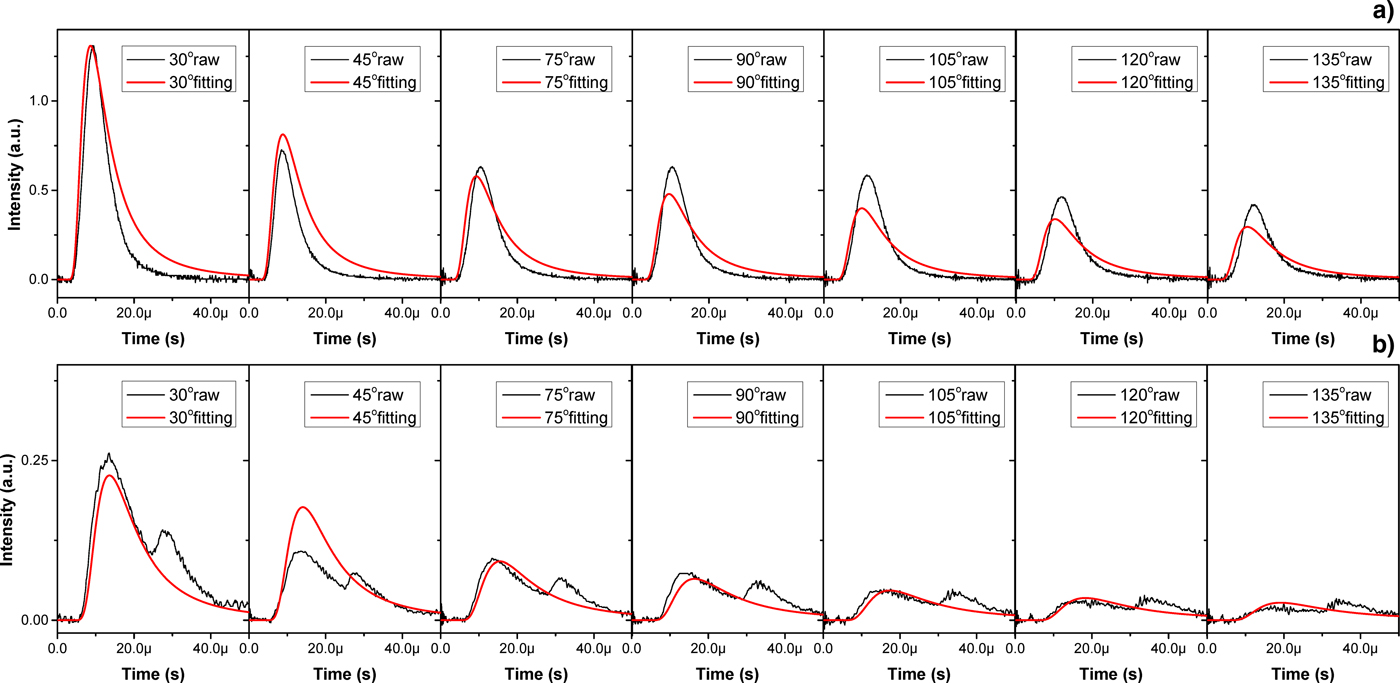
As to the plasma generated by CO2 laser irradiation with a 48 mJ Nd:YAG pre-pulse, the Sn ion signals at delay time of 23 and 164 ns have been fitted by Eq. (3) with limiting T xy = T z . The fitting results of delay time of 23 and 164 ns are shown in Figures 8a and 6b, respectively. The heavy lines are the fitting values and the thin solid lines are the raw signal values. As shown in Figure 8, the fitting values not well agree with the raw signal values, especially for the double-peaked signals. Although the ion signals at 23 ns delay time are single-peaked, the raw signal values seems to sharper than the corresponding fitting values. Equation (3) is a single-peaked mathematical expression and not quite suited to fit the Sn ion signals from CO2 laser irradiation with pre-pulse.

Fig. 8. The fitting curves by Eq. (3) with limiting T xy = T z . (a) for 23 ns delay time; (b) for 164 ns delay time. The heavy lines (red) are the fitting values and the thin solid lines (black) are the raw signals.
In fact, the Sn ion signal detected by FC is contributed by the various components with different charge stages. The kinetic energy distributions of the Sn ions for each charge state at both Nd:YAG and CO2 laser radiation are fitted by the functions of Gaussian form in Burdt et al. (Reference Burdt, Tao, Tillack, Yuspeh, Shaikh, Flaxer and Najmabadi2010) studies. In current experiment of dual-pulse laser irradiation, the associated Sn ion signal can be regarded as a superimposed ion signal that is contributed by Nd:YAG laser irradiation and CO2 laser irradiation. Since the preformed plasma interacted with CO2 laser, the energy equilibrium time in particles collision is much smaller than the ions fight time to the detector. What's more, a multi-peaked ion signal has been fitted by a multi-component MB distribution in Zhenhui et al. (Reference Zhenhui, Jianjiang, Haijun, Ziguo and Qizong1997)'s study of pulse laser ablation of tantalum oxide, which the detected multi-peaked ion signal is from the linear superposition of the ion signals with different ion species. Hence, assuming the preformed plasma irradiated by CO2 laser remains in LTE state, a superimposed MB distribution based on Eq. (3) can be proposed as:
 $$\eqalign{S(t) \sim \sum\limits_{i = 1}^n {S_i(t)} &= \sum\limits_{i = 1}^n {C_it^{ - 3}\exp \left\{ { - {{m{\left( {\displaystyle{{l\sin {\rm \theta }} \over t}} \right)}^2} / {2k_{\rm B}T_{i,xy}}}} \right.}\cr & \left. \qquad{ - {{m{\left( {\displaystyle{{l\cos {\rm \theta }} \over t} - u_i} \right)}^2} / {2k_{\rm B}T_{i,z}}}} \right\},} $$
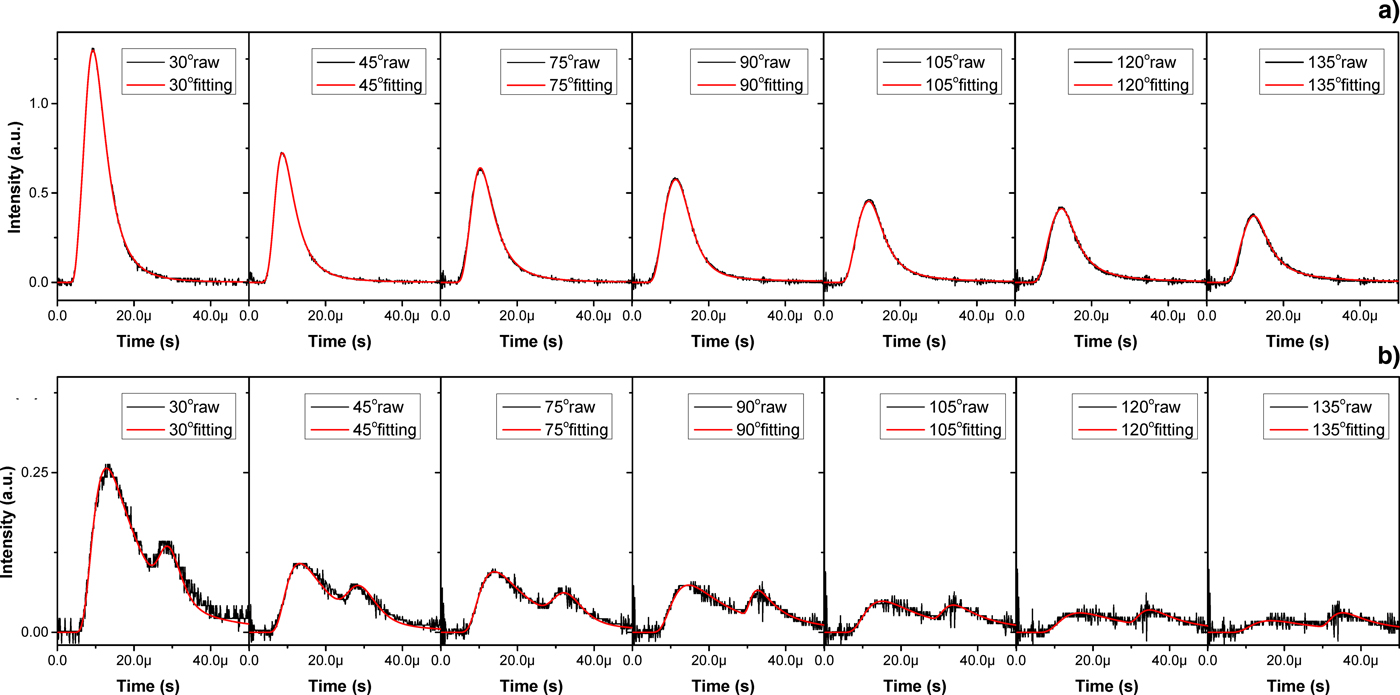
in which, n is the number of energy source which equals to 2 in current experiment. This superimposed form can be expanded to more energy sources in theory with n > 2. The raw signals at each θ in Figure 8 are taken to fit by Eq. (4) with limiting T i,xy = T i,z . And the subsequent fitting results of delay time of 23 and 164 ns are shown in Figure 9a, 9b, respectively. The heavy lines are the fitting values and thin solid lines are the raw signal values. In contrast with that shown in Figure 8, the Figure 9 illustrates that the Sn ion signals from the plasma generated by CO2 laser irradiation with Nd:YAG pre-pulse are quite fitted by Eq. (4) whether the ion signal is single-peaked or double-peaked. The R 2 is nearly to 0.99 for each raw signal fitting in Figure 9. Taking these parameters of different components corresponding to different pulse is meaningless for that the energy contribution to generate plasma cannot distinguish between Nd:YAG laser and CO2 laser. The temperatures and velocities are the macroscopic characteristics of the plasma thermal motion in this superimposed MB distribution. Thus, the temperature T and velocity u of CO2 laser-produced Sn plasma with a Nd:YAG laser can be written as
 $$T = \displaystyle{{C_i \,\ast\, T_i} \over {\sum\nolimits_{i = 1}^n {C_i}}}, \quad u = \displaystyle{{C_i \,\ast\, u_i} \over {\sum\nolimits_{i = 1}^n {C_i}}}. $$

Fig. 9. The fitting curves by Eq. (4) with limiting T xy = T z . (a) for 23 ns delay time; (b) for 164 ns delay time. The heavy lines (red) are the fitting values and the thin solid lines (black) are the raw signals.
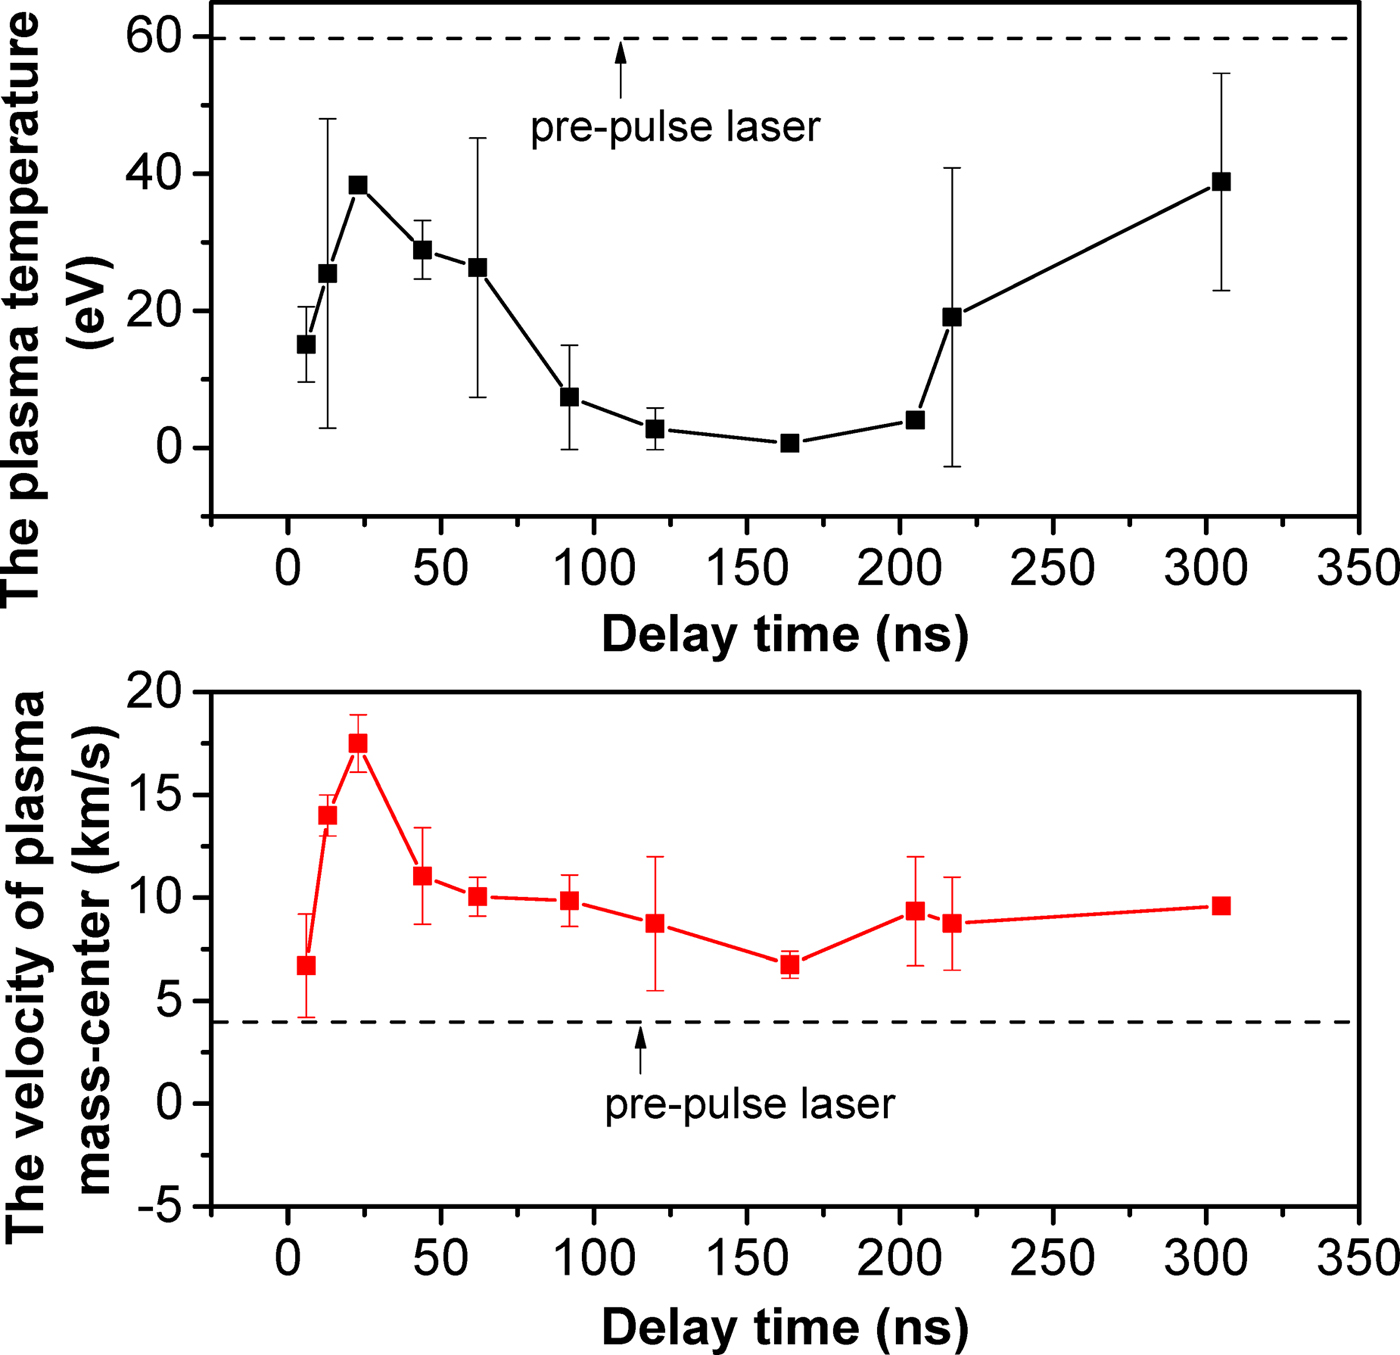
In addition, the Sn ion signals from CO2 laser irradiation with a 48 mJ pre-pulse are fitted by Eq. (4) with limiting T i,xy = T i,z for various corresponding delay times in Figure 5. The variation of plasma temperatures and mass-center velocities with various delay times are calculated by Eq. (5) and the result are shown in Figure 10. The larger errors of the calculated temperature is mainly due to the region of CO2 laser irradiation is not centered with the preformed plasma. This leads to the velocity of plasma cloud deviating from the laser incident direction, which conflict with the meaning of u in Eq. (4). With increasing the delay time, the plasma temperature for CO2 laser irradiation with the pre-pulse increases firstly, then decreases and finally recovers near to the plasma temperature for pre-pulse laser irradiation only. In CO2 laser-produced Sn plasma with the pre-pulse, plasma temperatures with various delay times present the same trend as the ion average kinetic energy, which has been shown in Figure 5. The variation of plasma mass-center velocities also agree with the plasma temperatures with various delay time. Compared with pre-pulse LPP only, the Sn plasma produced by CO2 laser with the pre-pulse presents lower plasma temperature and higher mass-center velocity. It is attributed to that the preformed plasma has a smooth density profile, which is underdense relative to the initial formed plasma for pre-pulse laser irradiation only. Then, the particle collisions moderate at this underdense preformed plasma, despite CO2 laser energy depositing into preformed plasma. By contrast, CO2 laser irradiation promotes the velocity increasing in the plasma generated by CO2 laser irradiation tin-droplet target with the pre-pulse. Consequently, the plasma temperatures obtained by Eq. (5) are reliable in current fitting. And the superimposed MB distribution model provides a new way to analyze the double-peaked ion signal from pumping LPP with a pre-pulse laser.

Fig. 10. The variation of plasma temperatures and mass-center velocities versus delay time in CO2 laser-irradiating tin-droplet plasma with a Nd:YAG pre-pulse laser.
4. CONCLUSIONS
The ions measurement of laser-produced tin-droplet plasma has been carried out by FCs. The Sn ion average kinetic energies in plasma generated by CO2 laser irradiation with a Nd:YAG pre-pulse were obtained. The results illustrate that more low-energy Sn ions are produced in case of the Nd:YAG laser irradiation with the laser intensity of 2.2 × 10¹¹ W/cm2. With lower laser intensity of 1.2 × 10¹⁰ W/cm2, the CO2 laser-irradiating tin-droplet produces more higher-energy Sn ions. With increasing the delay time, the ion average kinetic energy of CO2 laser-produced Sn plasma with the pre-pulse increases first and then decreases, finally presents a recovery. The ion acceleration distinguishes between the CO2 laser irradiations with and without pre-pulse and the related mechanisms of varying ion average kinetic energy has been analyzed. The preformed plasma has a smooth density profile and it leads to relatively low ion average kinetic energy. And the optimal delay time for lowest ion average kinetic energy in CO2 laser-produced Sn plasma with pre-pusle is about 164 ns for 48 mJ pre-pulse and 100 ns for 32 mJ pre-pulse. In addition, based on the assumption of LTE, a superimposed MB distribution is proposed to describe the thermal motion of CO2 laser-produced Sn plasma with a Nd:YAG pre-pulse laser. Compared with regular MB distribution, this superimposed MB distribution agree well with the Sn ion signals, especially with the double-peaked Sn ion signals from the CO2 laser irradiation with pre-pusle. And the temperatures and mass-center velocities are calculated with various delay times in the plasma generated by CO2 laser with 48 mJ pre-pulse. The results illustrate that the plasma temperature and mass-center velocity presents the same variation trend as the ion average kinetic energy of CO2 laser-produced Sn plasma with pre-pulse. Compared with that for pre-pulse laser irradiation only, CO2 laser-produced Sn plasma with the pre-pulse presents lower plasma temperature and higher mass-center velocity.
ACKNOWLEDGMENT
This work was supported by the National Natural Science Foundation of China under contract No. 11304235 and the Fundamental Research Funds for the Central Universities, HUST: 2016YXMS028.