Introduction
The optimal integration of intracavitory brachytherapy (ICBT) and external beam radiotherapy (EBRT) is the main defining factor in the treatment of carcinoma cervix. A small change in geometry of ICBT applicators may cause a considerable dose difference at various reference points due to large dose gradient near the region close to brachytherapy sources.Reference King, Bloomer and Kalnicki1, Reference Thomadsen, Shahabi and Stitt2 Therefore, calculation of precise dose delivered to surrounding normal tissues and clinical target is important for successful treatment. The variation in geometry of applicators in intrafraction of high-dose rate (HDR) brachytherapy leads to a difficulty of calculating the total dose to various reference points. To explore the possibility of finding a common platform that could be used for dose and volume specification for reporting intracavitary therapy in gynecological malignancies, the International Commission on Radiation Units and Measurements (ICRU) came up with its guidelines in ICRU report 38 report.3 This report requires a description of the reference volume than doses to point A.3, Reference Potish and Gerbi4 The reference volume has been specified at a 60 Gy absorbed dose level for classical low-dose rate (LDR) therapy. However in HDR brachytherapy, the concept of 60 Gy, brings an uncertainty in the choice of the reference dose volume for multiple intracavitory applications and has been documented by various researchers.Reference Bahena, Martinez and Yan5–Reference Kim, Meyer, Spencer, Meredith, Jennelle and Salter9 Therefore, it is more essential to know the variation in doses at various reference points due to geometrical variations of applicators during multiple fractions of HDR ICBT. This study is conducted to determine the variations in applicator geometries of various HDR ICBT fractions and the effect on the doses at various reference points. The magnitude of variation in the applicator geometry with respect to the patient's anatomy and its impact on radiation doses delivered at various reference points have also been evaluated.
Materials and methods
For this study, orthogonal films of 49 patients, treated from September 2006 to December 2007, were evaluated. The patients were divided into two groups. The Group I and Group II patients comprises 21 and 28 patients, respectively. The HDR ICBT dose fractionation scheme of Group I patients was 9·5 Gy × 2 Fx delivered at an interval of ten days and of Group II was 7·5 Gy × 3 Fx delivered at an interval of 1 week between each fraction. The total number of orthogonal films evaluated in Group I and Group II were 84 and 168, respectively.
Immobilisation of applicator, until completion of treatment, was ensured after insertion of applicators, and special care was taken during simulation and transfer of patient to treatment room to minimise the variation of applicator geometry. All HDR ICBT applications were not done by the same physician, hence the effect of intra-physician changes may influence the parameters studied in this work.
The patients were treated using microselectron HDR (Nucletron) remote after loading unit with a single Ir-192 stepping source. Rigid intrauterine tube and two teflon ovoids were used for treatment. The length of the intrauterine tube and size of the ovoids were chosen as per the anatomy of the patient. A small radio-opaque ring shape marker fixed on the cervical stopper was used for localisation of external os. During the applications, an indwelling Foley's catheter was inflated with 7·0 cc of radio-opaque contrast. Treatment planning and the dose distribution were evaluated using Nucletron Plato Treatment Planning System (TPS).
In this study, the applicators were fixed inside the uterus and vaginal cavity with vaginal pack socked in normal saline and contrast anteriorly as well as posteriorly. Fixation and immobilisation of the applicators were achieved by externally tying the applicators with bandage to the patient body.
Evaluation of the applicator geometry
After insertion of the applicator, orthogonal radiographs (shown in Figure 1) were taken on a conventional simulator housed in the department of radiotherapy. The variation in geometrical positions of the applicator in a given patient in terms of the mutual relationship of the various components of the applicator, and also the spatial relationship of the applicators with respect to the fixed pelvic bony landmarks were measured on anteroposterior (AP) and lateral (LAT) radiographs after applying necessary magnification corrections.

Figure 1 (a) Anteroposterior and (b) lateral radiographs of intracavitory application.
The variations in the placement of the applicators between fractions in anatomically matched and superimposed radiographs of the patients of Group I and Group II are seen in Figures 2 and 3, respectively. Figures 4 and 5 represent the line diagrams drawn from the anatomically superimposed radiographs of Figures 2 and 3, respectively.
Figure 2 Superimposed (a) anteroposterior and (b) lateral radiographs of intracavitory application of Group I.
Figure 3 Superimposed (a) anteroposterior and (b) lateral radiographs of intracavitory application of Group II.
Figure 4 Fusion line diagrams of (a) anteroposterior and (b) lateral radiographs of Group I of intracavitory applications.
Figure 5 Fusion line diagrams of (a) anteroposterior and (b) lateral radiographs of Group II of intracavitory applications.
Different parameters, such as, angles, distances and coordinates of the various points were recorded to evaluate the geometrical movement of the applicators in interfraction treatment, and X, Y, Z co-ordinates were measured in reference to bony origin O shown in Figure 6, and are defined as:
Figure 6 Details of all the points and angles shown in the traced (a) anteroposterior and (b) lateral radiographs.
• Alpha angle (α angle): The angle between the intrauterine tube and the vaginal axis at the external os marker in the Lateral radiograph.
• Beta angle (β angle): The angle between the axis of vagina and intrauterine tube measured at the external os marker from the AP radiographs. The angle was considered positive if it was towards left and negative if it was to the right of the vaginal axis.
• Intrauterine length (IUTL): The distance between the tips of the intrauterine applicator to the ring fixed at the external os.
• Distance a: The perpendicular distance between the middle of the right (radio-opaque screw fixed to the ovoid) ovoid and central line on intrauterine applicator in cranio-caudal direction in AP radiograph.
• Distance b: The perpendicular distance between the middle of the right (radio-opaque screw fixed to the ovoid) ovoid and central line on intrauterine applicator AP direction in LAT radiograph.
• Distance c: The perpendicular distance between the middle of the left (radio-opaque screw fixed to the ovoid) ovoid and central line on intrauterine applicator in cranio-caudal direction in AP radiograph.
• Distance d: The perpendicular distance between the middle of the left (radio-opaque screw fixed to the ovoid) ovoid and central line on intrauterine applicator AP direction in LAT radiograph.
• ROX, ROY, ROZ: The X, Y and Z co-ordinates of the right ovoid with respect to origin in AP and Lateral radiograph.
• LOX, LOY, LOZ: The X, Y and Z co-ordinates of the left ovoid with respect to origin in AP and Lateral radiograph.
• OSX, OSY, OSZ: The X, Y and Z co-ordinates of the external os with respect to bony pelvis origin in AP and Lateral radiograph.
• Right and left point A dose variations.
• Volume analysis.
In the AP radiograph, the origin was defined as the intersection of the line joining the S1–S2 vertebrae and the pubic symphysis with the line joining the highest points on the right and left acetabulae. In the LAT radiograph, the origin was considered as that point on the line joining the S1–S2 vertebrae with the pubic symphysis, where the mid-point of the line joining the highest points of the acetabulae intersected when extended perpendicular to table top (Figure 6). Thus, the X co-ordinates were measured in the AP radiograph as positive or negative deviations to the left or right, respectively from the origin (O). The Y co-ordinates were recorded as positive or negative displacements cranially or caudally from the origin in the AP radiograph. The Z co-ordinates were recorded as positive or negative displacements anterior or posterior from the origin in the LAT radiograph.
Measurement of reference volume as per ICRU 38
The ICRU report 38 indicates that the absorbed dose level of 60 Gy needs to be specified in terms of the height, width and thickness which should be corrected for different dose rates other than classical LDR and for the contributions from EBRT.3 However, in this study it has been to describe the dimensions of a 9·5 Gy envelope for each of the two HDR insertions in Group I, and 7·5 Gy envelope for each of the three HDR insertions in Group II, in terms of height (IRH), width (IRW) and thickness (IRT). To confirm the overlapping of dose envelop, the highest points on the right and left femur in AP and LAT radiograph were selected and the influence of the changing applicator geometry in the spatial dose distribution with respect to the patient's anatomy was evaluated.
Parameter analysis
Variation in the parameters in both the groups concerning the applicator geometry (α, β, IUTL, distances a, b, c, d, distance of right and left ovoids from origin) were evaluated. Total of 19 parameters for 49 patients and 126 insertions were measured. Radiographs and traced images of actual radiographs were used to study the above-mentioned parameters.
Combined display of reference dose envelopes for both the groups
Graphics display of the applicator movements and its influence on the reference dose envelope was performed by manually fusing the corresponding reference dose envelopes of two applications (AP and LAT projections) in Group I and reference dose envelopes of three applications (AP and LAT projections) in Group II using the anatomical origin (O) as common origin as shown in Figure 7 for Group I and in Figure 8 for Group II.
Figure 7 Illustration of fusion of the two insertions in a particular patient of Group I showing the relative position of the 9·5 Gy isodose distribution with respect to the bony land marks M1, M2 in (a) AP and (b) LAT computerised plans.
Figure 8 Illustration of fusion of the three insertions in a particular patient of Group II showing the relative position of the 7·5 Gy isodose distribution with respect to the bony land marks M1, M2 in (a) AP and (b) LAT computerised plans.
Results
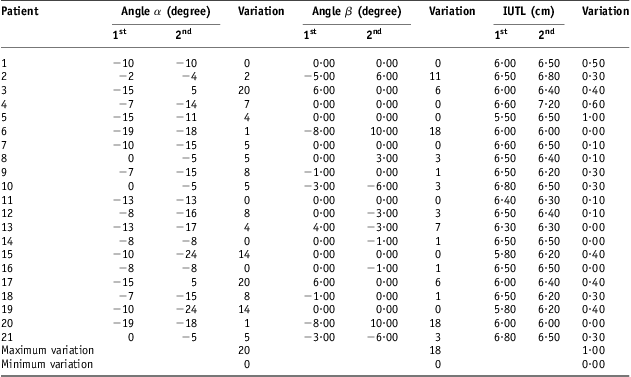
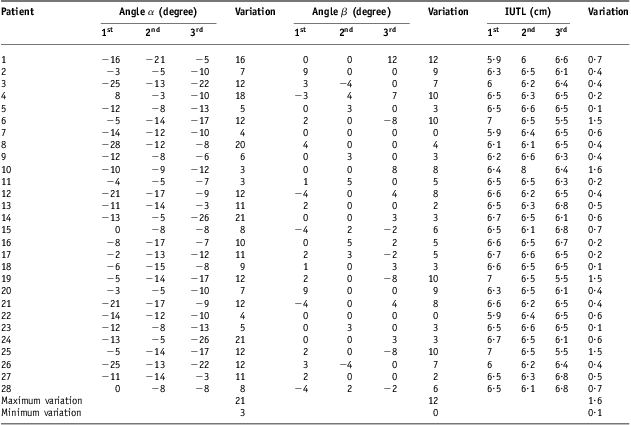
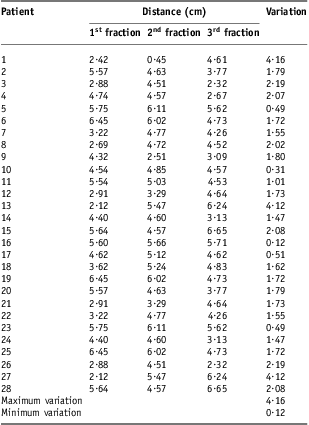
Tables 1 and 2 listed the details of variation in α, β and IUTL in Group I and Group II patients, respectively. The values of variations in α, β and IUTL ranges from 0° to 20°, 0° to 18° and 0·0 to 1·0 cm, respectively, in Group I, and from 3·0° to 21°, 0° to 12° and 0·1 to 1·6 cm, respectively, in Group II.
Table 1 Variations in α, β, and IUTL in Group I
Abbreviation: IUTL, intrauterine length.
Table 2 Variations in α, β, and IUTL in Group II
Abbreviation: IUTL, intrauterine length.
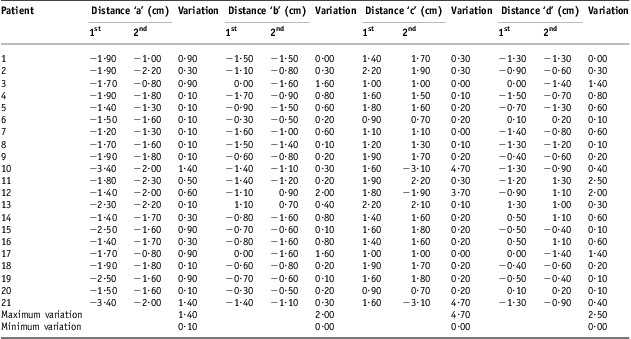
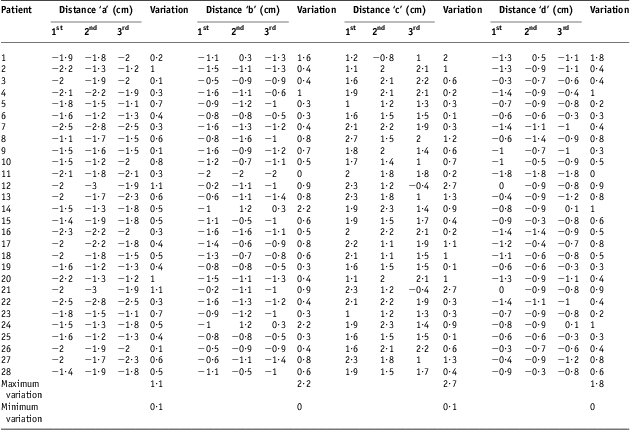
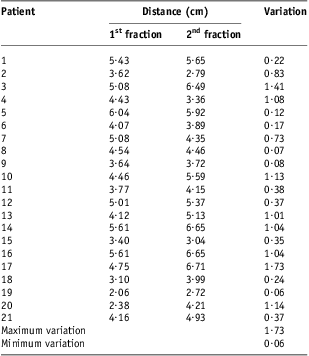
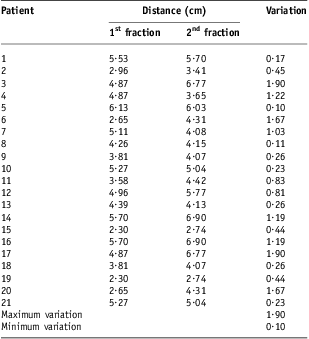
The variations in distances a, b, c and d in Group I and Group II patients are enlisted in Tables 3 and 4, respectively. The measured variations in the distances a, b, c and d were found to be ranged from 0·0 to 1·4 cm, 0·0 to 2·0 cm, 0·0 to 4·7 cm and 0·0 to 2·5 cm, respectively, in Group I, and from 0·1 to 1·1 cm, 0·0 to 2·2 cm, 0·0 to 2·7 cm and 0·0–1·8 cm, respectively, in Group II.
Table 3 Variations in distances ‘a’, ‘b’, ‘c’ and ‘d’ in Group I
Table 4 Variations in distances ‘a’, ‘b’, ‘c’ and ‘d’ in Group II
Graphical representation of variations in above parameters in Group I and Group II are shown in Figures 9–15. It was observed that variations were more in almost all parameters, except α, β, a and b, in Group II as compared with that in Group I.
Figure 9 Variation in angle α in Group I and Group II.
Figure 10 Variation in angle β in Group I and Group II.
Figure 11 Variation in IUTL in Group I and Group II. Abbreviation: IUTL, intrauterine length.
Figure 12 Variation in distance ‘a’ in Group I and Group II.
Figure 13 Variation in distance ‘b’ in Group I and Group II.
Figure 14 Variation in distance ‘c’ in Group I.
Figure 15 Variation in distance ‘d’ in Group I and Group II.
The variations in the distance of right ovoid from origin, in Group I and Group II are seen in Tables 5 and 6, respectively and varied from 0·07 to 1·6 cm in Group I and from 0·37 to 2·8 cm Group II. The variation in the distance of left ovoid from origin ranged from 0·10 to 1·90 cm, in Group I and from 0·20 to 4·12 cm, in Group II are seen in Tables 7 and 8, respectively.
Table 5 Variation in distance of RT ovoid form origin in Group I
Abbreviation: RT, right.
Table 6 Variation in distance of RT ovoid form origin in Group II

Abbreviation: RT, right.
Table 7 Variation in distance of LT ovoid from origin in Group I
Abbreviation: LT, left.
Table 8 Variation in distance of LT ovoid form origin in Group II

Abbreviation: LT, left.
Variations measured in the distance of external os from origin varied from 0·14 to 3·05 cm in Group I (Table 9), and from 0·12 to 4·16 cm in Group II (Table 10).
Table 9 Variation in distance of external orifice of the uterus (external os) from origin in Group I

Table 10 Variation in distance of external orifice of the uterus (external os) form origin in Group II
Graphical representation of variations in above parameters in Group I and Group II are shown in Figures 16–18. It was observed that variation was more in Group II as compared with Group I in all the parameters. Variations in doses at point A in both the groups are given in Table 11, and a close look revealed that an average dose variation in Group I was 0·0002 Gy which is negligible and mean dose delivered was 19 Gy ± 0·0002 Gy. Similarly in Group II, an average dose variation was 0·38 Gy and mean dose delivered was 22·498 Gy ± 0·38 Gy. The variation in dose delivered at point A was more in Group II as compared with Group I.
Figure 16 Comparison of variation in distance of right ovoid from origin Group I and Group II.
Figure 17 Comparison of variation in distance of left ovoid from origin Group I and II.
Figure 18 Comparison of variation in distance of external os from origin Group I and II.
Table 11 Variation of point A doses in both the groups

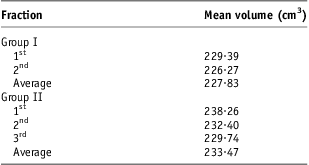
Table 12 gives the details of mean volume irradiated in Group I and Group II. The mean volume irradiated in Group I was 227·83 cm3 (229·38 cm3 and 226·27 cm3 in first and second fractions, respectively) and in Group II 233·47 cm3 (238·26 cm3, 232·4 cm3 and 229·74 cm3 in first, second and third, respectively). Here also the volume treated was more in Group II.
Table 12 The mean volume irradiated in both the groups
Discussion
Traditionally ICBT was delivered with single fraction by LDR in most of the cases and in situations where multiple insertions were planned with LDR systems, variation in the applicator geometry has also been documented.Reference King, Bloomer and Kalnicki1, Reference Datta, Kumar, Das, Pandey, Halder and Ayyagari6, Reference Kim, Meyer, Spencer, Meredith, Jennelle and Salter9–Reference Jones, Notley and Hunter11 In present era LDR systems have almost been replaced by HDR systems and treatment is delivered by multiple fractions.
The measured variations in placement of ovoids (Figures 16 and 17), was less in Group I (RT 1·73 cm and LT ovoid 1·90 cm) as compared with Group II (RT 2·80 cm and LT ovoid 4·12 cm). The variation was more in Group II because of more number of fractions (three fractions). This results are in agreement the results obtained by other others.Reference Datta, Kumar, Das, Pandey, Halder and Ayyagari6, Reference Kim, Meyer and Plott8 Datta et al.Reference Datta, Kumar, Das, Pandey, Halder and Ayyagari6 have used flexible applicators, where as applicators used in our study were rigid, therefore, they could not adjust according to the anatomy of the patient-like flexible applicator do, rather rigid applicators try to keep anatomical organs according to the design of the applicators. Therefore, variation with these flexible applicator is more that may be comparatively lesser in rigid applicators which we have used in our study. The regression of disease between multiple insertions of HDR brachytherapy could change the geometry of applicators and variation due to regression of disease would be more in flexible applicators than rigid applicators.
In this present study prescribed doses in both the groups were chosen to study the reference dose envelope covering the treated volume of 9·5 Gy and 7·5 Gy for each application. The height, width, thickness of the treated volume with reference dose were found to according to the applicator movements (Figures 7 and 8). Significant geometric variations were observed in all the applications in both the groups. These position differences were more than 1 cm in 60% of the applications as noted previously in either LDR or HDR brachytherapy.Reference Bahena, Martinez and Yan5–Reference Kim, Meyer and Plott8, Reference Corn, Galvin, Soffen, Henze and Schwaibold10, Reference Hellebust, Dale, Skjonsberg and Olsen12–Reference Elhanafy, Das and Paliwal14 Garipagaoglu et al.Reference Garipagaoglu, Tuncel and Dalmaz15 have found average magnitude of displacement of applicators between 2·0 mm and 16·9 mm.
Some authors claim that insufficient fixation of applicators both to each other and to the table is a main potential reason for geometric variation.Reference Bahena, Martinez and Yan5, Reference Datta, Kumar, Das, Pandey, Halder and Ayyagari6, Reference Kim, Meyer, Spencer, Meredith, Jennelle and Salter9, Reference Hellebust, Dale, Skjonsberg and Olsen12 In our study, we did not fix the applicators to the table and applicators were immobilised by tying them properly with patient.
Researchers have shown that another reason for displacement was anaesthesia given among the fractions.Reference Bahena, Martinez and Yan5, Reference Hellebust, Dale, Skjonsberg and Olsen12 However in the present study, the same kind of anaesthesia was used in all fractions of each patient.
Conclusion
It was observed that there were considerable variations in the geometry of applicators with respect to external os and fixed anatomical point during multiple fractions of HDR brachytherapy in carcinoma cervix. The current analysis demonstrates significant applicator motion upon repeated fractions in HDR fractionated intracavitary applications. Moreover, anatomical changes in the upper vagina alter the vaginal packing, which in turn perturb dose to the prescription points. This variation depends upon the type of applicators, packing, regression in bulk of tumor, skill of the radiation oncologist, technique of insertion, fixation of applicator, etc. The effect of these unavoidable variations could be minimised by the proper treatment planning, dose calculation and optimisation according to normal tissue doses for each fraction of HDR brachytherapy.
Based upon these observations, it is warranted that optimised treatment planning be performed for every fraction. Moreover, the same reason that attributes to the change in the standard prescription points from repeated fractions gives rise to a major change in the treatment volume. For advanced cases of carcinoma cervix, there is a greater probability that there will be some anatomical change in the upper vagina, giving rise to a significant change in the treatment volume mainly due to the debulking of the tumor. It was observed that geometrical variations were comparatively lesser in Group I where only two insertions are given and it gets multiplied in Group II, where there were three insertions. It was also observed that clinical outcome were similar in both the groups. Therefore, we can limit the number of fractions in HDR intracavitary to two, but it must be supported by large number of clinical data.