


The Caspian Sea, as the largest closed water body in the world with unique characteristics, has an important role for the surrounding countries (Dumont Reference Dumont1998; Karpinsky et al. Reference Karpinsky, Shiganova, Katunin, Kostianoy and Kosarev2005; Zonn Reference Zonn, Kostianoy and Kosarev2005). Owing to the isolation of the sea from the oceans, its circulation pattern and thermohaline structure proceed under the effect of atmospheric systems over the sea and river flow area (Tuzhilkin & Kosarev Reference Tuzhilkin, Kosarev, Kostianoy and Kosarev2005). The heat flues and freshwater inflow control the physical structure of water column and thermohaline regime variability (Kosarev Reference Kosarev, Kostianoy and Kosarev2005; Tuzhilkin & Kosarev Reference Tuzhilkin, Kosarev, Kostianoy and Kosarev2005). In addition, fluxes of momentum and relative vorticity caused by the wind over the basin of the sea generate three-dimensional motion and influence distributions of heat and salinity (freshwater) in the water column.
Certainly, one of the most important available tools to better study and understand the general circulation and current pattern in the sea is in situ current measurements. The results of the instrumental study can be used for the ecological and hydrodynamical models, coastal protection plans as well as biological and related environmental studies. The plan of this research is experimental investigation on hydrodynamical characteristics such as current velocity and direction, and thermal stratification variability over the southern continental shelf of the Caspian Sea.
Over the last decades, some studies have been conducted on the circulation and currents in the southern basin of the Caspian Sea using collected data and numerical models. Nevertheless, it seems that there is not enough data to analyse sea current pattern and dynamical studies (Mofidi & Rashidi Reference Mofidi and Rashidi2018). The instrumental measurements of the Caspian Sea currents have mostly been performed over the shelf. General knowledge of circulation is obtained by running the numerical hydrodynamic models using temperature and salinity data (Terziev et al. Reference Terziev, Kosarev and Aliev1992; Tuzhilkin & Kosarev Reference Tuzhilkin, Kosarev, Kostianoy and Kosarev2005). The general pattern of the Caspian Sea circulation indicated a dipole system consisting of a cyclonic gyre in the southern Caspian; the cyclone is located in the southeastern part, while the anticyclone is positioned in the northwest of the basin (Kosarev Reference Kosarev, Kostianoy and Kosarev2005; Tuzhilkin & Kosarev Reference Tuzhilkin, Kosarev, Kostianoy and Kosarev2005). The sea currents in the southern part of the Caspian are mostly wind induced and density driven, bearing in mind that near the coast freshwater discharge of rivers is important factor (Tuzhilkin & Kosarev Reference Tuzhilkin, Kosarev, Kostianoy and Kosarev2005).
The flow of seawater in the Caspian Sea can be due to the discharge of the river freshwater, wind and density gradient. River inflow mainly results as surface current, while wind driven currents have been observed from surface to depth of 10 m. The flow in the underlying and deep layers is mainly due to density differences. The flow rate generated by the wind is a few centimetres to 50 cm s−1 and velocity of the flows generated by the river water discharge is less than 10 cm s−1. Deep currents generated by the density difference have recorded very low velocities (Terziev et al. Reference Terziev, Kosarev and Aliev1992).
One of the newest environmental problems in coastal communities is the distribution of marine litter and thus spread of pollution in swimming areas, along the coastline and seawater adjacent to the coast. Marine litter or marine debris is described by United Nations Environment Program as discarded or waste persistent material in the coastal and marine areas (Shabani et al. Reference Shabani, Nasrolahi and Thiel2019). Marine debris is any waste material produced or processed that enters from any source to coastal zones or marine environments (Coe et al. Reference Coe, Andersson, Rogers, Coe and Rogers1997, Reference Cole, Lindeque, Halsband and Galloway2011; Barnes et al. Reference Barnes, Galgani, Thompson and Barlaz2009; Galgani et al. Reference Galgani, Hanke, Maes, Bergmann, Gutow and Klages2015; Ryan Reference Ryan, Bergmann, Gutow and Klages2015). The accumulation of debris, especially types of plastic in the world's oceans and seas, is a major concern now where amount of marine debris has been showing a steady increase over time (Barnes et al. Reference Barnes, Galgani, Thompson and Barlaz2009; Gregory Reference Gregory2009; Thompson et al. Reference Thompson, Moore, Vom Saal and Swan2009; Galgani et al. Reference Galgani, Hanke, Maes, Bergmann, Gutow and Klages2015; Ryan Reference Ryan, Bergmann, Gutow and Klages2015; Li et al. Reference Li, Tse and Fok2016; Haward Reference Haward2018). Marine debris has both marine and coastal sources. Sea-based waste is mainly the result of offshore activities such as shipping, sailing, fishing and aquaculture as well as in-sea industries (oil and gas, military). Land-based debris remains through tourism, industry, construction and agriculture activities. Land based litters are not mostly decomposed, and are transferred by sea current transfer to other areas. Ocean current patterns, tides and the proximity to urban, industrial and recreational areas, shipping lanes and fishing grounds affect the floating marine debris composition, distribution and density (Thiel et al. Reference Thiel, Hinojosa, Miranda, Pantoja, Rivadeneira and Vásquez2013; Galgani et al. Reference Galgani, Hanke, Maes, Bergmann, Gutow and Klages2015). Most studies have reported that a huge portion of marine debris has land-based sources (Gregory Reference Gregory2004; Hinojosa & Thiel Reference Hinojosa and Thiel2009). Recently, due to increasing growth of human societies on the coasts and developing human activities along the boundaries of the seas and oceans, the production and dispersal of anthropogenic litters on the marine and coastal environments has extensively increased. Distribution of the beach and marine litters can act as a huge threat for the health of the world's seas and ocean environment (Gregory Reference Gregory2004; Shabani et al. Reference Shabani, Nasrolahi and Thiel2019). All mentioned pollutants including beach and marine debris are considered an important threat for marine biodiversity processes and coastal environments (Sheavly & Regidte Reference Sheavly and Regidte2007; Gregory Reference Gregory2009; Leberton et al. Reference Leberton, Greer and Borrero2012; Carlson et al. Reference Carlson, Giuseppe, Stefano and Erick2017).
No study has been carried out on the effect of the southern Caspian Sea currents on floating marine debris. This study evaluates the impact of currents on distribution of the marine debris for the first time in the southern coastal waters of the Caspian Sea. The aims of the study are (1) analysing hydrodynamical parameters and physical structure of the water over the southern continental shelf and its effect on marine debris spreading, and (2) investigating the marine debris characteristics in the southern border of the sea.
1. Methods
1.1. Study area
The study covers the southern border of the Caspian Sea (Fig. 1). The width of the shelf in the middle part of the southern continental shelf (near Nowshahr port) is around 8 km. The depth of the shelf break is about 100 m after which the depth sharply increases to 180 m at about 12 km from the coastline.

Figure 1 The Caspian Sea and study area in the middle part of the southern continental shelf.
The coldest month above the southwestern and central areas of the sea is February. The annual mean air temperature above the south Caspian is 17°C. The largest range of monthly mean air temperature over the south Caspian shoreline is 22–24°C. This significantly depends on increase of southern continental temperature. Air humidity on the Iranian coastal area is more than 70% which sometimes reaches 85% (Kosarev & Kostianoy Reference Kosarev, Kostianoy, Kostianoy and Kosarev2005). The southern coast of the Caspian Sea has a subtropical climate characterised by warm humid summers and mild, wet winters (Rodionov Reference Rodionov and Singh1994; Kosarev Reference Kosarev, Kostianoy and Kosarev2005). Three factors including field of temperature created by the sea, relief of coasts and distinctive general circulation of atmosphere determine the direction and strength of wind blowing over the Caspian region. Generally, wind direction over the Caspian is dominated by wind from the north (northwest, north and northeast) heading southeast across most part of the year. The mean values of wind speeds reach 7–7.5 m s−1 during cold months (December–February) when the intensity of atmospheric circulation above the southern basin increases (Kosarev Reference Kosarev, Kostianoy and Kosarev2005; Kosarev & Kostianoy Reference Kosarev, Kostianoy, Kostianoy and Kosarev2005).
1.2. Fieldworks and data preparation
For measuring seawater properties, a portable Ocean Seven 316 CTD probe developed by Italian company of IDRONAUT was used. In order to measure the sea current parameters, an Acoustic Doppler Current Profiler was deployed on the shelf. A RD instrument ADCP current meter was installed using bottom mounted method over the continental shelf.
During the analyses, current and wind time series, current rose diagrams, wind rose diagrams, vertical structure of physical properties of seawater and normalised cross-correlation were applied using the collected data. For evaluating the collected time series data at different levels in this study, normalised cross-correlation function (N-CCF) was applied. N-CCF is a standard analysis technique for determining the relationship between two time series or variables (Wei Reference Wei2006). N-CCF is defined and calculated as follows (Emery & Thomson Reference Emery and Thomson2001):
 $${\rm N}-{\rm CCF} = \displaystyle{{C_{12}( \tau ) } \over {{[ C_{11}( 0) C_{22}( 0) ] }^{{\textstyle{1 \over 2}}}}}$$
and
 $$C_{12}( \tau ) = \int\limits_{-\infty }^{ + \infty } {x_1( t) x_2( t + \tau ) {\rm d}t} $$
where, x 1(t) and x 2(t) are two time series to compare.
For digital data, the CCF is applied as the following formula:
 $$C_{wz} = \sum\limits_{n = {-}\infty }^{ + \infty } {w( n) z( n + l) } $$
where, w(n) and z(n) are two discrete time signals.
In this research, the cross-correlation coefficient is calculated to evaluate the similarity between sea current component time series at different layers.
1.3. Coastal sampling
The first monitoring of coastal waste in the southern boundary was carried out on three selected sites in Mazandaran province. In addition, the data and samples of marine litter were collected from four transects 250 m away from each other. The length of transects was considered around 1 km from the coastline. In order to collect the marine debris samples in the coastal waters, a manta trawl was designed and used. The rectangular mouth of the trawl dimensions was 80 cm high and 100 cm wide. In addition, the net mesh size was selected about 3 mm with two wings for floating balance. The used manta trawl was fixed at the end of the vessel.
2. Results
2.1. Physical structure and stratification over the continental shelf and deep-water zone
Atmospheric changes and sea-air interactions are the most important factors causing various seawater situations. Water salinity in the southern coastal waters mostly varies between 12 and 13 psu. Observations and measurements in the southern coast of the sea clearly indicated that seawater salinity changes have not been wide-ranging. Across the surface mixing layer and thermocline, the changes of seawater salinity are mainly affected not only by rivers' inflow of freshwater but also by the amounts of rainfall. Values of salinity ranged between 11 and 12.5 psu across 50 m upper layer. Spatial variability in the basin scale indicated an increase of about 1 psu in salinity and reached 13.5 psu.
The results of analysed data indicated a seasonal stratification (thermal and density) in the southern coastal and deep waters of the Caspian Sea. The formation of seawater column stratification begins in early spring and reaches its most stable state in the mid-summer. The results showed that the stratification of seawater in winter has disappeared. Seawater layering from surface to depth includes surface mixing layer, thermocline and deep water.
The width of the continental shelf in the middle and western parts of the southern shore of the Caspian Sea is narrow. The water column on the continental shelf mostly covers surface mixed and thermocline (pycnocline) layers (Fig. 2). Owing to the low salinity of the Caspian Sea water and its lower effect on changes in water density compared with temperature, vertical variations of density are in agreement of seawater temperature (Fig. 3). It means that the pycnocline layer is formed at the position of thermocline layer. Lower density values (1006–1011 kg m−3) are very important in terms of the dynamics of different layers of water mass, kinetic energy and water turbulence.
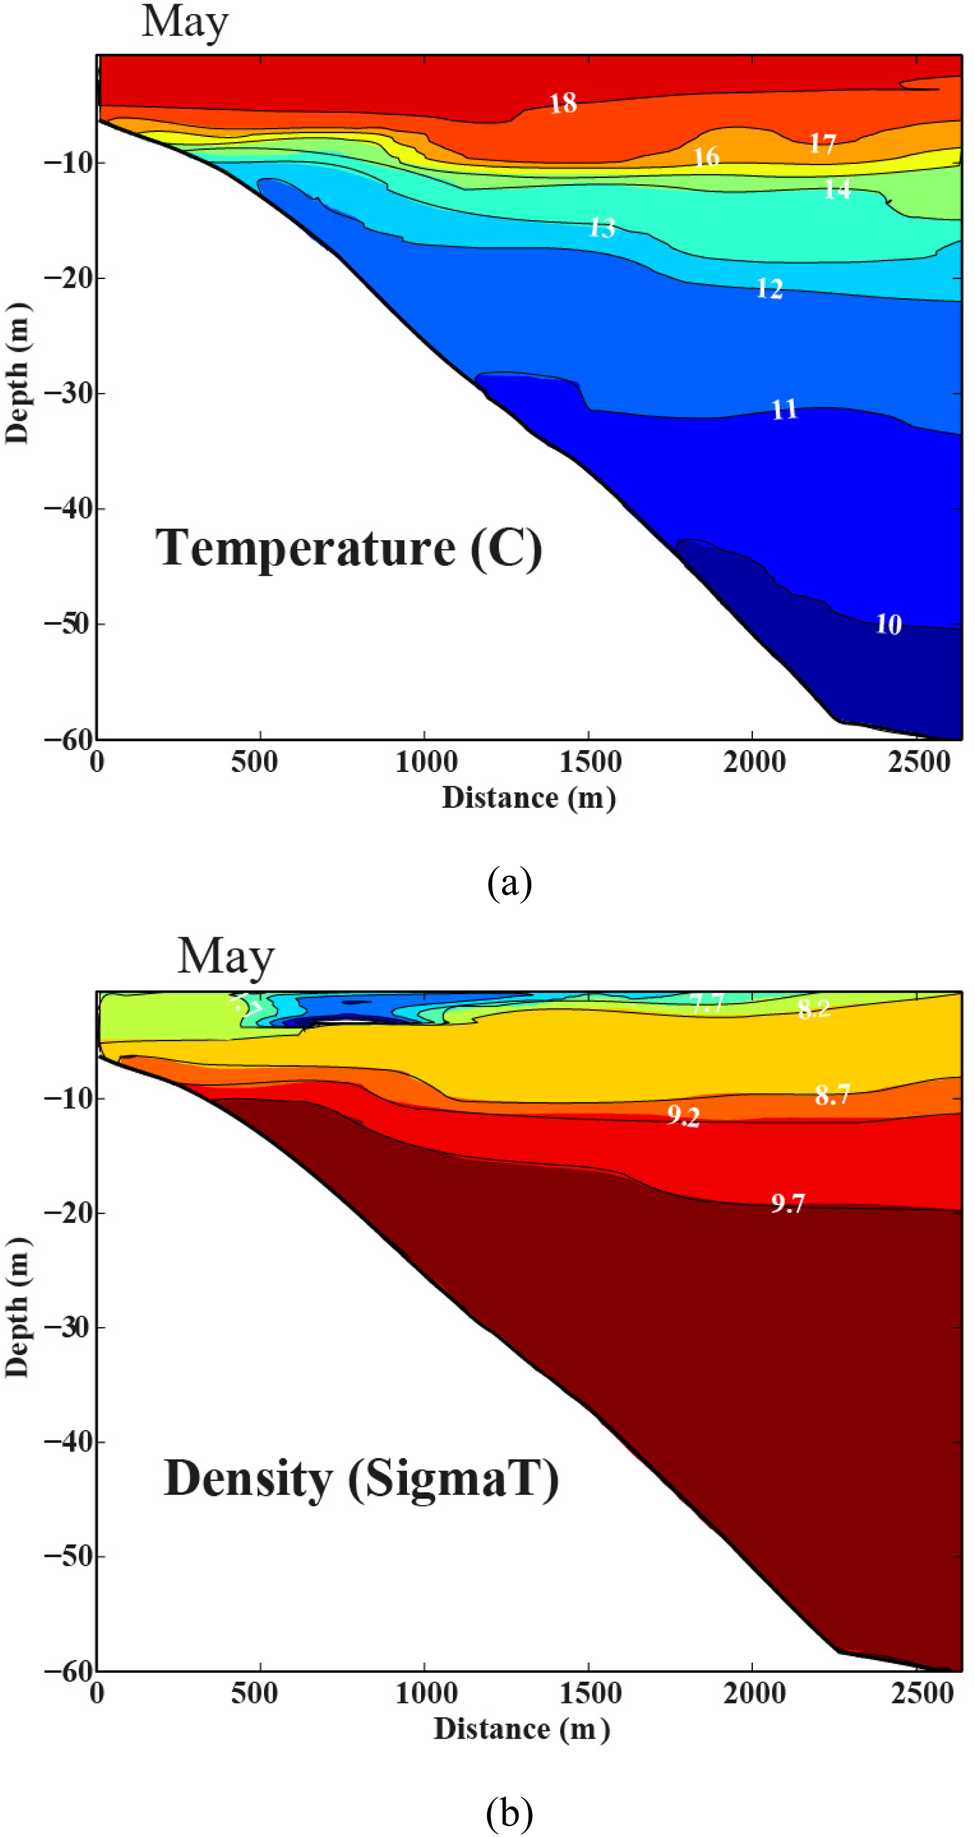
Figure 2 Cross-sections of water temperature and density over the continental shelf.
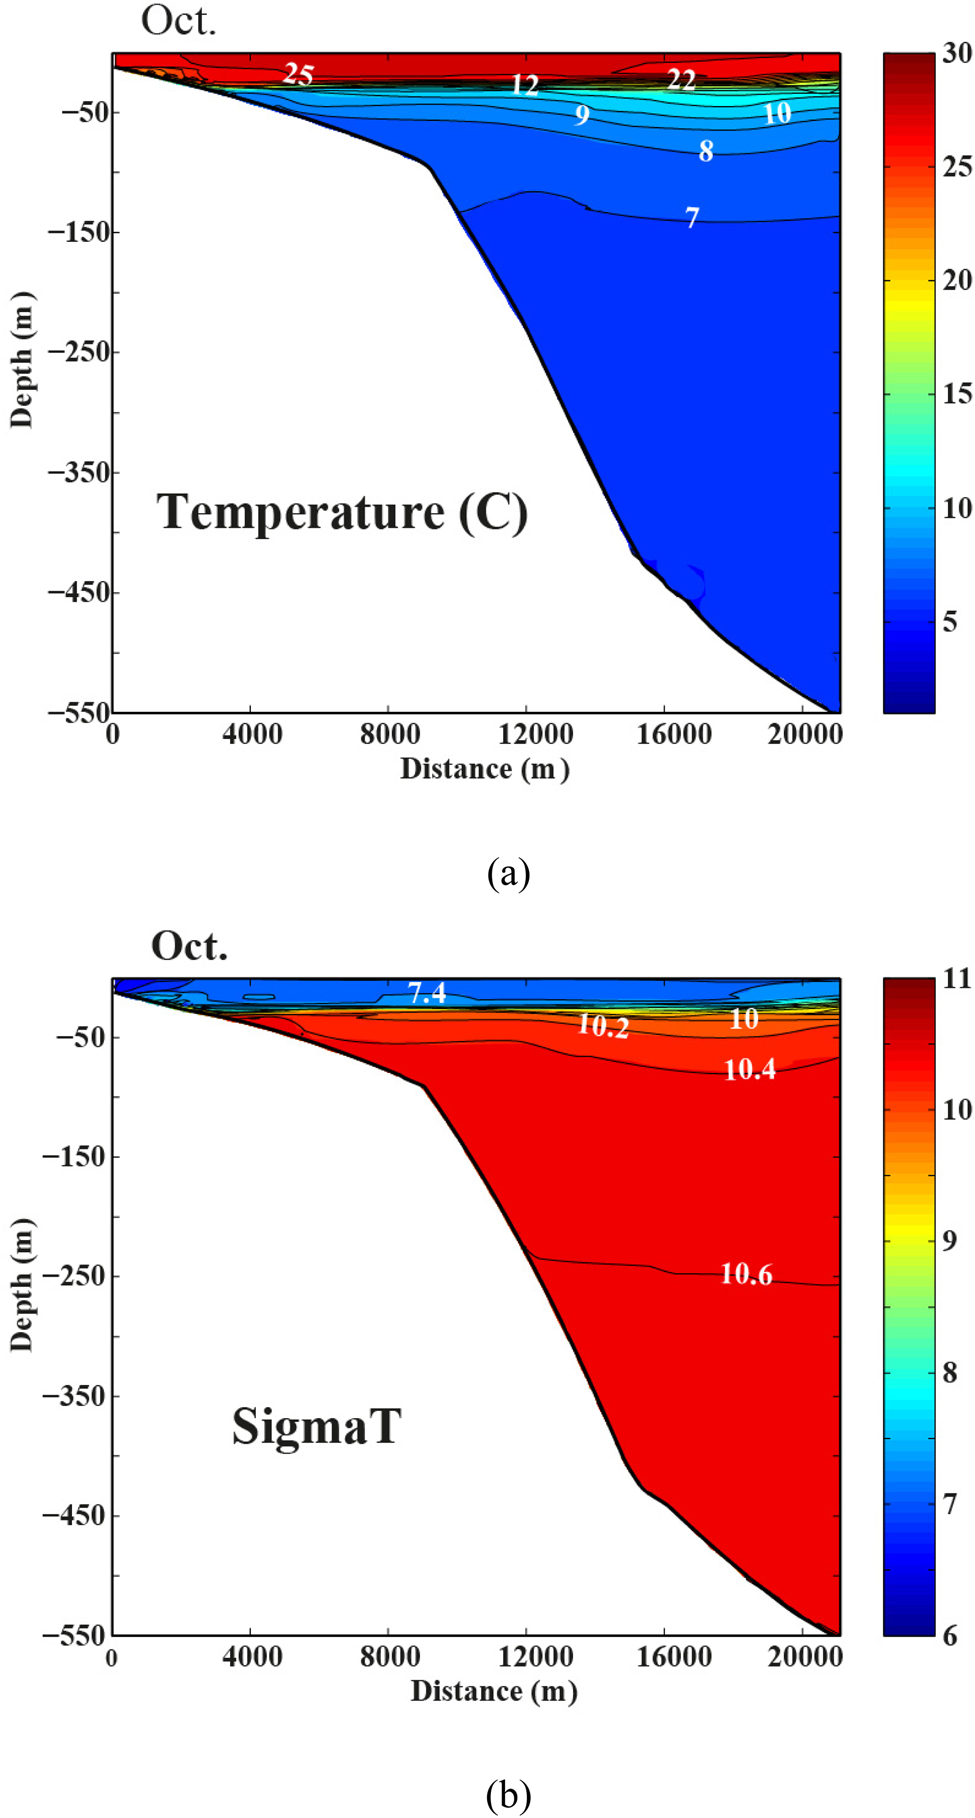
Figure 3 Cross-sections of water temperature and density in deep water zone.
According to the observations, it seems that the greatest changes in sea water density occur across the upper 100 m. This is affected by seasonal changes in temperature and atmospheric interference. Current, stratification, internal waves, and water circulation (under effect of density) are influential in determining the physical structure of the water column. Seasonal changes in sea water temperature and density usually indicate the similarity of thermal and density structures at different times.
2.2. Current variability over the continental shelf
The current pattern was studied by instrumental measurements on the southern continental shelf of the sea. The monthly average velocities of current, presented in Figure 4, indicated a progressive decrease from October (75.5 cm s−1 in the subsurface layer) to December and January (70.1 and 52.6 cm s−1 of minimum measured in the surface layer, respectively). In addition, a progressive descending trend in velocities of current was visible from the surface level to the near bottom layer (20 m depth) in the water column (Fig. 4). Below the −20 m level, the monthly average velocity of current was attenuated and its maximum value reached just below 20 cm s−1. The maximum monthly average speed of 22.8 cm s−1 was recorded in October at 10 m depth. The general diminishing trend observed in surface flow velocities is also seen in the lower layers until the bottom. The minimum value of monthly mean current velocity recorded during the measurements is 7.45 cm s−1 at 20 m depth in January.

Figure 4 Monthly mean current velocities (cm s−1) measured at four depths (subsurface 5, 10, 15, 20 m).
Figures 5–10 reveal the time series of the along-shore and cross-shore components of current, and related spectral analysis result. Figure 5 indicates that the collected current data were dominated by short frequency fluctuating velocities. In particular, this condition was more observed in the cross-shore component. The summary of statistical information presented in Tables 1 and 2 showed that there was also a residual current flowing from west to east along the coastline. This phenomenon, residual eastward current was reported by Zaker et al. (Reference Zaker, Ghaffari, Jamshidi and Nouranian2011) in the eastern part of the southern continental shelf of the Caspian Sea. The mentioned eastward mean current changed in terms of magnitude during the various months of measurements. Its maximum values were greater than 0.3 m s−1, occurring in October, while its minimum of 0.06 m s−1 was observed in January. The mean along-shore current parameter in November and December was more than 0.23 m s−1 and 0.21 m s−1. The average along-shore wind component during the time of measurements was weak (approximately between 0.028 and 0.046 m s−1). This result clearly indicated that the currents of the southern border can be caused by another factor such as general circulation of the sea. In other words, wind stress force has been less effective in flow dynamics in the area. The vertical profile of measured current data in various layers between surface and bottom showed that along-shore currents were homogeneous and correlated over the continental shelf. Time series analysis showed that the along shore component of sea current was dominated by strong low frequency oscillations in the study area. Along-shore components of sea currents demonstrated monthly changes with lower magnitudes in December and January and had a maximum monthly speed of more than 1.2 m s−1 in October. The observed time series data showed that the marine currents of the region in surface layer were far stronger and more intense than lower layer flow. The main cause of the currents was wind and kinetic energy from the atmosphere dynamics. The results of analysis on collected data revealed that the values varied up to 100 cm s−1. The west-to-east current components (along-shore) near the surface layer recorded approximately changes up to about 1 m s−1. Changeability of the cross-shore component was observed more than the alongshore component in the time series. Based on the analysis on collected Idronaut Ocean Seven 316 CTD and current data on the continental shelf, there was no upwelling phenomenon (Ekman Suction) associated with local wind pattern over the region.

Figure 5 Comparison of along-shore and cross-shore components current and vector diagram of velocity.

Figure 6 Spectral analysis on along-shore and cross-shore current components.

Figure 7 spectral analysis on along-shore and cross-shore current components: (a) October, (b) November, (c) December, (d) January.

Figure 8 Current velocity distributions measured at subsurface, 10 m, 15 m and 20 depths.

Figure 9 Along-shore components distribution measured at subsurface, 10 m, 15 m and 20 depths.

Figure 10 Cross-shore components distribution measured at subsurface, 10 m, 15 m and 20 depths.
Table 1 Summary of statistical information on collected current data.

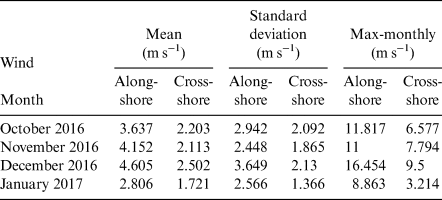
Table 2 Summary of statistical information on wind data collected in the coastal station in the study area.
Comparison between time series of along-shore currents and wind components over the study area indicated that the pattern of current and wind were not similar. Based on analysis of weather station data, time series of along-shore wind components were generally weak, while strong fluctuations were recorded for along-shore current components. In addition, wind and current were recorded in reverse directions. It showed that correlation between along-shore current and wind force was not strong. The poor correlation between them indicates that another important factor may have caused the sea current.
The results indicated that the cross-shore component of currents was generally smaller than the along-shore component (Fig. 5). The recorded maximum value for monthly cross-shore velocities was around 1.18 m s−1 in December. The vertical profile of recorded velocities in various layers between the surface and bottom demonstrated that cross-shore component was homogeneous and correlated in the coastal waters. The upwelling phenomenon (Ekman Suction) or strong currents in the vertical direction under the influence of local wind were not observed in the study area. During the time of measurements, the results showed mean cross-shore value of up to 0.29 m s−1. In total, along-shore and cross-shore components of sea current in the study area were considerable. Monthly west-to-east along-shore velocities of up to 0.3 m s−1 were observed, revealing the effect of a basin scale anticlockwise cyclone in the southern basin of the Caspian Sea. Tuzhilkin & Kosarev (Reference Tuzhilkin, Kosarev, Kostianoy and Kosarev2005) reported hypothesis of existence of coastal trapped waves in the southern Caspian Sea. Also, Zaker et al. (Reference Zaker, Ghaffari, Jamshidi and Nouranian2011), during an oceanography study, reported the west-to-east coastal trapped waved along the eastern part of the southern border of the Caspian Sea.
Monthly diagrams of current velocity and direction distribution measured at subsurface, 10, 15 and 20 m depth are presented in Figure 11. Evaluation and comparison of current rose diagrams (current direction) showed some difference along the flow direction moving from sea surface to deeper layer across various months. Indeed, in the subsurface layer, sea currents were mostly oriented towards north, northeast and north-northeast, while moving to the deeper layers in water column the dominant current direction was toward north and north-northwest. Analysing the recorded data at the various depths over the continental shelf revealed that the dominant direction at 10, 15 and 20 m depths was north-northwest. In October, November and December, similarity of the current direction at 10, 15 and 20 m depths was more obvious. The direction of sea flow in the subsurface layer was not completely uniform. Diagrams indicated variability of directions with a slight prevalence of north-northeast near the surface.
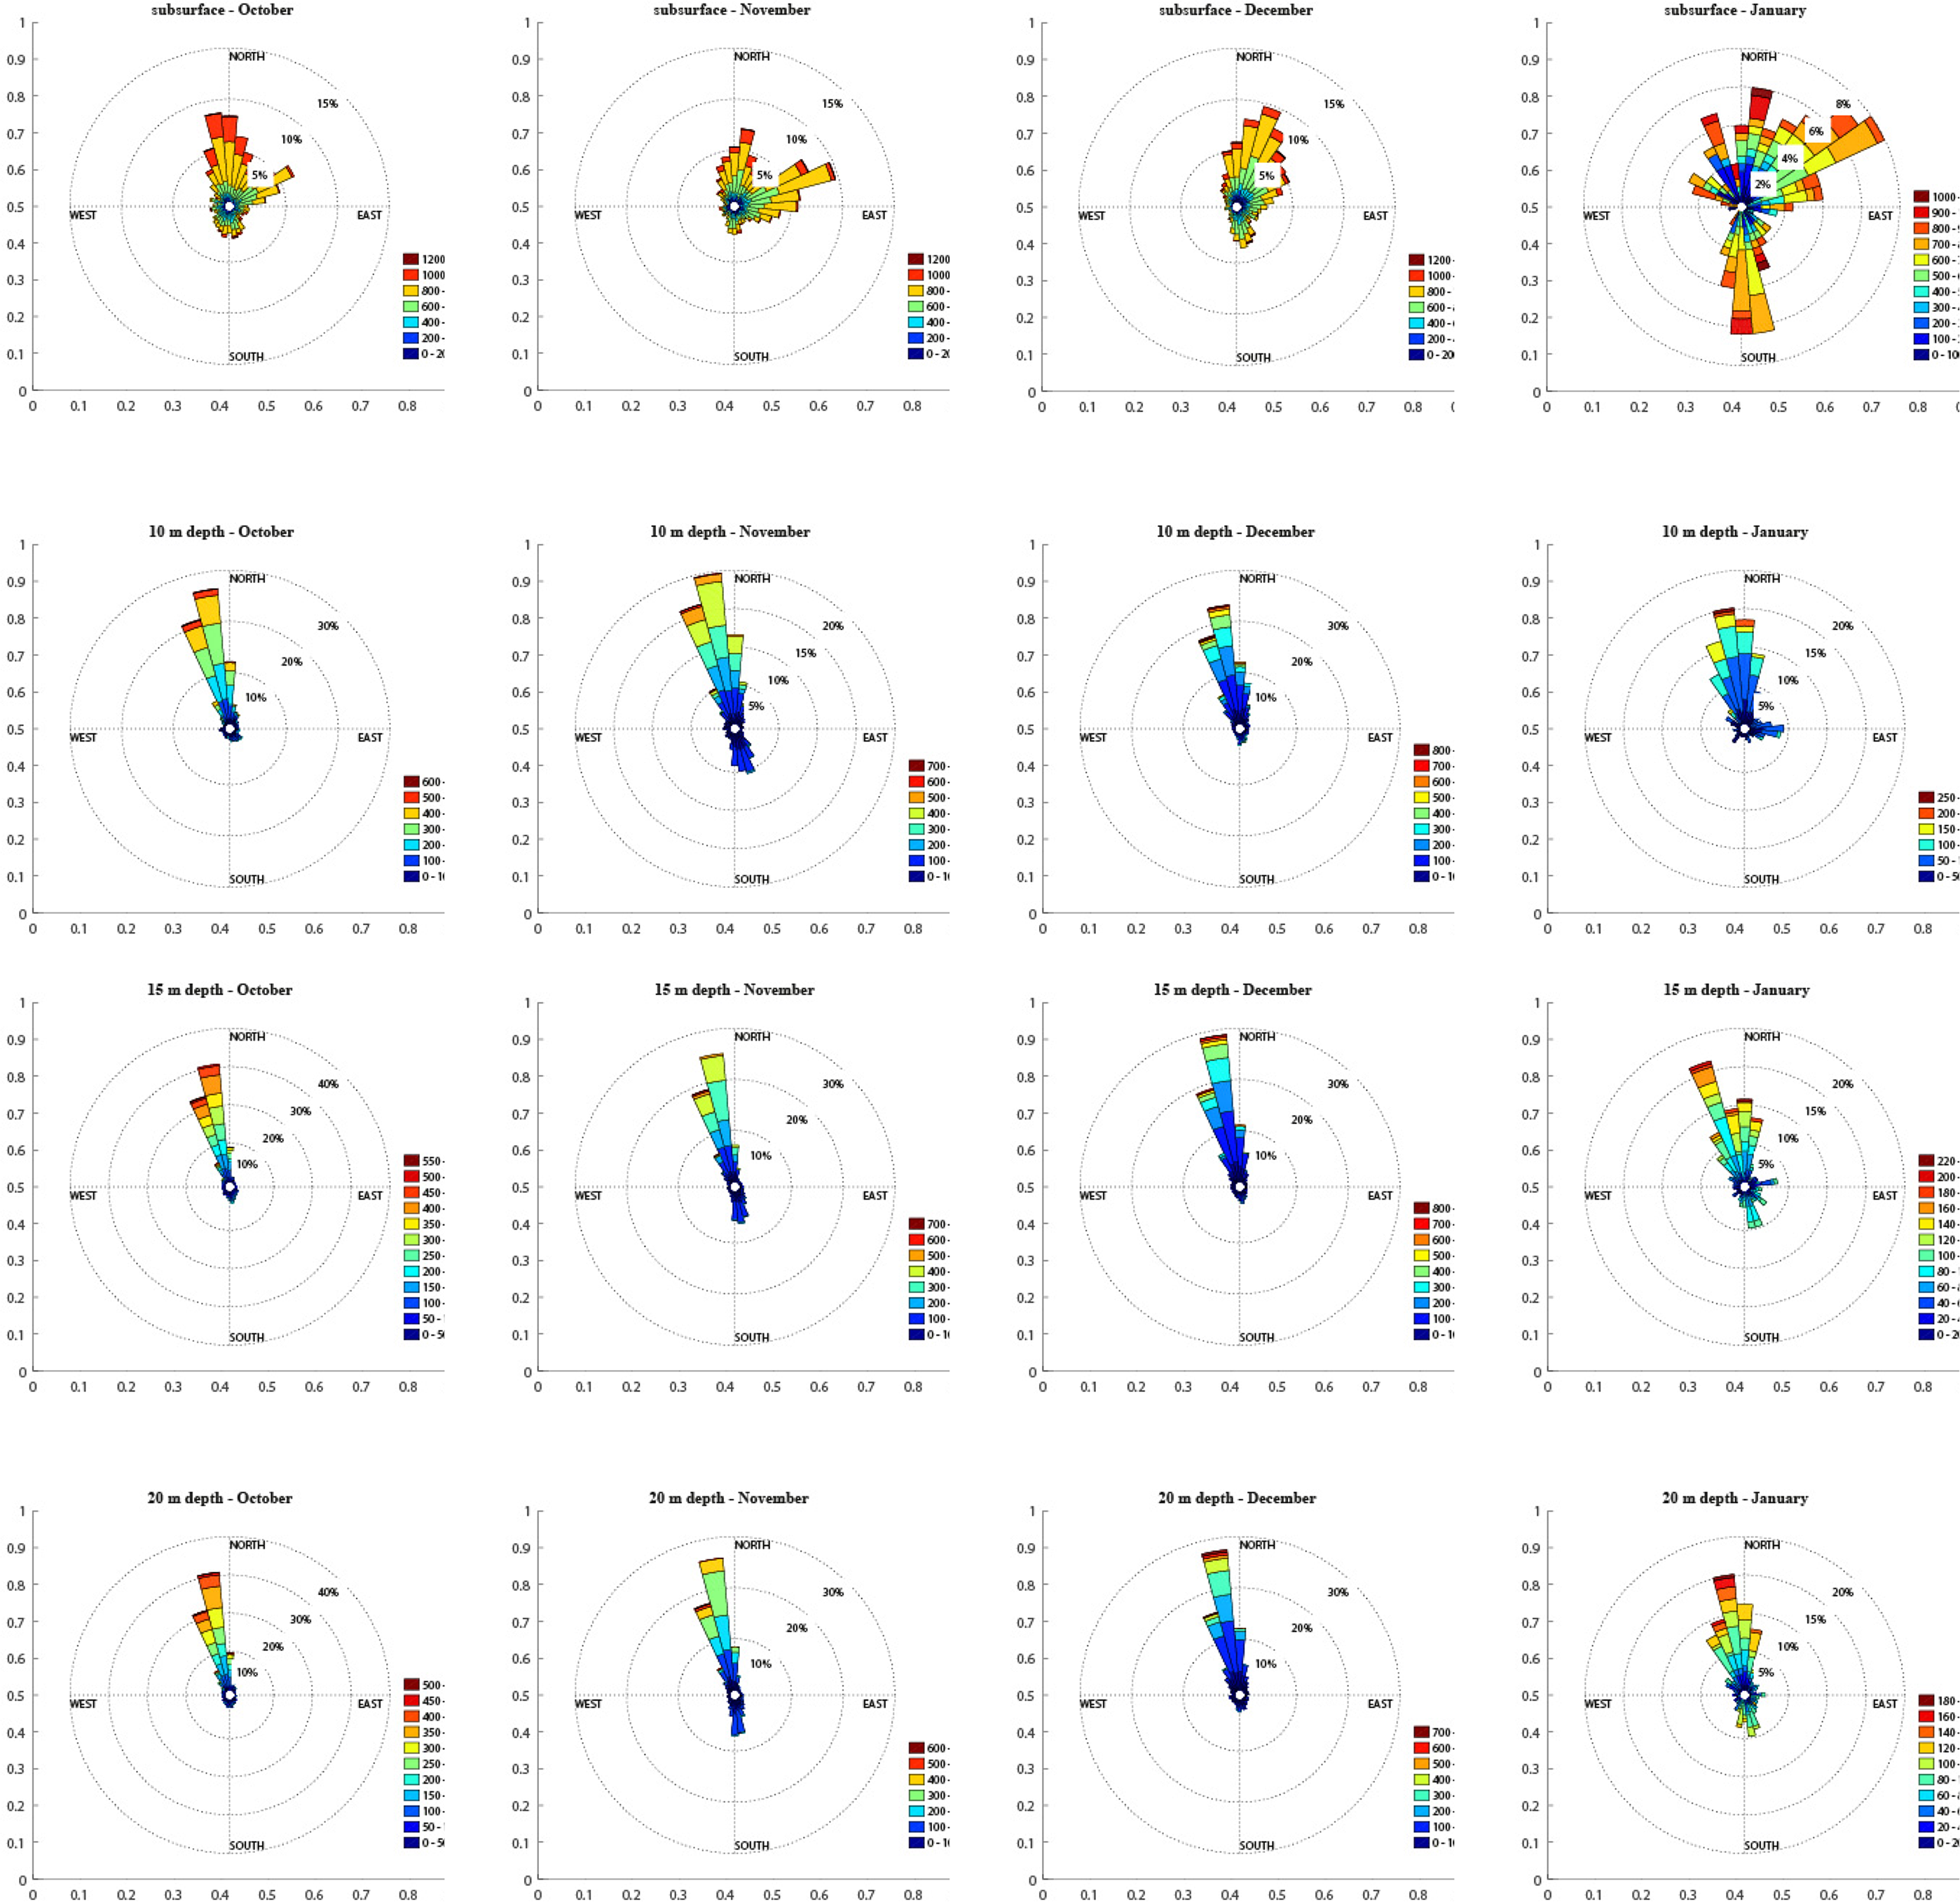
Figure 11 Monthly diagrams of current speed and direction distribution measured at subsurface layer, 10, 15 and 20 m depths.
2.3. Variability in winds
Meteorological parameters, wind velocity, and direction were recorded at the coastal weather station of Nowshahr Airport. Characteristics of current and wind gust during the study were presented in wind rose diagram in Figure 12. Wind speed ranged between 2 and 19 m s−1 during the observations. According to the only case of wind speeds more than 15 m s−1 (mean value of near gale speeds), only two important wind events occurred during the whole time of the study. The maximum values of wind speed were recorded in December characterised by northwest-oriented winds in the area. The wind rose diagram presented in Figure 12 (left panel) reporting the recorded wind indicates that the winds originated mainly from two directions: west and northwest. The most intense winds over the region arrive from the northwest direction. Some variations in wind direction are notable: some winds (less than 10%) come from the east with velocities up to 6 ms−1. Some weaker wind come from the south and southeast. On the other hand, the dominant direction of blowing winds was from the northwest and west. Generally, in autumn–winter, two prevailing directions (west and northwest) were observed. It is worth noting that north was the dominant direction of wind cross-shore components, while five events of significant along-shore component winds were observed in the west direction.
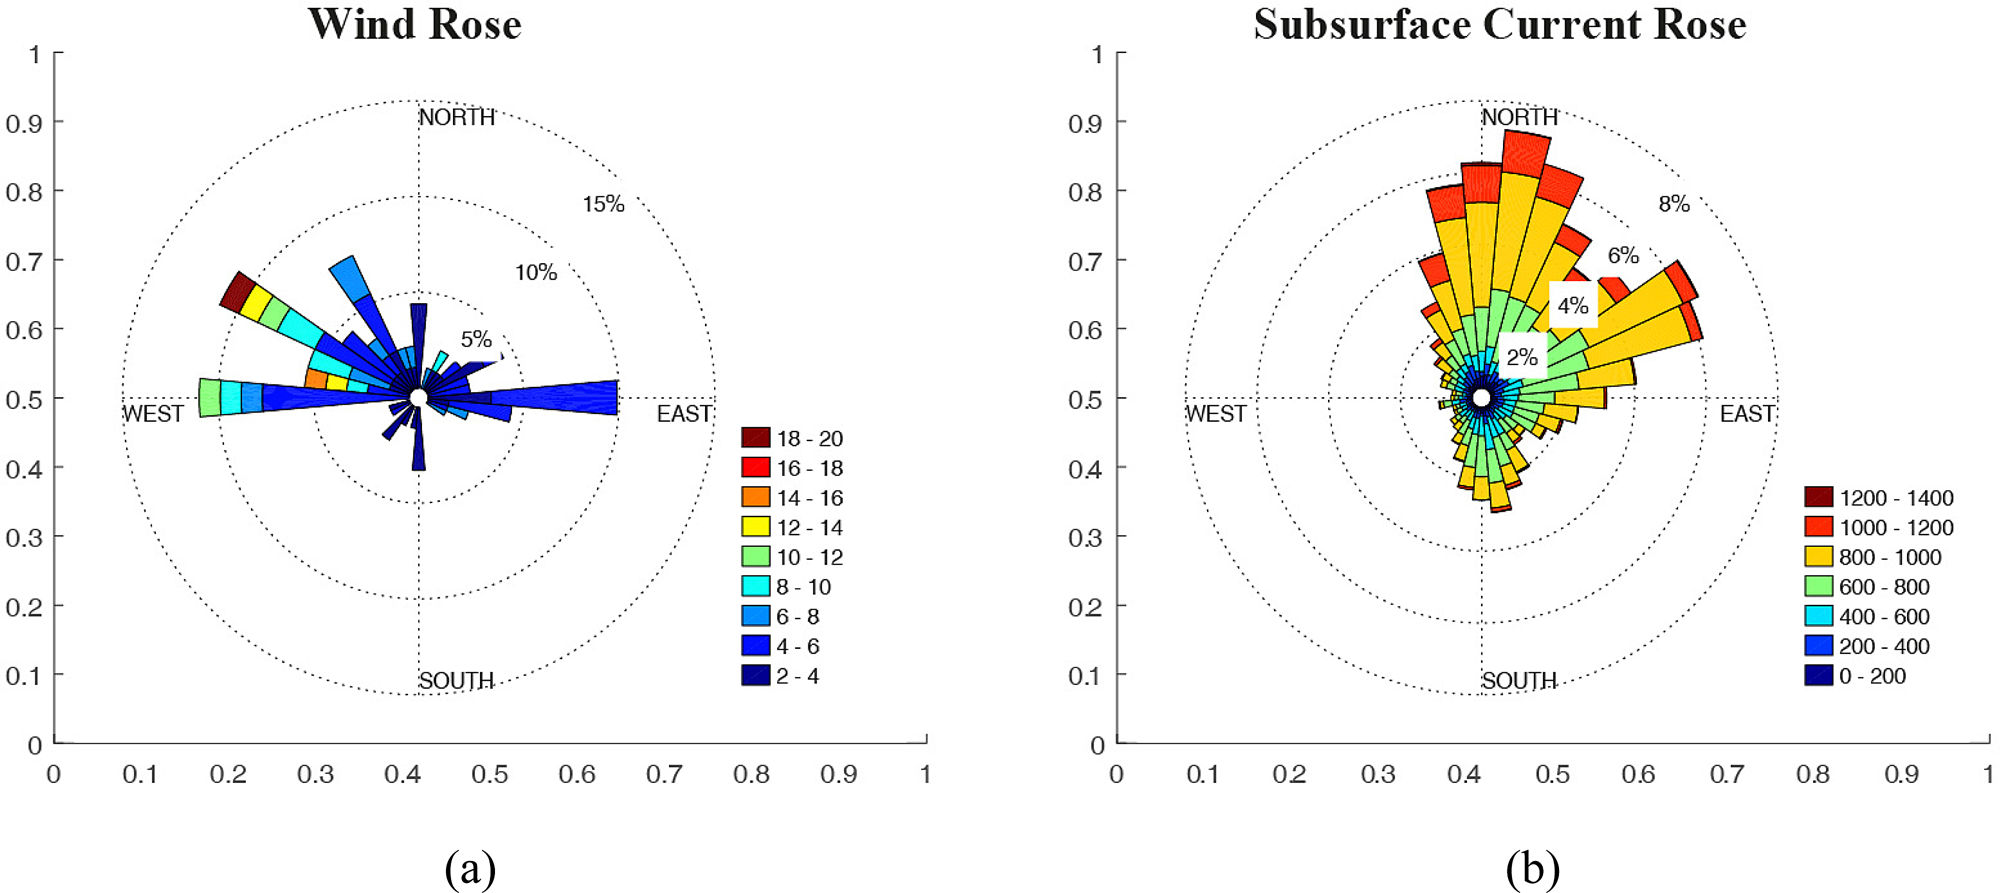
Figure 12 (a) Rose diagram indicated the maximum velocity (m s−1) and direction of gusts (left diagram). (b) Diagram of current speed (mm s−1) and direction distribution measured at subsurface layer (right diagram).
2.4. Data correlation
Variations in current data correlation are observed considering current velocities recorded at different layers in the water column (Figs 4, 8–10). The correlation level between current velocities recorded at the subsurface layer and 10 m depth was greater than those calculated between the subsurface layer and 20 m layer. The cross-correlation coefficient value between the measured along-shore component of the current data at the subsurface level and collected along-shore velocities at 10 m depth was r = 0.46. Meanwhile, the coefficient calculated for the cross-shore components at the mentioned levels was equal to 0.22. The cross-correlation coefficients calculated between the subsurface current components and depths of 15 m and 20 m was lower than the above-mentioned values. Indeed, the general trend of speed measurements at various levels showed a similar behaviour, which tends to diminish as the difference between measuring layers grows. The cross-correlation coefficient calculated for along-shore current components between the subsurface layer and depth of 15 m was about r = 0.39, while for cross-shore component values between those layers it was greater than 0.06. The correlation coefficient indicates a descending trend when the subsurface current velocities are compared with the recorded values at 20 m depth (for along-shore component r = 0.34 and for cross-shore components lower than 0.01). The correlation between sea current and wind components was minor. It means that the local wind components do not significantly affect the direction and velocity of the current over the southern continental shelf. The cross-correlation coefficient between along-shore component of subsurface current and along-shore wind element was low (r = 0.5). Meanwhile, the correlation coefficient for cross-shore components of wind and subsurface current was computed about 0.32. Thus, due to the weak relationship between the flow components near the surface and the wind, it seems that other factors are effective in creating surface currents in southern coasts. The analyses revealed that the currents in the region are not mostly local wind driven. Other forcing systems such as basin size circulation in the southern part of the Caspian Sea are effective.
2.5. Anthropogenic marine debris
The results indicated that the amount of soft plastic waste compared with the total waste was greatest at the Amirabad site, while hard litter was mostly present at the Nowshahr site (Fig. 13). Analysis of the samples indicated that the source of waste was mostly land based at all sites. On the other hand, in Amirabad port, more plastic waste was brought from the sea (Fig. 13f). Unfortunately, hospital waste was also found in marine and coastal litters, which indicates the extent of their persistence in the environment. The results of sample analysis showed that the volume of plastic was higher than that of other types of waste.

Figure 13 (a) Amount of non-plastic debris, (b) frequency and percentage of debris by gender, (c) percentage of plastic waste (litter) by type, (d) percentage of plastic based on type, (e) amount of plastic waste at sites base on plastic type, (f) values of litters based on source (marine or land), (g) amounts of debris based on colour and (h) percentage of litters based on colour in selected sites.
Regarding the sizing of the litter samples in the laboratory, the sample sizes ranged from zero to 0.5 mm (micro), 0.5–2.5 cm (meso) and more than 2.5 cm (macro). The highest amount and percentage of litter with the micro and meso sizes were found in the Amirabad area, while the most samples with macro size were found at the Nowshahr site. Note that the highest amount of micro-sized plastic waste (based on size) was observed in the Amirabad and Nowshahr sites. Meso-sized marine litter samples were observed and aggregated near the Nowshahr and Amirabad areas. Macro-sized litters were sampled from sites near the ports of Amirabad and Nowshahr. At all sampling sites, the amount of light-coloured waste was higher than that of dark-coloured samples of marine litters.
The results of sampling revealed that marine litters (soft plastic) by micro and meso sizes have mainly been observed in the eastern part of the region. However, macro-size marine litters (hard plastic) have mostly been observed near areas of the Nowshahr site. The analysis of the results raised the hypothesis that soft and smaller-scale seawater litters can be carried long distances along the coast by the current. The origin of most coastal-based and marine litters was from tourist activities, which accumulated in the middle and western parts of the southern shores.
3. Discussion
There is no doubt the current is one of the most important aspects in the movement of marine litters. Thus, it is very important to know how variable currents (current pattern) are on the continental shelf and which forces influence the sea current in the region. Accordingly in this research, the effect of sea current was evaluated on distributions of marine debris in the southern Caspian Sea boundaries.
Measurements in the deep-water zone of the sea indicate the thermal stratification and density layering of the water column. In general, the seawater density field near the mouth of a river was influenced by salinity fields, while away from the mentioned areas, was controlled by temperature structure (Tuzhilkin et al. Reference Tuzhilkin, Kosarev, Trukhchev and Ivanova1997; Tuzhilkin & Kosarev Reference Tuzhilkin, Kosarev, Kostianoy and Kosarev2005). The thickness of the thermocline layer mainly reaches about 40 meters in the strongest situation. Analysis of the data indicated that the pycnocline layer in the southern coastal waters of the Caspian Sea is formed at the position of thermocline layer.
In past studies, a few current velocity observations have been performed in the eastern and western parts of the southern coastal waters of the Caspian Sea. In contrast, the current profile measurement at this scale in the middle part of the southern continental shelf is the first of its kind. Based on the evaluations, the pattern of current velocities and directions in the middle part of the southern shelf of the sea was variable and specific.
The results here showed that the direction of sea surface currents mostly goes towards the north, northeast and north-northeast. On the other hand, current directions at lower layers were predominantly towards the north and north-northwest. Note that the recorded data in weather stations indicated that the dominant winds arrive from the northwest direction over the region.
As a comparison, the results of a study in the eastern part of the southern border of the sea showed that the local wind (weak) direction was mostly western–eastern. The wind pattern in the area revealed that wind components over the region were generally weak (annual average wind velocity is 3–4 m s–1) (Kosarev Reference Kosarev, Kostianoy and Kosarev2005). The northerly (from northwest, north and northeast) stable wind dominates over the sea during summer–autumn seasons. In some cases, the inversion of direction occurs and southeast winds predominate over the region during winter–spring seasons. The mentioned wind fields can be distinguished with regard to the path of the air mass movement (Kosarev Reference Kosarev, Kostianoy and Kosarev2005). The upwelling phenomenon (under the influence of local wind) and suitable situations for its creation were not observed in the study area. There is no strong relationship of collected current directions compared with the local wind in the area. Owing to the uncorrelated currents and the wind in the region, it seems that the dynamics of coastal waters in the study area is influenced by other factors such as the medium-scale anticlockwise circulation in the southern basin. The mentioned circulation was reported in previous oceanographic studies of the Caspian Sea (Tuzhilkin & Kosarev Reference Tuzhilkin, Kosarev, Kostianoy and Kosarev2005; Zaker et al. Reference Zaker, Ghaffari, Jamshidi and Nouranian2011).
As a comparison, it can be noted that the general pattern of the current over the southern continental shelf indicated an eastward direction of flow (maximum speed 1.3 m s−1). The obtained results under this research confirmed the information reported about the general regimen of coastal current and water circulation distinguished by the west-to-east direction (Zaker et al. Reference Zaker, Ghaffari, Jamshidi and Nouranian2011). This feature of the sea current is proof of the importance of shelf topography and anticlockwise water movement in the study area on the flow variability (see Tuzhilkin & Kosarev Reference Tuzhilkin, Kosarev, Kostianoy and Kosarev2005). The general pattern of the current in the region is influenced by the sub-basin eddy properties in the south part of the sea.
The analyses performed during the research enabled us to highlight various characteristics of the current pattern and its behaviour over the southern continental shelf. Comparing the results of this study with previous works showed that the behaviour of current characteristics as well as physical properties of seawater is different and non-uniform along the different seas (Caspian Sea, Aral Sea, Black Sea and Mediterranean Sea) borders. These differences can arise from the topography and morphology of the coasts and shelf, and large-scale circulation (Terziev et al. Reference Terziev, Kosarev and Aliev1992; Ibraev et al. Reference Ibraev, Ozsoy, Ametistova, Sarkisyan and Sur1998; Kosarev Reference Kosarev, Kostianoy and Kosarev2005; Cutroneo et al. Reference Cutroneo, Ferretti, Scafidi, Domenico Ardizzone, Vagge and Capello2017). Note that the western part of the southern shelf has a steep slope and narrow width, which extends to the middle of the southern border. In contrast, the eastern continental shelf has a gentle slope and a large width. The eastern shelf (with about 190 km wide) is wider than western continental shelf (Fig. 1). The shelf break is located at depths of 100–130 m. The width of the narrow western continental shelf is up to 10 km. With respect to the shelf structure and gyre mechanism in the south basin, it seems that the general pattern of dipole sub-basin gyre over the southeastern deep water and shelf structure can affect the velocities.
The prevailing direction of local wind seemed to agree with the northwest orientation over the south coast of the sea. The northwest and north directions of the dominant wind are seasonally changeable (to southeasterly direction) over the sea area in accordance with the direction of the air mass transfer (Kosarev Reference Kosarev, Kostianoy and Kosarev2005). In the south basin of the sea, the number of days with stormy conditions (wind velocities more than 15 ms−1) can be up to 30. As found in another study (Zaker et al. Reference Zaker, Ghaffari, Jamshidi and Nouranian2011), the local wind and sea current appear to be uncorrelated elements in terms of direction and speed. This situation is in accordance with what was observed and reported over the eastern part of the south coast (Kosarev Reference Kosarev, Kostianoy and Kosarev2005; Tuzhilkin & Kosarev Reference Tuzhilkin, Kosarev, Kostianoy and Kosarev2005; Zaker et al. Reference Zaker, Ghaffari, Jamshidi and Nouranian2011).
In order to compare the effect of wind fields in different regions of the Caspian Sea, the following wind-driven cases should be considered. Along-shore wind (north and northwest directions) on the eastern shores of the middle Caspian Sea creates summertime upwelling (vertical Ekman velocities) with a size as large as several tens of kilometres (Kosarev Reference Kosarev1990; Tuzhilkin & Kosarev Reference Tuzhilkin, Kosarev, Kostianoy and Kosarev2005). Also, a rare upwelling phenomenon affected by southerly winds (non-dominant and limited period) forms on the western coast of the middle part (Tuzhilkin & Kosarev Reference Tuzhilkin, Kosarev, Kostianoy and Kosarev2005). It seems that, over the eastern and western shelves of the middle basin, along-shore components of the current and local wind stress are correlated near to the coastline. On the other hand, in the shallow water northern basin of the Caspian Sea, wind-induced current is mostly observed with variable speeds and less stable directions. In stormy conditions, the velocity of the mentioned flow reaches 1 ms−1 (Terziev et al. Reference Terziev, Kosarev and Aliev1992).
However, it should be noted that in some cases, strong wind events with limited duration over the sea seem to be able to affect the sea flow speeds (Tuzhilkin & Kosarev Reference Tuzhilkin, Kosarev, Kostianoy and Kosarev2005). The influence of strong winds on sea current and increasing kinetic energy of the water column during late autumn–winter (when the seawater column is homogeneous) has been reported (Kosarev Reference Kosarev, Kostianoy and Kosarev2005; Zaker et al. Reference Zaker, Ghaffari, Jamshidi and Nouranian2011). Indeed, during the mentioned period, thermal stratification of the water column had not yet been formed by the air warming in the region.
4. Conclusion
Analysis of physical and hydrodynamical parameters clearly showed that their variability in deeper layers was minor. Physicochemical characteristics of water columns over the continental shelf areas were mainly influenced by atmospheric factors and river water discharge. Monthly and seasonal variations of water parameters in the mentioned areas were significant. Sea surface temperature changes during the year were measured at about 20°C. Changes in water parameters below the thermocline layer (intermediate layer) were less than those across the near-surface layer. The pattern of current velocities and directions at the surface was not exactly the same compared with the flow characteristics in the lower layers. Maximum monthly along-shore current velocities of 1.25 and 1.34 m s−1 were observed in November and December, respectively. Mean monthly cross-shore component velocities were observed about 0.29 m s−1 in November. The results indicated no upwelling phenomenon or vertical Ekman pumping associated with the regional wind in the study area.
The impact of the general movement of current along the southern coast on marine debris was discussed. The investigations indicated that the direction pattern of the movements was mostly from western to eastern part of the sea along the southern coasts. Macro-size marine litters (hard plastic) were mostly observed near the Nowshahr site. The findings indicate that soft and small-scale seawater litters can be carried long distances by the current along the coast. The origin of most coastal based and marine litters was tourist activities, which accumulated in the middle and western parts of the coast.
5. Acknowledgements
The research work supported by Iranian National Science Foundation (INSF, project no.: 97009951) and Iranian National Institute for Oceanography and Atmospheric Science (INIOAS, project no.: 395-012-01-020-03). We would like to appreciate all colleagues in INIOAS for cooperation in field work.


