


Introduction
The evaluation of life history traits and construction of life tables are particularly valuable in the elucidation of the population dynamics of a species (Southwood & Henderson, Reference Southwood and Henderson2000). Life tables summarise the survival and mortality of a population (Service, Reference Service1993). They were first used to study mosquito populations in the 1970s (Service, Reference Service1971; Southwood et al., Reference Southwood, Murdie, Yasuno, Tonn and Reader1972; Lakhani & Service, Reference Lakhani and Service1974). In particular, life tables were used to evaluate the effect of predation on the survival of anopheline immature mosquitoes in rice fields (Mogi et al., Reference Mogi, Okazawa, Miyagi, Sucharit, Tumrasvin, Deesin and Khamboonruang1986) and to compare life history traits of Toxorhynchites rutilus between two different habitats (Campos & Lounibos, Reference Campos and Lounibos2000). In this study, we examine life history traits and construct life tables with the aim of comparing a population of Aedes caspius(Pallas, 1771) that had been subjected to a long-term larvicide control program with an Ae. caspius population that was free of treatment.
Ae. caspius is widely distributed in Europe (Gabinaud, Reference Gabinaud1975) and breeds in a variety of places (Rioux, Reference Rioux and Lechevalier1958). This species is of particular economic importance due to its capacity to cause substantial nuisance (Becker et al., Reference Becker, Petric, Zgomba, Boase, Dahl, Lane and Kaiser2003). Ae. caspius can transmit filariae, such as Dirofilaria immitis (Roubaud & Colas-Belcour, Reference Roubaud and Colas-Belcour1937), or arboviruses, such as Tahyna virus (Hannoun et al., Reference Hannoun, Panthier and Corniou1966). It is one of the vectors of Rift Valley fever in Egypt (Beier et al., Reference Beier, Zimmerman, Kenawy, El-Said and Abbassy1987). Akhter et al. (Reference Akhter, Hayes, Bagar and Reisen1982) successfully infected Pakistani Ae. caspius with West Nile virus in the laboratory, and this virus was isolated from a number of Ae. caspius individuals in Ukraine (Vinograd & Obukhova, Reference Vinograd and Obukhova1975).
The EID Méditerranée (Entente Interdépartementale pour la Démoustication, a regional centre for mosquito control on the Mediterranean coast; http://www.eid-med.org) has been using larvicides to control nuisance mosquito populations along the French Mediterranean coast for over 40 years. The control programme had reduced the level of nuisance, but high Ae. caspius larval densities were still frequently observed. These high larval densities are not due to resistance. Indeed, the sensitivity of Ae. caspius to insecticides has not changed since the beginning of the control programme (unpublished data). In addition, Aedes is unlikely to develop resistance due to molecular constraints (Weill et al., Reference Weill, Berthomieu, Berticat, Lutfalla, Nègre, Pasteur, Philips, Leonetti, Fort and Raymond2004). It is possible that Ae. caspius may have developed demographic mechanisms to compensate the effect of larvicide treatments.
To identify these demographic mechanisms, large-scale studies are required to compare the life cycles (egg hatching, larval and pupal development, emergence, adult longevity, fecundity, gonotrophic cycle, etc.) of different populations under larvicide control and with uncontrolled larval populations. However, such large-scale studies incorporating the full life cycle are rather difficult due to logistic constraints. Therefore, in 2003, the Mediterranean EID initiated a demographic study of two Ae. caspius populations: one from an area that has undergone 40 years of treatment and another from an untreated area. Life history traits of all stages of the life cycle (eggs, larvae and pupae, adults) were evaluated and compared between these two populations. The overall aim of this study was to determine which life history traits are different between these two populations, with a view to designing a simplified protocol for a large-scale study. Some results of this study are presented. Larval survival and development times were evaluated in the laboratory and the potential effects of population, larval density and developmental stage on these traits were tested.
Materials and methods
Cohort surveys
The two populations studied were collected from southern France. One (Mourgues: MO; 4° 15′ 52″ E; 43° 30′ 45″ N) had been controlled with larvicides for 40 years; the other (Pont de Gau: PDG; 4° 23′ 34″ E; 43° 30′ 04″ N) has never been controlled with larvicides. The two breeding sites are located about 50 km apart, harbour the same vegetation and are only flooded by rainfall.
Larvae were collected from each breeding site after flooding during the summer of 2005. They were reared to adult stage in the laboratory at 28.4±0.3°C, 52±0.7% relative humidity (RH) with a 16:8 light:dark cycle. Copulation was induced due to eurygamy (McDaniel & Horsfall, Reference McDaniel and Horsfall1957). Females were then placed in a 40×40×40 cm cage with a laying-box. A guinea pig was provided for blood-feeding 48 h after induced copulation. Eggs were maintained for at least ten days following oviposition. Egg hatching was induced with ascorbic acid (Sinègre, Reference Sinègre1974). Ae. caspius is a salt-marsh species; thus, larvae were transferred to a 33×22×6 cm plastic tray containing three litres of water with 2 g l−1 of NaCl after 24 h. They also require at least 16 mg of dry dog food powder for complete development (Sinègre, Reference Sinègre1974); thus, a surplus amount (5 g) was added to each tray to avoid larval starvation and competition. At 9:00 am every day, alive and dead individuals were counted for each stage (L1, L2, L3, L4 and pupae), dead larvae were removed and the water was refilled to compensate for evaporation.
Three F1 larvae densities for MO and five for PDG were studied: 30, 35.33 and 69 larvae per litre for MO, and 6.67, 7, 30, 35.33 and 65.67 larvae per litre for PDG. Life history traits were calculated for each breeding site, density and stage.
Life history trait estimations
A closed population is composed of k stages with k=1, 2,…, K; N k(n) is the total number of individuals at stage k at time t=nΔ, where n=0, 1, 2,…, ∞ and Δ is the time unit. The diagram of the Ae. caspius life cycle is shown in fig. 1 with K=5. The time variation in the population for each stage is described by:
where D k(n) is the total number of dead individuals at stage k between n and n+1,
E k(n) is the total number of individuals undergoing transition from stage k to k+1 between n and n+1,
where p k(n+1) and q k(n+1) are the probabilities of survival and transition from stage k to stage k+1 between n and n+1, respectively. Equation 1 is supplemented with the initial number of individuals, N k(0)=N 0 for k=1 and N k(0)=0 otherwise. The summation over time of equation 1 from n=0 to n=∞ (i.e. when all individuals have disappeared) gives:
where N total, k=N k(0)+M k is the cumulated number of individuals observed at stage k, ![]() is the total number of individuals found entering stage k, such that as M 1=0, and
is the total number of individuals found entering stage k, such that as M 1=0, and ![]() is the cumulated number of dead individuals observed at stage k. Combining the initial conditions with M 1=0, equation 4 is transformed into equation 5. This provides the cumulated number of individuals observed at stage k calculated from the total number of observed individuals and the total number of dead individuals at stage k−1,
is the cumulated number of dead individuals observed at stage k. Combining the initial conditions with M 1=0, equation 4 is transformed into equation 5. This provides the cumulated number of individuals observed at stage k calculated from the total number of observed individuals and the total number of dead individuals at stage k−1,
Now, equations 1–5 are used to define and derive expression of life history traits. Five quantities are of interest.
(i) The survival rate Φk of individuals at stage k is defined as:
(6)
(ii) The stage duration τk (i.e. the mean time spent at stage k for individuals) is calculated from:
(7)(iii) The daily survival probability p k of individuals at stage k is assumed to be constant over time (for sufficient short τk) is:
(8)(iv) The transition probability q k, assumed to be constant over time (for sufficient short τk), from stage k to stage k+1 is calculated from previous traits as:
(9)(v) The intrinsic physiological stage duration T k, i.e. the bare stage duration without mortality effect (T k≥τk), is:
(10)
The life history traits can be summarised by two comprehensive characteristics: S, the overall larval survival; and τa, the total larval development time. The overall larval survival is defined as the product from k=1 to 5 of all Φk times q k, and the total larval development time τa as the summation from k=1 to 5 of all τk.

Fig. 1. Diagram of the life cycle of Ae. caspius. Ei denotes the total number of individuals undergoing transformation from stage i to stage i+1; and Di, the total number of dead individuals in stage i. S, the overall larval survival; τa, the total larval development time. Only the larval and pupal stages were considered in this study.
Statistical analysis
The normality of the life history traits was tested using a Shapiro-Wilk test (Zar, Reference Zar1999). When normality was rejected, the transformation of Box-Cox (Box & Cox, Reference Box and Cox1964) was used. This method uses the λ transformation to normalise the data using,
where y trans is the transformed data, and y is the raw data. Then, the normality of y trans was tested using a Shapiro-Wilk test.
The effects of the breeding site (bs), larval density (ld) and stage (st) on Φk, τk, p k, q k, and T k were analysed using a generalised linear model (glm). The life history trait variable was a continuous response variable. The breeding site and stage variables were treated as categorical explanatory variables, and the larval density variable was an ordinal explanatory variable. The glm y trans=bs∗ld∗st, with interactions between explanatory variables, was fitted using a Gaussian error structure, the identity as link function and tested by F-statistics (Crawley, Reference Crawley2005). A second glm y trans=bs+ld+st was fitted without the interactions between explanatory variables. The model selected for interpretation was the model with the lower Akaike's information criterion (AIC: Akaike, Reference Akaike1987). In the case where a significant effect of developmental stage was detected using the glm, an ANOVA (Zar, Reference Zar1999) and pairwise comparison with the Bonferroni corrected post-hoc test were used. The same procedure was used for S and τa without the explanatory variable stage. All statistical analyses were performed using the R 2.1.0 software (R Development Core Team, 2005).
Results
The transition probability, q k, and the total larval development time, τa, were normally distributed (Shapiro-Wilk test: W=0.9687, P=0.326 and W=0.9534, P=0.746, respectively). However, the other life history traits were not normally distributed using the Shapiro-Wilk test: Φk (W=0.7959, P<0.001), τk (W=0.9331, P=0.02), p k (W=0.7399, P<0.001), T k (W=0.9078, P=0.003) and S (W=0.807, P=0.034). Therefore, Box-Cox transformations were performed for these traits (with λ=10.6, −0.3, 18, −0.3 and 0.4, respectively) and the transformed traits were adjusted to normality (Shapiro-Wilk test: W>0.94 and P>0.05 for all traits).
Two types of glm were fitted, with or without interactions. For each life history trait, the model without interaction gave the lower AIC; this model was, therefore, used for interpretation. Breeding site did not have a significant effect on Φk, τk, p k, q k, T k, S or τa (table 1). Density did not have a significant effect on τk, q k, T k, S or τa but showed a positive correlation with Φk and p k (fig. 2).

Fig. 2. Relationship between the survival rate Φk (▲) and daily survival probability p k (●), and the larval density. Means and standard errors were calculated from raw data.
Table 1. Akaike information criterion (AIC) and statistics (F-statistic, degrees of freedom (df) and P-value) of the generalised linear models without interaction fitted on life history traits (LHT).
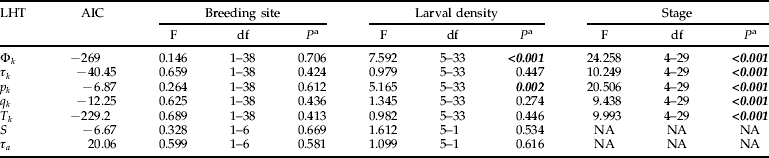
Φk, the survival rate; τk, the stage duration; p k, the daily survival probability; q k, the transition probability; T k, the intrinsic stage duration; S, the overall larval survival; τa, the total larval development time.
a Significant P-values are in italic and boldface.
The developmental stage had a significant effect on Φk, τk, p k, q k and T k (table 1, figs 3 and 4). L4 larvae and pupae had lower Φk values than L1, L2 and L3 larvae (ANOVA, F=12.653, df=4–35, P<0.001). Pupae had a lower p k than the other stages (ANOVA, F=13.028, df=4–35, P<0.001). L2, L3 larvae and pupae had higher q k values than L1 and L4 larvae (ANOVA, F=9.086, df=4–35, P<0.001). L1 and L4 had higher values for both τk and T k than L2, L3 larvae and pupae (ANOVA, F=10.381 for τk and F=10.109 for T k, df=4–35, P<0.001).

Fig. 3. Mean and standard errors of raw data for the survival rate Φk (▲), the daily survival probability p k (◆) and the transition probability q k (■) for each aquatic stage.

Fig. 4. Stage duration τk (■), in days, and the intrinsic stage duration T k (◆), in days, for each aquatic stage. Means and standard errors were calculated from raw data.
Discussion
The aims of this study were to evaluate larval life history traits of Ae. caspius in laboratory conditions, to study the effects of larval stage and density on these traits and to determine which life history traits are relevant for a large-scale study. The life history traits can be divided into two groups. The first group includes Φk, p k and q k, defining the survival of the larva, i.e. the capacity to survive and to develop from one stage to the next. These three traits were dependent on both larval density and stage. The second group includes τk and T k and defines larval development time. The life history traits of this second group were stage dependent only.
During the study, induced copulated females were maintained in one cage. The efficacy of induced copulation was less than 100% (Sinègre, Reference Sinègre1974), so some eggs laid were not viable. Therefore, the number of hatched eggs was not counted and the egg stage was not included in the valuation of the survival rate (Φk). The mean and standard deviation of survival rate for Ae. caspius (91.9±7.4%) was higher than those previously measured for other species, such as Aedes cantans (8.9%: Lakhani & Service, Reference Lakhani and Service1974), rice-field Anopheles (2%: Mogi et al., Reference Mogi, Okazawa, Miyagi, Sucharit, Tumrasvin, Deesin and Khamboonruang1986) or Toxorhynchites rutilus (1.8–5.6%: Campos & Lounibos, Reference Campos and Lounibos2000). However, these previous studies took the egg stage into account and were performed in the field. Indeed, survival rates measured in our study may have been lower if the egg stage had been included in our estimations or if they had been evaluated in the field.
We detected a positive correlation between larval density and both Φk and p k values. In theory, increased larval density increases larval competition, leading to decreased larval survival; thus, we expected a negative correlation between larval density and survival. Most mosquito species display gregarious behaviour to optimise survival (Delgado, Reference Delgado1998). This may explain the positive correlation observed between larval density and Φk in conditions of surplus food, which we added to avoid larval starvation and competition. The daily survival probability (p k) was density dependent because it was calculated using the survival rate (Φk; see equation 8), which itself was density dependent. We did not detect an effect of larval density on the life history traits, τk and T k. However, previous studies have shown the duration of the developmental stage in mosquitoes to be density dependent (Hassell et al., Reference Hassell, Latto and May1989; Delgado, Reference Delgado1998; Aigbodion & Okaka, Reference Aigbodion and Okaka2001), with a greater average stage duration detected at higher larval densities (Aigbodion & Okaka, Reference Aigbodion and Okaka2001). Moreover, most studies incorporating more than one generation detected this density effect on survival. Indeed, this effect of density may be obscured by variability acting upon the population within a generation; in this case, it would not be easily detected using a conventional life table (Hassell et al., Reference Hassell, Latto and May1989). We only studied one generation; thus, the limited range of densities used and the addition of surplus food may have prevented detection of density dependence in our study.
All life history traits studied were stage dependent. The survival rate (Φk) of the L1 instar was slightly, but not significantly, lower than that of the L2 and L3 instars but was significantly lower for L4 and pupae than for all the other stages. Moreover, the transition probabilities (q k) of the L1 and L4 instars were significantly lower than that of the other stages. The longer the stage duration, the higher was the probability of death. This explains the variation in Φk and q k between different instars. Indeed, the L1 and L4 instars had significantly longer stage durations (τk and T k) than the others. The L1 instar has a longer stage duration because, coming just after the egg stage, its energy is low and, therefore, needs more time to accumulate the energy to moult. As the pupae do not feed, the L4 instar larvae need to store a maximal amount of energy and, so, also require a longer stage duration (Clements, Reference Clements1992). Therefore, the first and fourth instars are key stages (Yamamura, 1999 in Campos & Lounibos, Reference Campos and Lounibos2000) of the aquatic life of Ae. caspius. The identification of these key stages may be useful in mosquito control programs and in population dynamic models.
For MO and PDG, the mean and standard deviation for S was 0.025±0.015 and 0.039±0.03, respectively, and for τa was 9.85±0.85 and 9.36±0.89 days, respectively. S and τa were not statistically different between the two breeding sites. These two sites, approximately 50 km apart, have similar vegetation and flooding tendencies. The similarity detected between these two different populations for Φk, τk, p k, q k, T k, S and τa may be due to the high migratory capacity (over 20 km) of Ae. caspius (Juminer et al., Reference Juminer, Kchouk, Rioux and Ben Osman1964).
This is the first study to estimate the larval survival and development time of Ae. caspius in laboratory conditions. No differences were detected between the two populations, which may be due to three possible explanations. Firstly, larvicide may not affect larval survival and development time of Ae. caspius. In this case, they would not be suitable for a large-scale study. Secondly, there may be an effect of larvicide treatment that was not detected due to lack of replication (only two populations) or due to the close proximity of the two populations given the high migratory capacity of Ae. caspius. These factors would need to be evaluated for a large-scale study. Thirdly, larvicide treatment may have an indirect effect, causing a decrease in larval density, which in turn modifies larval survival and development time. In this case, only the larval density would be a relevant factor to investigate in a large-scale study. Field evaluations on these two populations need to be carried out to determine the relevant factors to be considered for a large-scale study. Daily larval surveys will be performed and similar life tables to those presented here will be constructed to achieve this.
Acknowledgements
We thank J.-A. Rioux, J. Cousserans, G. Duvallet, J.-P. Hervé and C. Lagneau for their help in revising the manuscript. We are grateful to O. Moussiegt and Alex Edelman & Associates for help in the translation and correction of the manuscript.


