INTRODUCTION
Ciliates are among the most important marine micro-organisms, as they play a major role in the microbial food web (Azam et al., Reference Azam, Fenchel, Field, Gray, Meyer-Reil and Thingstad1983). Furthermore, ciliates exhibit a variety of nutritional habits and metabolic rates which significantly contribute to nutrient cycling (Fenchel, Reference Fenchel1980; Pierce & Turner, Reference Pierce and Turner1992). They have been reported to be ubiquitous and abundant in coastal as well as oceanic environments (Garrison et al., Reference Garrison, Gowing, Hughes, Campbell, Caron, Dennett, Shalapyononk, Olson, Landry, Brown, Liu, Azam, Steward, Ducklow and Smith2000), and show widespread distribution patterns (Agatha, Reference Agatha2011).
Ciliates represent a substantial fraction of zooplankton biomass in high latitudes (e.g. Garrison, Reference Garrison1991; Froneman & Perissinotto, Reference Froneman and Perissinotto1996; Nielsen & Andersen, Reference Nielsen and Andersen2002) and are thought to be key remineralizers of primary production (Burkill et al., Reference Burkill, Edwards and Sleigh1995; Archer et al., Reference Archer, Verity and Stefels2000; Putland, Reference Putland2000; Gaul & Antia, Reference Gaul and Antia2001). It is accepted that copepods dominate the mesozooplankton community in the southern Patagonian shelf (Sabatini et al., Reference Sabatini, Giménez and Rocco2001, Reference Sabatini, Reta and Matano2004) and in the Beagle Channel (Biancalana et al., Reference Biancalana, Barría de Cao and Hoffmeyer2007). Studies on ciliate diversity and temporal dynamics in the southern Atlantic Ocean are relatively scarce (Agatha, Reference Agatha2011). Moreover, the only reference on ciliates in the Beagle Channel is about the species composition during wintertime (Biancalana et al., Reference Biancalana, Barría de Cao and Hoffmeyer2007), but there are no available data either on their biomass or about their relationship with environmental variables.
On the other hand, it was pointed out that the growing population (~ 57000 inhabitants in 2010) of Ushuaia city, located on the north-western shore of Ushuaia Bay and the associated industrial and port activities have direct effects in the adjacent coastal area. A lower seawater quality resulting from high nutrient and organic loading was found near the urban and industrial centre (Amín et al., Reference Amín, Ferrer and Marcovecchio1996; Commendatore & Esteves, Reference Commendatore and Esteves2001; Esteves et al., Reference Esteves, Solís, Rodríguez and Willers2003). Also, a significantly higher heavy metal concentration was detected in this area (Amín & Comoglio, Reference Amín and Comoglio2007). Gil et al. (Reference Gil, Torres, Amin and Esteves2010), performed a detailed analysis of water and sediment quality in Ushuaia and Golondrina Bays, and concluded that the northwestern area of Ushuaia Bay has hypertrophic conditions, in contrast with the oligotrophic nature of the Beagle Channel. The main sources of these pollutants were sewage drainage and industrial effluent. A study on the structure and spatial and temporal dynamics of the mesozooplankton corroborated the occurrence of eutrophic conditions in the inner Ushuaia Bay (Biancalana, Reference Biancalana2008). Consistent differences in mesozooplankton assemblages were found, probably related to poor water quality (Biancalana et al., Reference Biancalana, Barría de Cao and Hoffmeyer2007). Studies relative to phytoplankton biomass and composition during an annual cycle in relation to environmental variables, demonstrated low density and biomass during autumn–winter and a significant increase in spring–summer (Almandoz et al., 2011). The mesozooplankton in the Beagle Channel exhibits a temporal pattern that is more dependent on primary production than on physical factors (Aguirre et al., Reference Aguirre, Capitani, Lovrich and Esnal2012).
The studies of Biancalana et al. (Reference Biancalana, Diodato and Hoffmeyer2012) showed that the enrichment of the water by an increase of nutrients indirectly contributed to modulate the spatial–seasonal distribution patterns of mesozooplankton.
The aim of this work is to report, for the first time, on the species composition, diversity and abundance of aloricate ciliates and tintinnids in the Beagle Channel in all the seasons, in relation to environmental variability and water quality.
MATERIALS AND METHODS
Study area
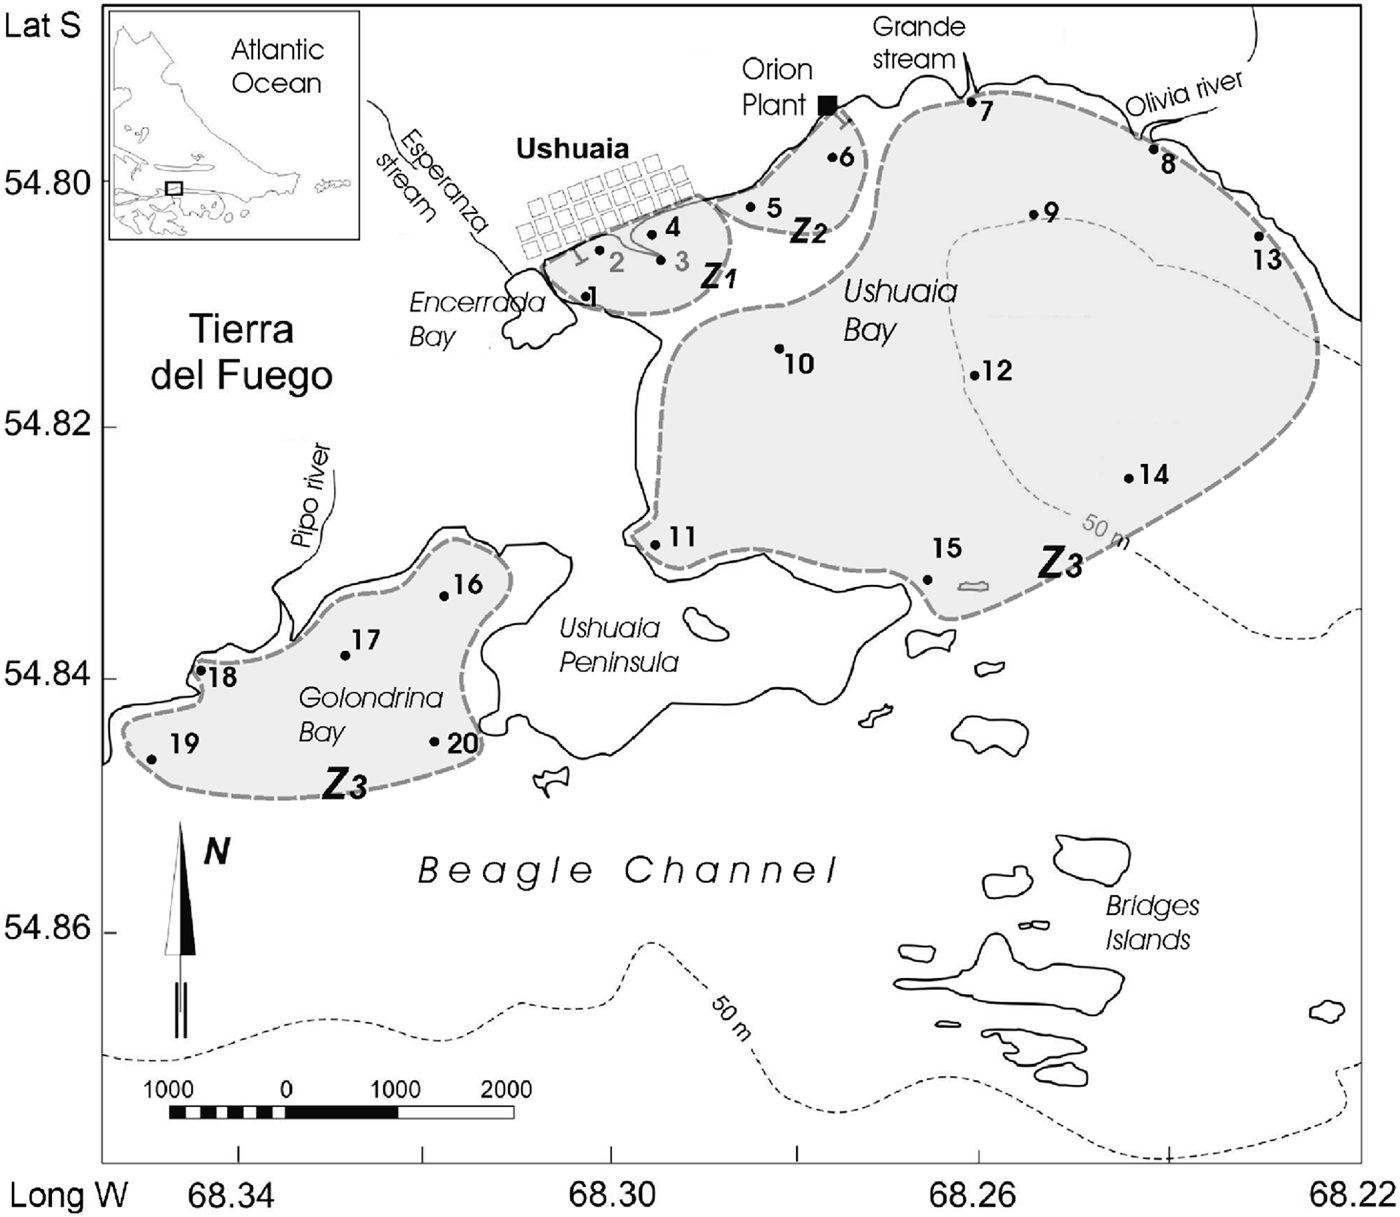
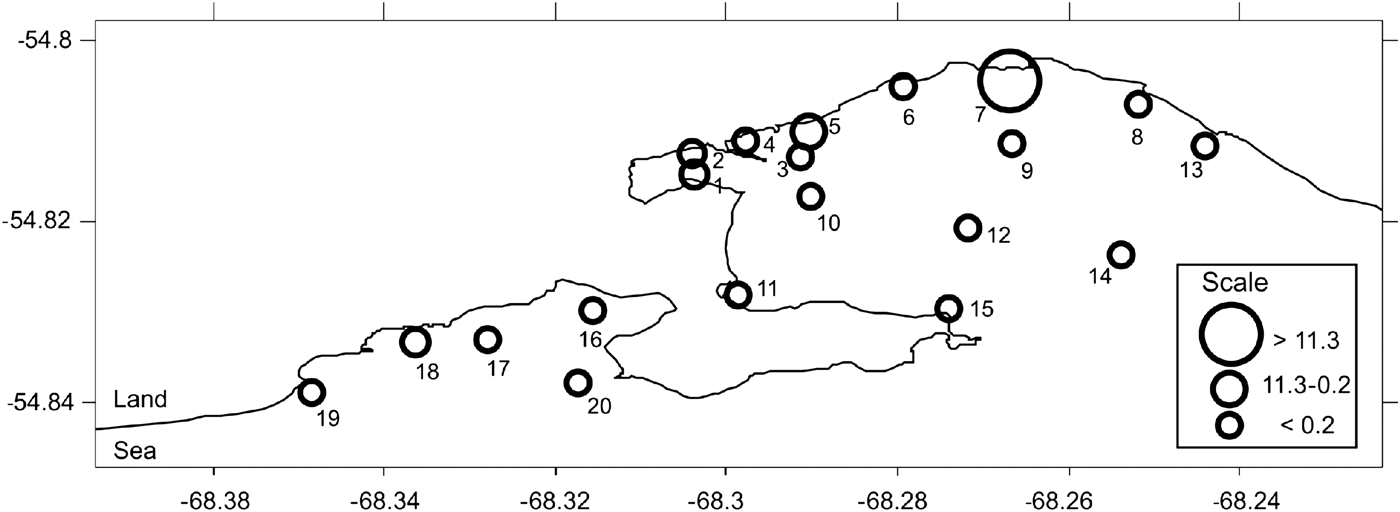
Ushuaia Bay (UB) and Golondrina Bay (GB) are located on the northern side of the Beagle Channel, Argentina (54°79′S 68°22′W and 54°85′S 68°36′W, respectively; Figure 1). These bays display different physical and hydrological features. Both their extent and bathymetry are markedly different. UB is 9 km long while GB is 2.2 km long. UB is deeper eastwards and towards the Beagle Channel, reaching 130 m depth, whereas GB is shallower (20 m approximately). The bays are also different in the composition of the bottom. GB displays a soft bottom surface, whereas UB presents a more consolidated soft bottom with stones and shells (Fernández Severini & Hoffmeyer, Reference Fernández- Severini and Hoffmeyer2005, and references therein). Balestrini et al. (Reference Balestrini, Manzella and Lovrich1998) reported for GB and Bridges Island areas, permanent currents flowing from the south-west with maximal velocities of 2.6 and 15.6 cm s−1, respectively. In UB a permanent strong current moves west along the northern coast of the bay at 2 cm s−1, and then progresses to the south-east along the southern coast at 16.3 cm s−1. The strong wind gusts coming mostly from the south-east can drive water mass transport in shallow areas and destabilize the structure of the water column (Isla et al., Reference Isla, Bujalesky and Coronato1999). Both bays receive effluent from Ushuaia city and the industries situated in the surroundings, mainly in the north-north-west area of UB. As a result, coastal waters are slightly polluted (Amín et al., Reference Amín, Ferrer and Marcovecchio1996; Commendatore & Esteves, Reference Commendatore and Esteves2001).

Fig. 1. Location of sampling stations in Ushuaia and Golondrina Bays in the Beagle Channel.
Sampling strategy and laboratory procedures
The sampling area comprised 15 stations in UB and five stations in GB (Figure 1). The environmental analysis made by Gil et al. (Reference Gil, Torres, Amin and Esteves2010) yielded the delimitation of three zones within these two bays: zone 1 (Z1), 2 (Z2) and 3 (Z3) which were taken into account for analysis in the present study. Z1 (NW area of UB) was the most perturbed by organic matter and nutrient enrichment due to the urban pressure and industrial effluents. Z2 comprised the sites on the northern coast of UB and Z3, and included those stations less influenced by anthropogenic activities. Z3 was formed by three sub-zones, one including the rest of stations located in UB, the second was located in GB, and a third sub-zone comprised the stations located in front of Olivia and Pipo rivers, within UB and GB, respectively. In accordance with the latter criterion, sampling Stations 1–4 belonged to Z1, Stations 5 and 6 to Z2 and Stations 7–20 to Z3, being Stations 8, 17 and 18 in a sub zone with freshwater influence (Figure 1).
Sampling was carried out in the four seasons from 2004 to 2005. Microplankton including ciliates was collected from surface water with a Van Dorn bottle and preserved in Lugol's solution.
Temperature, salinity, pH, dissolved oxygen and turbidity were measured by means of a multi-parametric sensor Horiba U-10. Chlorophyll-a and phaeopigments were estimated following Strickland & Parsons (Reference Strickland and Parsons1968), whereas nutrient concentration was analysed following the methods described by Grasshoff et al. (Reference Grasshoff, Ehrhardt and Kremling1983), using a Skalar auto-analyser.
Strombidid ciliates were identified according to Maeda & Carey (Reference Maeda and Carey1985) and tintinnids according to Kofoid & Campbell (Reference Kofoid and Campbell1929). For enumeration, a 50 ml subsample was concentrated after settling in a combined plate chamber; the entire bottom chamber was scanned for each subsample using a Wild M40 inverted microscope following the Utermöhl method after Hasle (Reference Hasle and Sournia1978). Biomass in terms of carbon was calculated using a factor of 0.19 pg µm−3 for the naked ciliates following Putt & Stoecker (Reference Putt and Stoecker1989), and a linear regression equation: C (pg) = 444.5 + 0.053 lorica volume (µm3), for tintinnids (Verity & Langdon, Reference Verity and Langdon1984).
Data analysis
The Shannon diversity index (H′, ln based) and total biomass of ciliates (µg C l−1) were calculated for each sample. For statistical analysis, the data set were transformed using the log10 (x + 1) (Clarke & Warwick, Reference Clarke and Warwick1994). The ANOVA and multiple comparisons LSD test were used to detect differences in chlorophyll-a and ciliate abundance between sampling dates and zones (Sokal & Rohlf, Reference Sokal and Rohlf1981). In order to analyse the contribution of each ciliate taxa to the similarity within zones and to the dissimilarity between zones delimited by Gil et al. (Reference Gil, Torres, Amin and Esteves2010), similarity percentage analysis (SIMPER) was carried out using the Bray–Curtis similarity index. The ANOSIM was later applied with the purpose of detecting significant differences in ciliate composition along the previously selected zones.
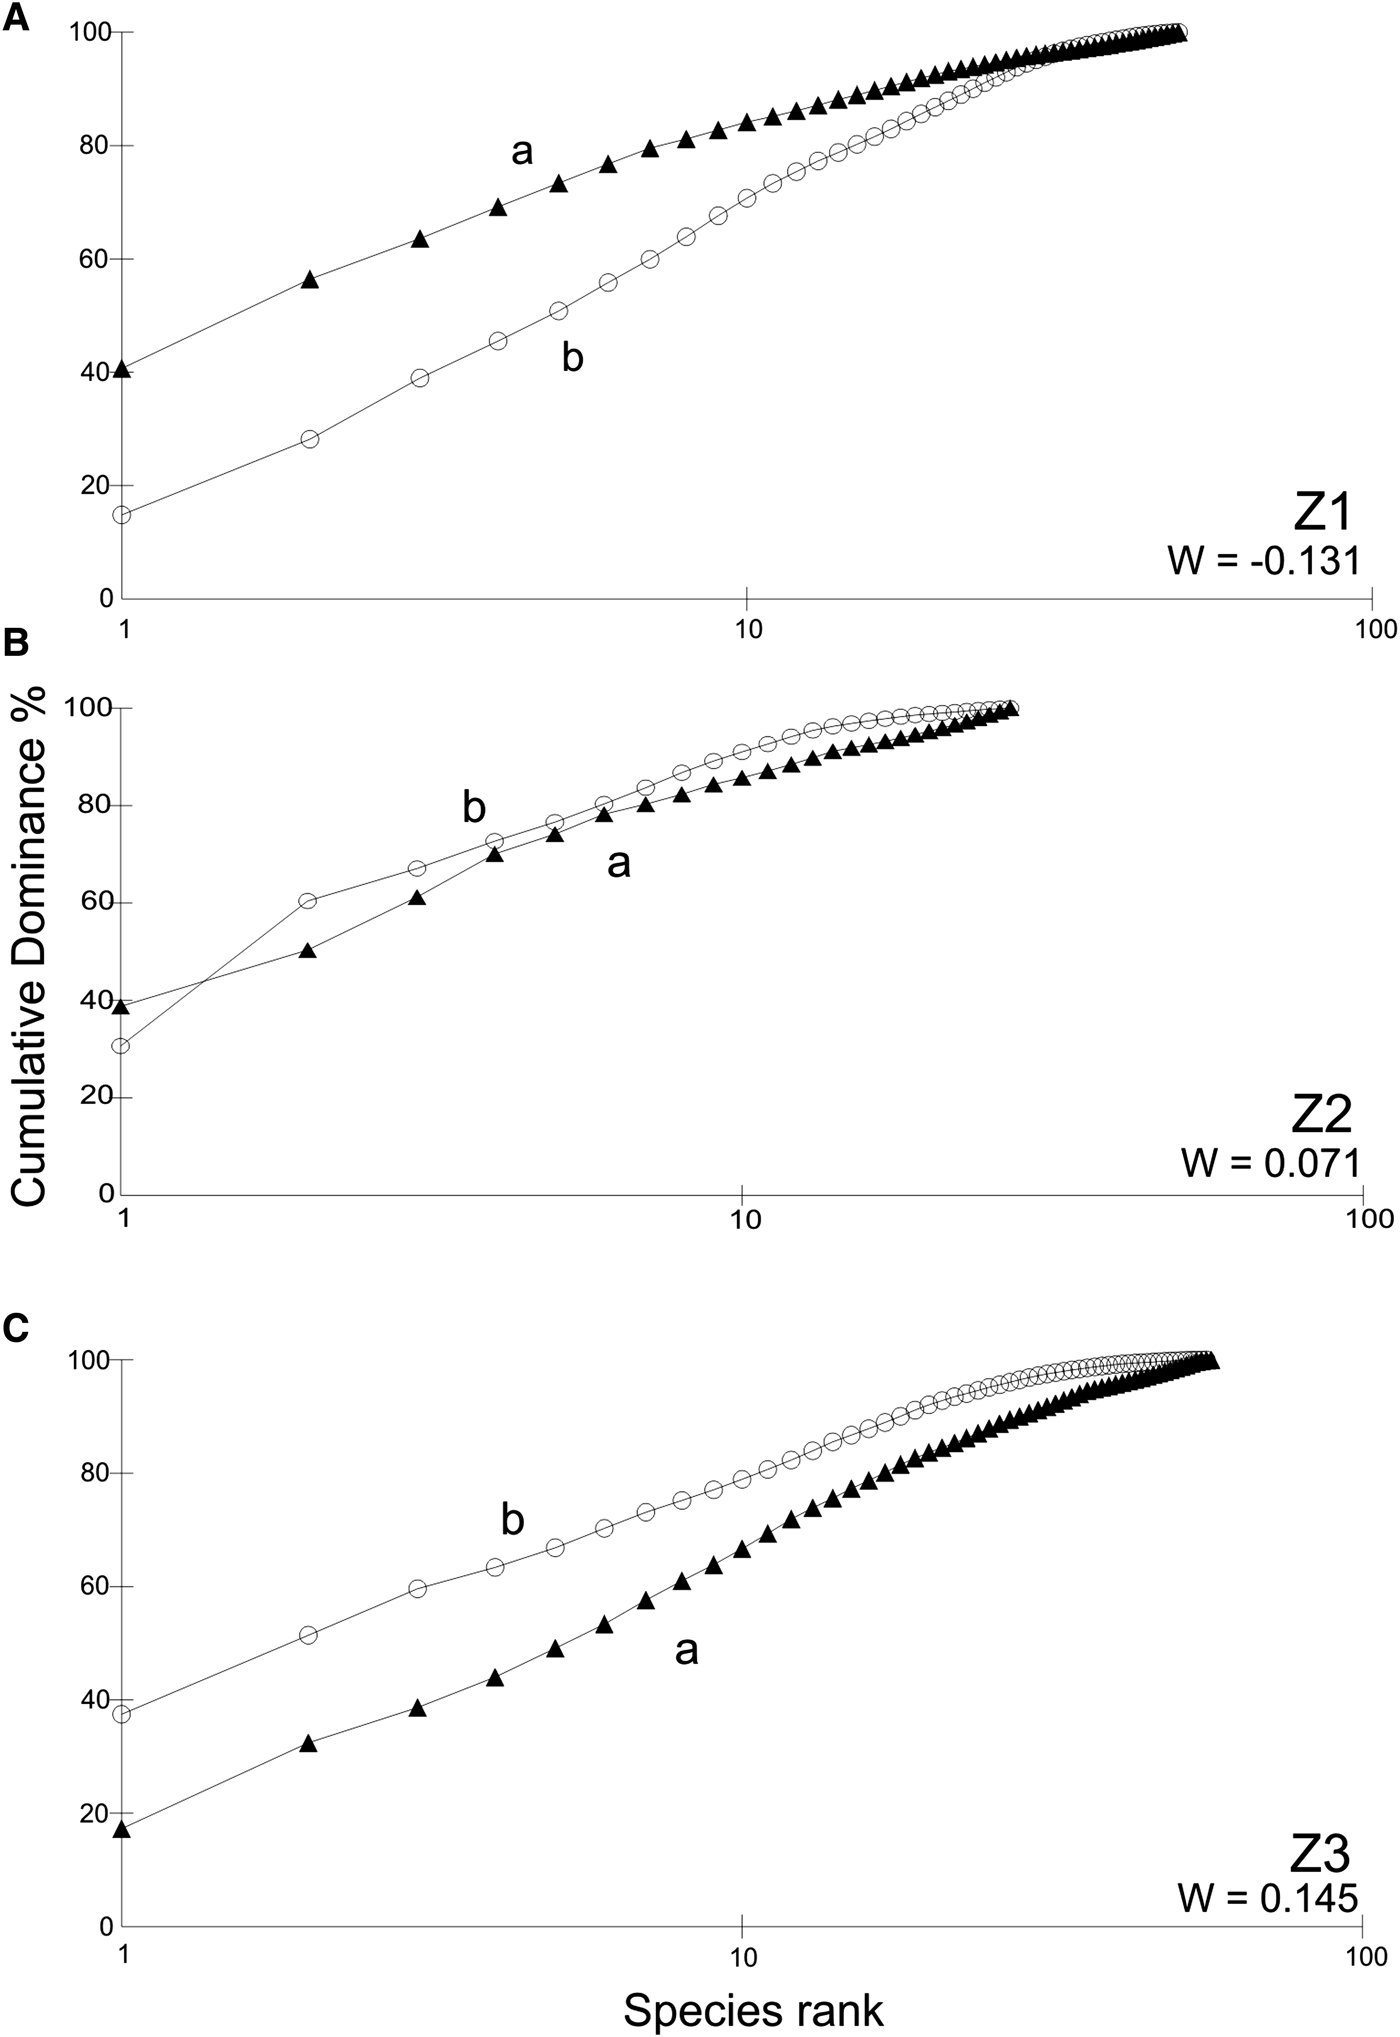
The variation in species composition and dominance in the three zones was examined through the abundance–biomass comparison (ABC) plot (Warwick, Reference Warwick1986). For the ABC curves, a total of 43 species of ciliates were considered. This representation has the advantage of easily comparing the distribution of species abundances among individuals and the distribution of species biomasses among individuals on the same terms, taking into consideration the species size. Species are ranked in order of importance of numerical abundance and biomass on the x-axis, and the percentage of dominance on the y-axis. The W statistic proposed by Warwick (Reference Warwick1986), allows testing for the statistical significance in different ABC plots, and ranges between −1 and 1. When the curve for biomass lies above the curve for abundance (W > 1), the biomass is dominated by one or few large species and numerical dominants are usually small opportunistic species which do not represent a large proportion of total biomass. Conversely, when the curve for abundance lies above the curve for biomass, large competitive dominants are gradually eliminated and the community biomass and numerical abundance become dominated by one or few very small species (W < 1).
The general trend of ciliate abundance, biomass, species richness and chlorophyll-concentration, as a proxy of phytoplankton, and the environmental variability (temperature, salinity and nutrients content) was studied using principal component analysis (PCA). The strength of the link between ciliates and environmental variability was investigated in the selected zones by comparing the first PC of both data sets through sliding correlation using bootstrap which involves random pairwise sampling with replacement. Each data set was resampled 1000 times. The probability density distribution of the corresponding correlation coefficients was then computed using non-parametric Kernel smoothing (Casini et al., Reference Casini, Hjelm, Molinero, Lövgren, Cardinale, Bartolino, Belgrano and Kornilovs2009). PRIMER 5 and Statistica 7 (Statsoft, Tulsa, OK, USA) packages were used to carry out the above mentioned analysis.
RESULTS
Species composition and diversity
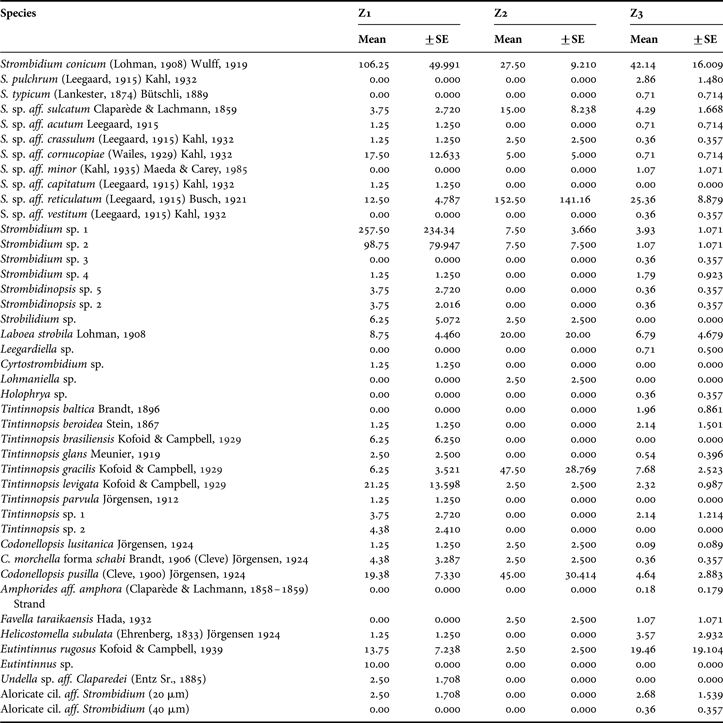
The ciliate community in UB and GB comprised a total of 43 species of which 25 were aloricate and 18 tintinnids belonging to eight and seven genera, respectively (Table 1). The mean diversity value for all the seasons for Z1 was 0.997, 1.065 for Z2 and 0.641 for Z3. Z1 and Z3 had the highest species richness but diversity values were significantly different (P = 0.05). Z2 presented a diversity value similar to Z1 and shared with the other two zones 11 of the 15 total species. In terms of seasonal mean diversity, the highest value was observed in Z1 in March, while in Z3, the highest average value of diversity was observed in August and the lowest in December and March. Strombidium and Tintinnopsis were the best represented genera of aloricate and tintinnid ciliates, respectively.
Table 1. Mean species seasonal abundance (No. ind. l−1) for each zone in Ushuaia and Golondrina Bays.

Seasonal variation and spatial distribution of ciliates, chlorophyll-a and environmental variables
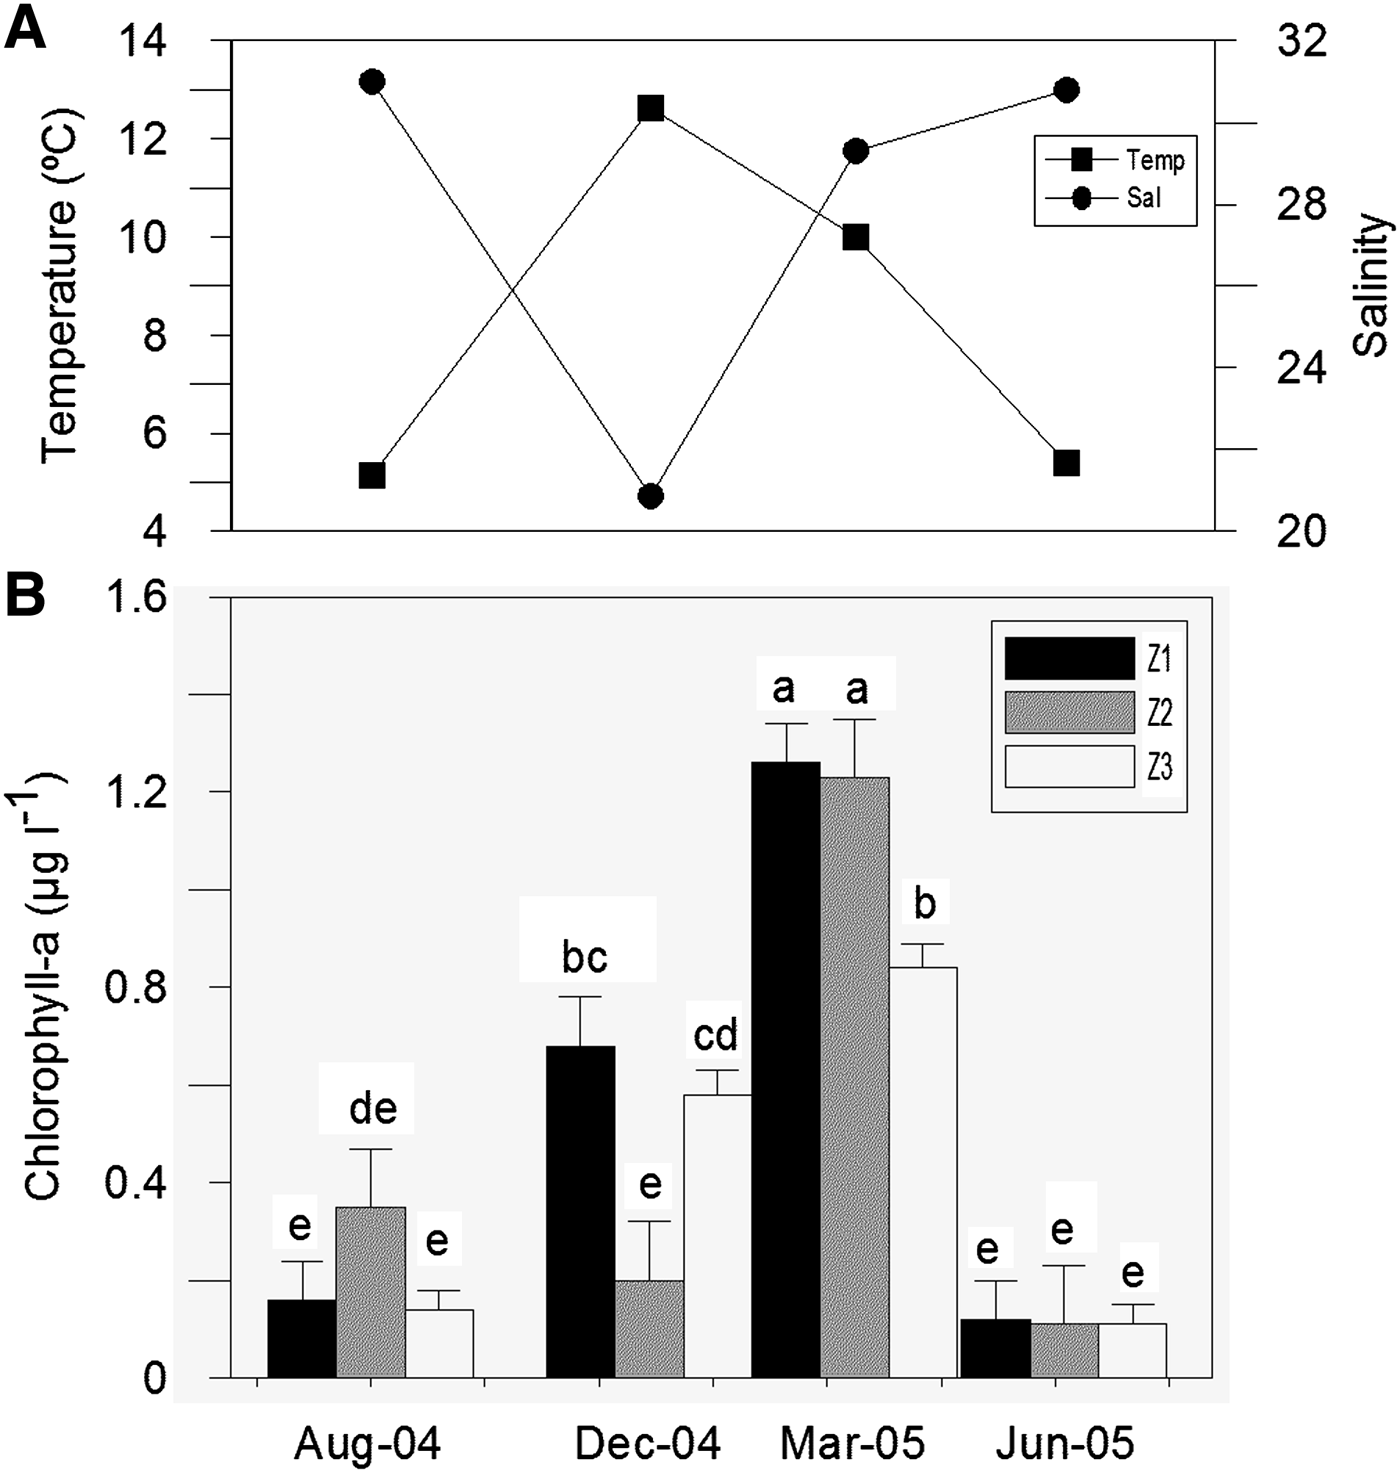
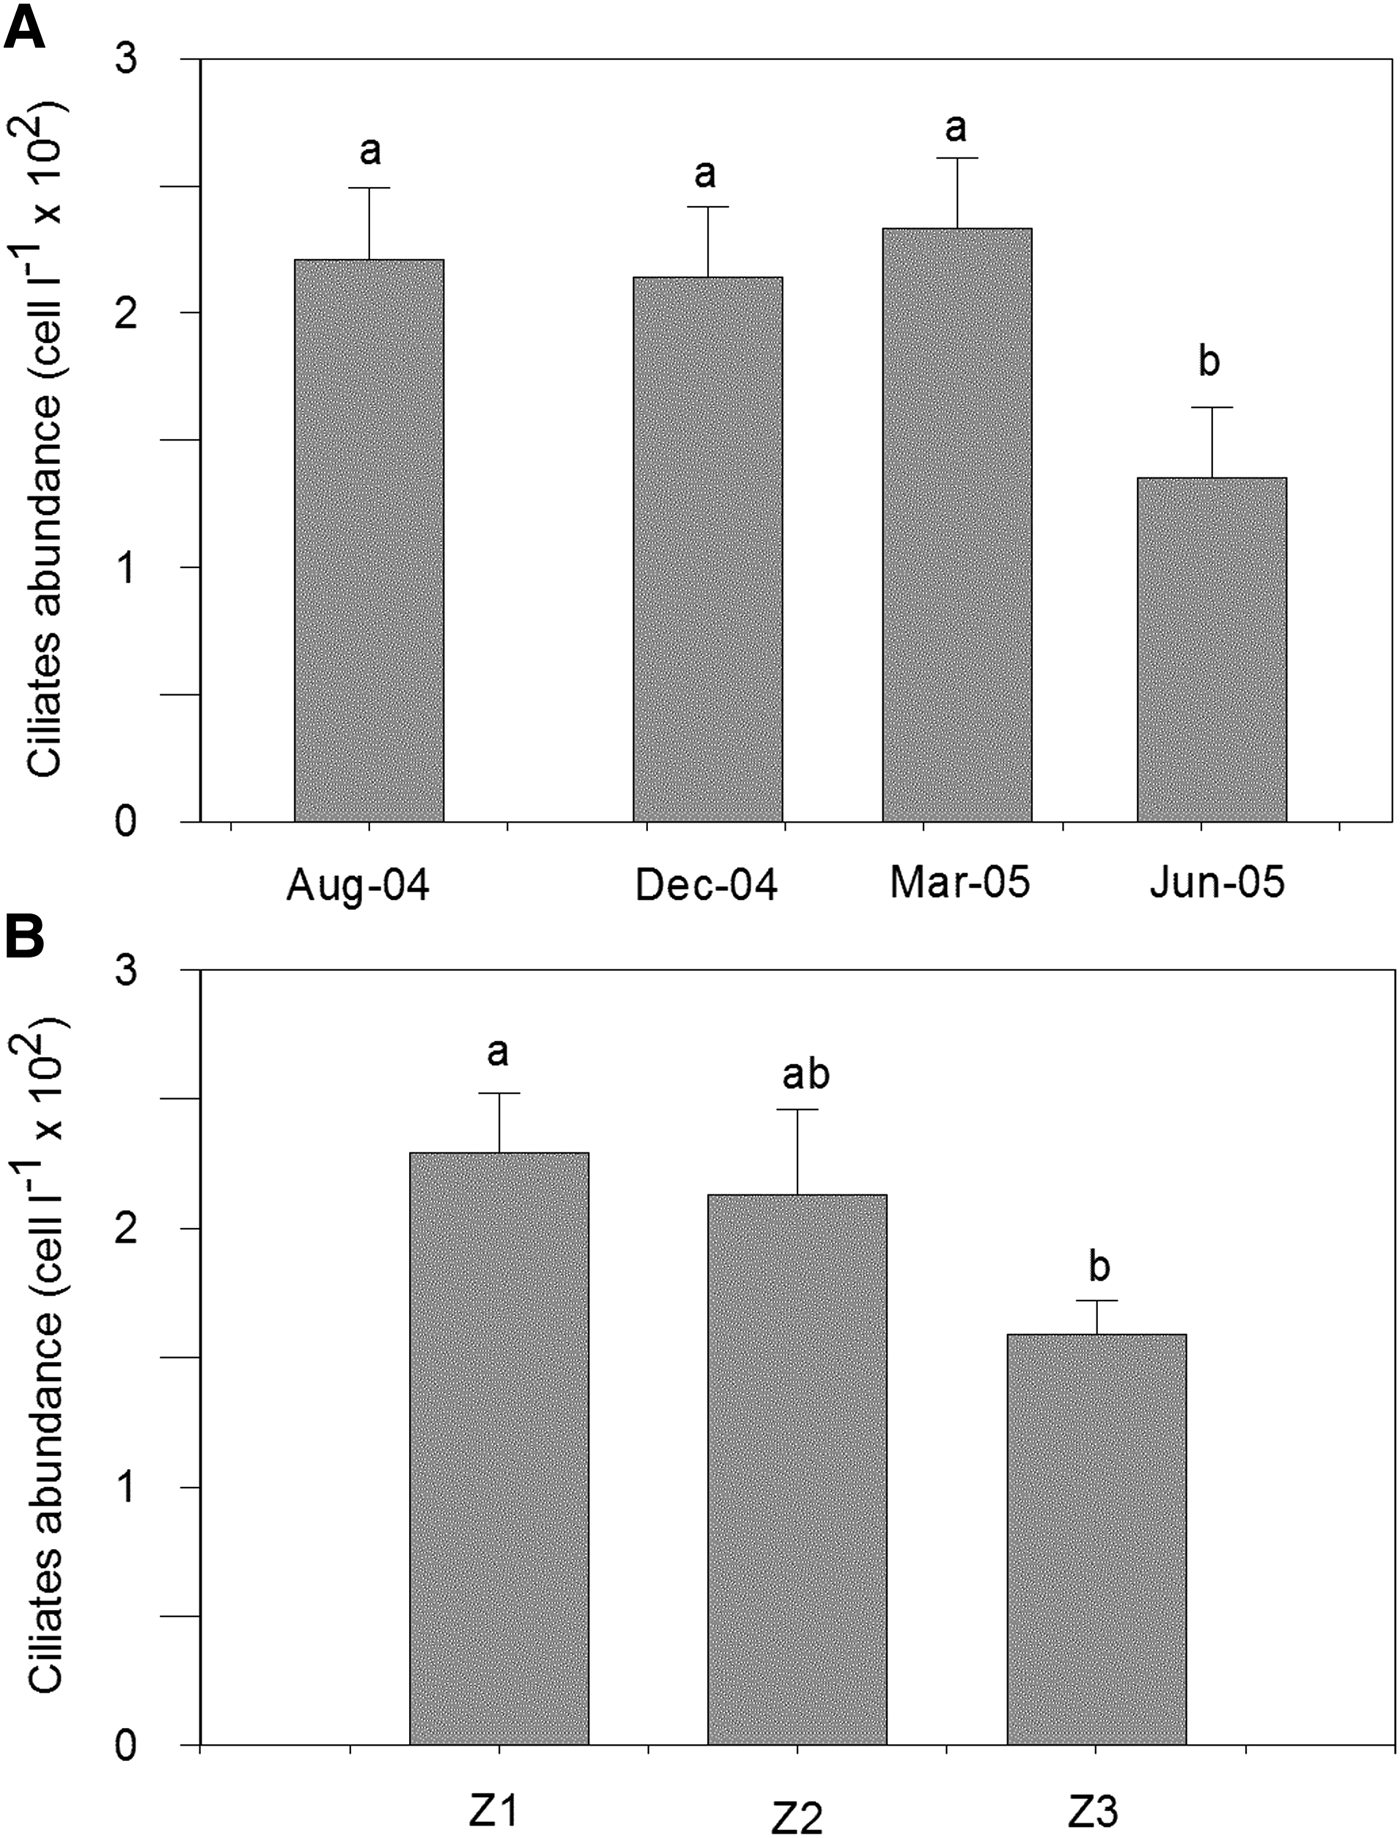
The highest mean value of the numerical abundance of ciliates for the three zones was registered during summer, following the chlorophyll-a trend (Figures 2 & 3), although the maximum value for the abundance of a species, Strombidium sp. 1 was 3760 ind. l−1 in winter in Z1. The minimum values were registered in autumn. The highest seasonal mean value of the numerical abundance of ciliates and chlorophyll-a were registered in Z1 (Figures 2 & 3).

Fig. 2. Hydrological and chlorophyll-a dynamics in Ushuaia and Golongrina Bays during the four surveys: (A) variation of temperature and salinity; (B) variation of chlorophyll-a. Bars show mean + SE. Mean values are presented alphabetically in decreasing order, those that share a letter do not differ at P = 0.05.

Fig. 3. Ciliates dynamics in Ushuaia and Golongrina Bays during the four surveys: (A) mean ciliates abundance in the different seasons; (B) mean ciliates abundance in the different zones. Bars show mean + SE. Mean values are presented alphabetically in decreasing order, those that share a letter do not differ at P = 0.05.
Spatial patterns of total ciliates biomass are summarized in Figure 4. The highest mean annual value was found in Station 7 (Z3). The maximum value of biomass registered was 41.2 µgC. l−1 in spring in Z3 and was due to tintinnids which possessed big loricae such as Eutintinnus rugosus.

Fig. 4. Mean seasonal biomass (µg C l−1) along the sampling stations in Ushuaia and Golondrina Bays.
Regarding to species contribution to the average similarity within zones (SIMPER analysis), the main contributing species to the similarity within each zone were Codonellopsis pusilla, Strombidium conicum and Srombidium sp. aff. reticulatum in Z1; Strombidium conicum, Srombidium sp. aff. reticulatum and Strombidium sulcatum in Z2; and Strombidium conicum, Srombidium sp. aff. reticulatum and Strombidium sp. 1 in Z3. The average similarity within each zone was 14.04, 27.57 and 16.64% for Z1, Z2 and Z3, respectively. The average dissimilarity among zones was mostly given by Strombidium conicum. The dissimilarity found between Z1 and Z3 was the highest (86.24%). However, the contrast was not statistically significant.
The ABC plot curves for the ciliates abundance–biomass comparison and W values are shown in Figure 5. The abundance curve lies above the biomass curve in the polluted area (Z1), while the opposite trend occurred in the unpolluted area (Z3). The curves were closely coincident in Z2 which showed a moderate pollution.

Fig. 5. K-dominance curves for ciliates abundance and biomass in the studied zones within the Ushuaia and Golondrina Bays: (A) Z1; (B) Z2; (C) Z3. a, abundance (solid triangles); b, biomass (circles); W, statistics (see text).
The frequency distribution of the correlation coefficients obtained after bootstrap resampling (1000 times) of microplankton variability and environmental variability is shown in Figure 6. The correlation was significant in the impacted zones, and changed to negative in the most polluted zone (Z1) to positive in the moderately polluted zone (Z2). In the less polluted zone (Z3), no correlation between microplankton and environment was found. The variance extracted from microplankton variability after PCA was 68, 81 and 65% for Z1, Z2 and Z3 respectively, while from environmental variability was 64, 64 and 54% for Z1, Z2 and Z3, respectively. The link between the ciliates and chlorophyll-a and environmental variability was only significant in the polluted zone (Z1), and the correlation between pairs was negative (r = −0.49; P = 0.05). The correlation between the mentioned pairs in the moderately polluted zone (Z2) was positive, although the results were not significant (r = 0.44; P = 0.28). No correlation was found in the unpolluted zone (Z3) during the studied period (r = −0.04; P = 0.80). The main contributors among zones to ciliates variability were the abundance, biomass and species richness. As for environmental variability, temperature, nitrate + nitrite and phosphate showed the highest scores (Figure 6).

Fig. 6. Correlation between ciliate community and chlorophyll-a and environmental variability in Ushuaia and Golondrina Bays. Left, density distribution of correlation coefficients estimated by Kernel smoothing techniques between the first PC (ciliates and chlorophyll-a) and environmental conditions in the studied zones (Z1, Z2 and Z3). Z1, r = −0.49; P = 0.05; mean = −0.49; SE = 0.18. Z2, r = 0.44; P = 0.28; mean = 0.44; SE = 0.24. Z3, r = −0.04; P = 0.80; mean = −0.04; SE = 0.15. Right, variable loading to the PC1 in the selected zones, the variables which contributed most to the total variance are indicated in bold.
DISCUSSION
Ciliates show high local diversity and are widely distributed, although a recent review made by Agatha (Reference Agatha2011) showed that ciliates diversity tend to be lower in the southern hemisphere. The author suggested that the southern diversity is actually underestimated as result of restricted sampling frequency. Our results help to reinforce the above mentioned hypothesis of misleading low southern diversity, given the high species diversity recorded in Ushuaia and Golondrina Bays (43 species).
Studies on the dynamics of planktonic ciliates and their importance in marine food webs have generally been conducted in temperate or tropical environments; however, several studies have highlighted the presence of conspicuous ciliate populations in cold and highly seasonal environments (e.g. Leakey et al., Reference Leakey, Fenton and Clarke1994). The number of ciliate species registered in the study area was similar to that found in some temperate coastal waters (Montagnes et al., Reference Montagnes, Lynn, Roff and Taylor1988; Dolan, Reference Dolan1991; Leakey et al., Reference Leakey, Burkill and Sleigh1992).
In this community, aloricate oligotrich ciliates dominated over tintinnids. The genus Strombidium predominated in the three zones; although the tintinnids had some importance in Z2, they were always more scarce. These results are in accordance with those from the Bering Sea and North Pacific in the northern hemisphere (42°N132°W 66°N 156° W) (Sorokin et al., Reference Sorokin, Sorokin and Mamaeva1996). Regarding the species composition of the three zones, eight species were found only in Z1, nine were present only in Z3 and only one species was unique to Z2. It is worth noting that those specific species of Z1 are also frequently found in other coastal areas of temperate regions (Balech, Reference Balech1948; Montagnes, et al., Reference Montagnes, Lynn, Roff and Taylor1988; Pettigrosso, Reference Pettigrosso2003; Pettigrosso & Popovich, Reference Pettigrosso and Popovich2009; Barría de Cao et al., Reference Barría de Cao, Beigt and Piccolo2005).
Ciliates abundance and biomass varied temporally and spatially. The highest abundance value was registered during the summer and the lowest in autumn. According to Gil et al. (Reference Gil, Torres, Amin and Esteves2010) the maximum values of phytoplankton biomass, temperature and solar radiation are registered during the summer, while the autumn is characterized by minimum values of nitrate and phosphate. During the summer, the most important relative contribution to the biomass of the phytoplankton is due mainly to diatoms of the genera Thalassiosira and Pseudo-nitzschia, dinoflagellates of the genus Scrippsiella and tiny unidentified phytoflagellates (Almandoz et al., Reference Almandoz, Hernando, Ferreyra, Schloss and Ferrario2011). We found that the abundance and biomass of ciliates were significantly dependent on chlorophyll-a concentration and also chlorophyll-a was negatively correlated with nitrate + nitrite and phosphate content. Concerning the spatial distribution of ciliates and taking into account the zones environmentally established by Gil et al. (Reference Gil, Torres, Amin and Esteves2010), the highest mean abundance was found in Z1. However, the highest mean value of carbon derived from ciliates was registered in a station located in the mouth of the Grande Stream, within the Z3, where the allocthonous NH+4 was the prevailing nutrient. Comparing the mean ciliate abundances found in the Beagle Channel with those in the northern hemisphere at approximately the same latitude, we found that our results were similar to those from Ito & Taniguchi (Reference Ito and Taniguchi2001) but one order of magnitude lower than those reported by Sorokin et al. (Reference Sorokin, Sorokin and Mamaeva1996).
From the point of view of the relationship between the ciliate community and the environmental quality and the stressing conditions within Ushuaia and Golondrina Bays, there was spatial variation in the community structure of ciliates that matches with the characteristics of seawater in the different zones delimited by Gil et al. (Reference Gil, Torres, Amin and Esteves2010) within the studied area. The greater dissimilarity was found between Z1 and Z3. The SIMPER analysis highlighted the relevance of Strombidium conicum as a key species in the planktonic community of the Beagle Channel, and thus this species should be taken into account for future ecological studies.
The sliding correlation analysis between environmental and planktonic variability was significant only in Z1. The higher environmental variability found at the disturbed Z1 favoured the presence of a diverse community of ciliates dominated by small and opportunistic species, tolerant to unpredictable changes in the water column. In Z3, the lack of correlation suggests that the ciliate community in this area was not mainly influenced by environmental changes; likely, it was influenced by specific intrinsic mechanisms and in a lesser extent by environmental conditions, which in addition showed lower variability than in Z1. This less stressed zone presented a community comprising a smaller number of bigger species, probably related to the more stable environmental conditions. An intermediate situation was found in Z2, denoting a transitional nature of this zone, as the community composition of ciliates found in this area was composed of species present in both Z1 as in Z3.
The results showed that the structure and composition of the ciliate community in the two bays of the Beagle Channel were tightly related to the environmental characteristics. Our findings clearly have shown how this pelagic community can be shaped by environmental conditions.
ACKNOWLEDGEMENTS
We thank Florencia Biancalana, José L. Esteves, Américo Torres, Miriam Solís, Alicia Nizovoy and Mónica Gil for their help during sampling and technical assistance in the laboratory tasks and Walter Melo for drawning the map. We also thank Laura Comoglio and Oscar Amín as well as the Direction of Centro Austral de Investigaciones Científicas (CADIC) CONICET at Ushuaia city, Tierra del Fuego, for the logistic support and facilities. Statistical advice provided by M. Sofía Dutto and Antonio Garayalde significantly improved the manuscript and is much appreciated.
FINANCIAL SUPPORT
The study was supported by CADIC, Centro Nacional Patagónico (CENPAT) and Instituto Argentino de Oceanografía (IADO), CONICET and the Agencia Nacional de Promoción Científica y Tecnológica (ANPCYT, FONCYT- PICT Redes 2006-090 to Dr J.L. Esteves).


