


1 INTRODUCTION
With annual maritime traffic of over 300,000 vessel movements including transit and local ships, the Strait of Istanbul (SOI) is one of the busiest waterways in the world. Combined with navigation hazards and a sensitive urban setting, navigation in the SOI poses a high risk to not only vessels and passengers but also to the city of Istanbul and its environment. Until the introduction of the Turkish Straits Maritime Traffic Regulation ((Figure 1), TSMTR 1998), safety was very much in the hands of individual sea captains, with very few hiring pilots to support navigation. The regulations imposed navigation rules including a separation scheme, right-side traffic and limitations for very large ships and ships with hazardous cargo. However, a real-time monitoring and navigation support service only started when the Turkish Straits Vessel Traffic Services (TSVTS) became operational in 2003. With an operations centre and eight unmanned radar stations located along the Strait, the system provides around-the-clock guidance by monitoring real-time traffic in the Turkish Straits, including the SOI, the Marmara Sea and the Strait of Çanakkale.
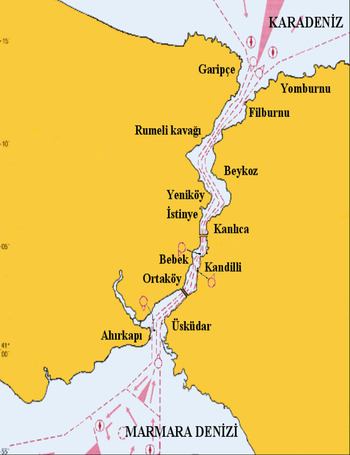
Figure 1. Traffic Separation Scheme in the Strait of Istanbul (TSMTR, 1998).
After adoption by the International Maritime Organization (IMO) in 2000, the Automatic Identification System (AIS) rapidly became part of standard shipborne electronics. With this technology, vessels transmit and receive information including their position, heading, size and cargo to other ships and coastal stations. With the extended capability of Satellite-AIS (S-AIS), vessel traffic information is available online for the entire world. Starting from 2005, the IMO required that all commercial vessels larger than 300 Gross Registered Tonnes (GRT) on international voyages, vessels larger than 500 GRT on domestic voyages and passenger vessels be equipped with AIS transceivers. In 2010, the Turkish Maritime Authority extended this regulation to all non-military vessels in Turkish waters, requiring vessels longer than 15 m or vessels with more than 12 people on board to have a broadcasting AIS device.
AIS data is widely used for analysing waterway traffic (HELCOM, 2011; Xiao et al., Reference Xiao, Ligteringen, Van Gulijk and Ale2015; Wu et al., 2016; Shu et al., Reference Shu, Daamen, Ligteringen and Hoogendorn2017). Long-term AIS data with a spatial coverage of an entire waterway was first used in the Baltic Sea (HELCOM, 2011). The HELCOM data was analysed for estimating navigation patterns, ship encounters and possible oil spills in the Baltic Sea (Gucma and Przywarty, Reference Gucma and Przywarty2008; Goerlandt et al., Reference Goerlandt, Montewka, Zhang and Kujala2017) and Norwegian waters (Gunnar Aarsæther and Moan, Reference Gunnar and Moan2009). Other studies used local or satellite AIS data to investigate maritime traffic at different locations and for different purposes. Favourable ship routes in the Yangtze Estuary, China (Zhang et al., Reference Zhang, Xiao and Yang2010), the Atlantic Coast of the US (Breithaupt et al., Reference Breithaupt, Copping, Tagestad and Whiting2017) and the Tawain Strait (Chen et al., Reference Chen, Lu and Peng2015) have been investigated. Marine traffic patterns and ship collision risk research off the Coast of Portugal (Silveira et al., Reference Silveira, Teixeira and Soares2013), collision probability at the entrance of Rotterdam Harbour, Netherlands (Mou et al., Reference Mou, van der Tak and Ligteringen2010), collision probability in the Strait of Messina (Cucinotta et al., Reference Cucinotta, Guglielmino and Sfravara2017), vessel traffic characteristics in the Singapore Strait (Meng et al., Reference Meng, Weng and Li2014), ship sinking frequencies in Madura Strait, Indonesia (Mulyadi et al., Reference Mulyadi, Kobayashi, Wakabayashi, Pitana and Wahyudi2014), accident risk in the Malacca Strait (Maimun et al., Reference Maimun, Nursyirman, Sian, Samad and Oladokun2013; Zaman et al., Reference Zaman, Kobayashi, Wakabayashi, Khanfir, Pitana and Maimun2013), near miss detection in Singapore port anchorages (Debnath and Chin, Reference Debnath and Chin2016) and Northern Baltic Sea (Zhang et al., Reference Zhang, Goerlandt, Kujala and Wang2016) and mapping of global shipping density (Wu et al., Reference Wu, Xu, Wang, Wang and Xu2016a) are all based on the analysis of AIS data.
Maritime traffic in the SOI, including accident locations, has been mapped by Kornhauser and Clark (Reference Kornhauser and Clark1995) using official paper logs and incident records. Before the availability of real-time electronic data, vessel traffic in the SOI was analysed with probabilistic models (Tan and Otay, Reference Tan and Otay1999; Otay and Özkan, Reference Otay and Özkan2003; Yazici and Otay, Reference Yazici and Otay2009). These models can mathematically estimate long-term vessel distributions and the expected accident frequencies based on statistics of transit vessels. Models helped to understand the statistical characteristics of the transit traffic. However, the detailed navigation patterns, especially of local traffic, remained unknown. The first attempt to use AIS data for traffic analysis in the SOI was based on a two-day visual assessment of AIS tracks at the Southern entrance of the SOI (Aydogdu et al., Reference Aydogdu, Yurtoren, Park and Park2012).
The present study is an attempt to close an important gap in accurate traffic data analysis for the SOI. For this purpose, AIS messages have been collected, stored and analysed continuously over a period of one year within the entire SOI (Altan, Reference Altan2016). Using data mining techniques, instantaneous AIS messages from local and transit vessels at random bursts are analysed to find vessel distributions at specified check-lines along the SOI. Multiple messages from the same vessels are combined to calculate individual voyages and identified as local or transit traffic using the reported Maritime Mobile Service Identity (MMSI) and IMO numbers. Vessel-specific information including ship type, Length Overall (LOA), beam, draught, Speed Over Ground (SOG), Course Over Ground, (COG) and heading are analysed. Their distributions are found at different locations along the SOI.
2 PROBLEM DEFINITION
Although the navigational complexity of the Strait of Istanbul is accepted by the authorities, up to now it has never been revealed by means of long-term spatial data. Figure 2 shows the navigational complexity of local and transit traffic routes. Use of AIS data for finding navigational characteristics has proved itself in past studies (HELCOM, 2011; Meng, et al., Reference Meng, Weng and Li2014; Xiao et al., Reference Xiao, Ligteringen, Van Gulijk and Ale2015; Wu et al., Reference Wu, Mehta, Zaloom and Craig2016b; Wu et al., Reference Wu, Xu, Wang, Wang and Xu2016a; Shu et. al., 2017).

Figure 2. Representative sketch of transit and local traffic in the SOI.
The results of this study reveal some navigational characteristics of the SOI. These characteristics can supply the necessary input to assist in calculating maritime collision probability (as ship density, ship dimensions and course over ground), and assist officers, captains, stakeholders and scientists to understand the navigational behaviour of ships and ship captains along the SOI.
3 AIS DATA IN THE STRAIT OF ISTANBUL
3.1 Source of Data
The Automatic Identification System (AIS) provides navigation-related information as National Marine Electronics Association (NMEA) sentences via Very High Frequency (VHF) radio. When NMEA sentences are parsed, AIS messages related to navigation are obtained. The source of the navigation-related messages can be ship-based or shore-based and messages can be received by ships, coastal stations and satellites over AIS devices.
There are 27 different types of AIS messages. Type 1, 2, 3 and 5 messages transmitting maritime traffic information are included in the analysis (Table 1). The first three types are the dynamic messages carrying automatically updated position and motion information of a ship. Type 5 messages include static data describing the vessel type and dimensions.
Table 1. Variables used in the Strait of Istanbul traffic analysis.

For the Strait of Istanbul, approximately 1·7 million of NMEA sentences are recorded daily. 1 million of them are Type 1, 2, 3 messages and 50,000 of them are Type 5 messages. NMEA sentences are recorded, parsed and stored in the SQL database. Total parsed data size for the SOI is about 94 Gigabytes (GB). Size of the Type 1, 2, 3 messages is 86 GB and Type 5 messages is 8 GB.
3.2 Methodology
The study has two main problems to overcome, the first is to manage the large amount of data and the second is to organise the data in a meaningful structure so that traffic can be analysed.
For managing the data, a grid-based data analysis method has been used. In the applied method, the observed area is divided into grids which are called sectors. Data at the entrance and the exit of the sectors are analysed to find the traffic characteristics of the area. A key factor for gridding is the size of the sectors. As the size of the sectors decreases, resolution of the traffic increases but computational complexity for analysis increases. For an optimum solution, a minimal change in the navigational pattern constraints is applied, so that inside a sector, the navigation pattern of ships can be assumed as constant. For the SOI, transit traffic waterway border points are used for determining the sectors. These points are determined from the Turkish Straits Maritime Traffic Order Rule prepared by the Turkish Republic of Ministry of Transportation, Maritime and Communication in 1998 and they are located according to change of manoeuvre points. As shown in Figure 3, 13 sectors with minimal change of navigation patterns are created in the SOI. Data at the entrance and exit of the sectors are used for the analysis.

Figure 3. Sectors along the Strait of Istanbul.
The second step is to organise the data in a meaningful structure. AIS data is transmitted in an order determined by the self-organising network the vessels are currently in, but to a receiving station, this order can appear random, and therefore post processing is essential for analysing maritime traffic. Since the data cannot be obtained exactly at the entrance and the exit of the sectors, a minimum distance zone to a sector line is set as 110 m which is determined according to average speed and AIS message frequency. If a ship is inside the minimum distance zone, it is assumed that the ship is about to enter or exit from the sector. Data inside the minimum distance zone is used for the ship's distance to sector border line and is calculated and sorted. One ship can send more than one data set inside the minimum distance zone. Therefore, the one with the least distance is recorded as ship's information at the sector border. According to the associated sector's border line direction and ship's course over ground, the traveling direction of the ship is found. Time stamps are used to verify the entrance of the ship into the sector. Dynamic and static messages are combined by using the MMSI, which should be unique for each ship. The database is filtered for error MMSI messages (e.g. 9999, 100000, 8888, etc.). Duplicate MMSI usage is not deleted from the database. In order to eliminate duplicate MMSI usage errors, time stamps are used. If two ships are using the same MMSI, their static message is combined with the dynamic message according to message time stamp.
All the parameters are analysed through the sectors, except the ship type and dimensions. Since the type and the dimension of the ships do not change through the Strait, they are only analysed at the south and north entry.
4 RESULTS
4.1 Numbers of Ships
The analysis of the numbers of ships has two important outcomes for traffic analysis. One of them is the usage and traffic density of the area. The other is the ability to check the data with the reports. According to Ministry of Turkish Transportation Maritime and Communication data, 43,745 ships used the SOI over a one-year period (from September 2014 to August 2015). The AIS-measured number of ships for the same period is 45,062. The difference comes from the domestic lines that are departing inside the SOI. 45,062 ships navigate at the south entry; 22,168 of them are northbound ships and 22,894 of them are southbound ships. When ships at the north entry are analysed, 39,513 ships have been observed. Northbound and southbound ships are 18,830 and 20,683, respectively. Overall results are shown in Table 2.
Table 2. Variables used in the Strait of Istanbul traffic analysis.

In order to find the number of transit ship passages, entering and exiting ships are tracked. After the analysis, 37,880 transit ships were found. The numbers of northbound and southbound ships are 18,463 and 19,417, respectively. The numbers for the transit traffic are different to the ministry data. The reason for this are the ports that are located in Sector 1 and 2. Yearly cross traffic of the Strait is 271,439. This number includes the passenger-type ships that are navigating between the European and Asian sides of Istanbul. In order to show the monthly distribution of the transit ship traffic along the SOI, the monthly number of ship passages from 2012-2016 is given in Figure 4. According to the data, the number of ship passages throughout the year show no peak values. However, in the winter (December, January and February), the number of ship passages shows a drop of about 6% with respect to the average for the year.

Figure 4. Monthly Number of Ship Passages between 2012–2016.
Figure 5(a) shows the number of ship passages through the sectors. There are four entrances to each sector, their names are given according to their travel directions. The number of ships in the north-south direction fluctuates between 47,000 and 42,000 according to sectors. The cause of the fluctuation is the local ships travelling in the transit direction at the given sectors. Cross traffic varies between 35,000 and 0 ships annually. This result is directly related to the location of the piers for local traffic. Sector 3 has the highest cross traffic and Sector 12 has the lowest cross traffic.

Figure 5. Ship passages in sectors (a) and the traffic density map (b) of the SOI.
Figure 5(a) also gives the total number of ships and comparison of transits and crossing traffic in the sectors. In all the sectors, transit usage is more than the crossing usage. This figure gives the idea that transiting ships are higher in number in the SOI. But usage of transit direction is mostly generated by the same ships (transit traffic), and cross direction usage is generated by different ships which increase the number of ships in the cross direction.
The annual number of ship passages and the ship density, defined as the number of ships entering the sector per hour per nautical mile square, are given in Figure 5(b). Sector 3 and Sector 12 are the most and least congested sectors, respectively. In terms of ship density, Sectors 2 and 3 have the most and least dense traffic respectively. Due to its large coverage area, Sector 3 has the highest number of ships and the least dense traffic.
4.2 Ship Type
The Strait of Istanbul hosts both local and transit traffic. In the number of ships section, the amount of local traffic is shown by the eastbound and westbound traffic. In this section, ship type results, from the AIS data at both entrances of the SOI are given. Ship types are classified and plotted in Figure 6 based on the ship types found in the AIS message set. The most common ships are cargo ships and tankers according to Figure 6. Pilot vessels and passenger ships are mostly observed at the southern entry. The number of high-speed craft in the SOI is very low. These high-speed vessels enter from the south and do not pass into the Black Sea. Therefore, they cannot be observed at the northern entry or exit.

Figure 6. Yearly ship type distribution.
4.3 Ship Dimensions
Statistical distributions of ship dimensions are analysed for vessels entering and exiting from the southern and northern sectors (Figure 7). For LOA, beam and draught, the threshold/interval values are 10 m/20 m, 5 m/5 m, and 1 m/3 m respectively. A histogram of vessel lengths (Figure 7(a)) shows that the most common LOA is 90–110 m. The number of vessels entering or exiting at either side of the SOI are very similar except for vessels smaller than 50 m, 90% of which enter and exit from the south without transiting the SOI. This uneven geographic distribution of smaller ships is caused by the local traffic crossing the SOI especially at the southernmost sector where the city centre is located. Vessel beams can be grouped into three where the most common beams are between 10–20 m (Figure 7(b)) followed by 20–35 m.

Figure 7. Yearly ship dimension distribution.
Although draught values in the AIS data are not very consistent, because of the large sample space, it is assumed as a reliable parameter. The draught distributions (Figure 7(c)) show a peak value of northbound ships at 4 m followed by a sharp decrease for larger drafts. However, for the southbound ships, the peak is in the 4–7 m range. In the southbound direction, ships with 7 m and larger draught are more common than for the northbound ships. This means that the southbound ships are more loaded than the northbound ships and that there is a net transfer of goods southward from the Black Sea to the Marmara Sea. Also at the southern entry, the number of ships with the a draught up to 10 m is higher. This is because of the Haydarpasa and Galata Ports which are located at the southernmost sector of the SOI.
4.4 Speed Over Ground (SOG)
The SOG values are analysed at one knot intervals and two knots is the threshold value in Figure 8. At the southern entry, the peak value for the northbound direction is 8–9 knots and for the southbound direction, the peak value is 11 knots. Both directions show a skewed normal distribution. The main cause of the speed difference between the southbound and northbound directions is the predominant surface current in a southward direction. Another reason is that the speed limit for the ships exiting from the SOI is not enforced. At the northern entry, the peak value for the southbound ships is 8 knots and for the northbound ships is 11 knots. The main reason for the speed difference between the directions is that southbound ships are coming from mooring places and they cannot reach the transit speeds and northbound ships leave the SOI after the northern sector and speed is not restricted.

Figure 8. Yearly speed over ground (SOG) distribution.
Figure 9 shows the SOG behaviour and deviation from the speed limit, which is enforced as 10 knots within the SOI. However, for manoeuvre purposes, captains are allowed to increase their speed. The average SOG of southbound ships is higher compared to the northbound ships except at the northern sector (Sector 13). The predominantly southward current direction in the SOI is the main reason for the higher SOG of southbound ships. To maintain a safe Speed Through Water (STW), southbound ships occasionally increase their SOG to gain more rudder control.

Figure 9. Average SOG through sectors.
4.5 Course Over Ground (COG) and Heading (HDG)
The directional probability distributions of Course Over Ground (COG) and Heading (HDG) are shown in Figures 10 and 11 respectively. The results revealed important details about the navigation patterns of north, south, east and west-bound ships in the 13 sectors within the SOI. According to Figures 10 and 11, HDG and COG values at the southern and northern entries show similar patterns for both northbound and southbound directions. This shows that the cross current effect on ships is very limited and ships do not change course while entering and leaving the Strait.

Figure 10. Directional probability distribution of Course Over Ground (COG).
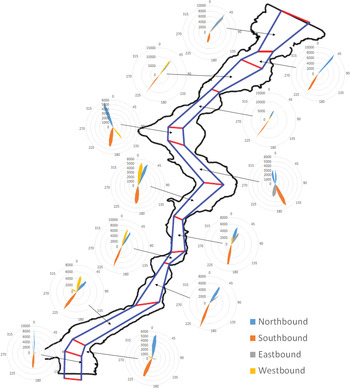
Figure 11. Directional probability distribution of Heading (HDG).
The large deviation between the COG and HDG values in Figures 10 and 11 are due to cross currents in particular sectors. When the two figures are compared with each other, the most affected sectors from cross current are found to be Sectors 5, 8 and 9. Cross currents due to sharp turns in these sectors may adversely impact the cross traffic.
Analysis further shows that the course for southbound vessels is 1850 as they exit to the Marmara Sea until they reach the separation buoy, located 1 nm South of the exit, and then navigate westwards to the Dardanelles. Northbound ships at the southern entrance sail on a course of 0000 to enter the SOI. At the northern exit, ships hold course on 0400 which is the preferred travel direction after exiting the SOI; at the northern entry, incoming ships sail on 2000 to enter the SOI.
5 SUMMARY AND CONCLUSION
Once the data management issues are overcome, long-term AIS data are a valuable resource for maritime traffic analysis. This is especially evident in narrow and congested waterways like the SOI, long-term traffic analysis can help to understand the complexities of navigation patterns and consequently be used to improve maritime safety. In the present study, approximately 1·5 billion AIS messages collected continuously over one year were analysed to study both the transit and the local traffic in the SOI. Using a database program, instantaneous records of position, type, dimension, heading, speed and course over ground were analysed in 13 sectors within the SOI. The traffic in the SOI is categorised as north, south, east and west-bound. The northbound and southbound vessels make up the transit traffic whereas the eastbound and westbound traffic is due to local vessels which cross the Strait between the European and Asian coasts. Out of 309,312 total ship movements encountered in the SOI, only 12% (37,880 vessels) are found to be transit traffic and the remaining 88% is local crossing traffic. Although it has frequently been neglected in the past, the ratio of local traffic to transit traffic is found to be 8:1. Especially for accident analysis where ship encounters are important, the local traffic is quite critical and must be included.
Statistical distributions of ship types show that cargo ships are the most common ship type in the SOI, followed by tankers. For different ship types, their direction of travel and relative position between the northern and southern sectors are approximately equal except for the pilot vessels and passenger ships. Because of ports in close proximity, these vessels travel in the southern part of the SOI. LOA and beam distributions indicate that small vessels stay mainly in the southern sectors. Statistical analysis of vessel lengths in the SOI indicates a double peak distribution where the most expected LOA is 100 m followed by 170 m. Draught analysis showed a net transfer of goods from north to south.
According to SOG distributions, ships navigate at speeds between
 $7{\cdot}5\hbox{-}12{\cdot}5$
knots. Southbound vessels are found more likely to exceed the enforced speed limit of 10 knots due to predominantly southwards flowing currents in the SOI. Ships accelerate as they exit the Strait at both exits as the speed limits are not enforced in the open sea. On the other hand, vessels enter the SOI at lower speeds as they usually depart from a nearby anchorage area. Cross currents at sharp turns along the SOI adversely affect ships’ manoeuvre. In Sectors 5, 8 and 9, headings deviate significantly from COGs, indicating that ships are exposed to cross currents. In terms of navigation, cross currents in these sectors are more important than the transverse current.
$7{\cdot}5\hbox{-}12{\cdot}5$
knots. Southbound vessels are found more likely to exceed the enforced speed limit of 10 knots due to predominantly southwards flowing currents in the SOI. Ships accelerate as they exit the Strait at both exits as the speed limits are not enforced in the open sea. On the other hand, vessels enter the SOI at lower speeds as they usually depart from a nearby anchorage area. Cross currents at sharp turns along the SOI adversely affect ships’ manoeuvre. In Sectors 5, 8 and 9, headings deviate significantly from COGs, indicating that ships are exposed to cross currents. In terms of navigation, cross currents in these sectors are more important than the transverse current.
The navigational complexity of maritime traffic is presented by using the long-term AIS data. The obtained results have helped to understand the navigation patterns of ships and their characteristics within different sectors of the SOI. Traffic density maps based on AIS data show geographic variations along the SOI. Traffic congestion at certain sectors are caused by non-uniform distribution of local traffic along the sectors and the non-uniform geometry of the SOI. The southern sectors have a denser maritime traffic because of heavier local traffic. Although the congestion and cross current effects are known for the SOI, it has been quantified by the results of the analysis. As future work, navigational characteristics of the ships can be associated with weather effects such as wind, visibility and current. This will help to find the relationship between the weather parameters and navigational characteristics of the Strait. The relationships may provide the necessary input to accurately predict the maritime risk in the SOI.


