INTRODUCTION
Salt-affected soils (both saline soils and saline-sodic soils) are widely distributed in more than 100 countries covering regions all over the world except Antarctica (Szabolcs Reference Szabolcs and Pessarakli1994; Khan et al. Reference Khan, Jan, Khan, Arif and Shafi2010). According to the FAO/UNESCO Soil Map of the world (Martinez-Beltran & Manzur Reference Martinez-Beltran and Manzur2005), the total global area of salt-affected soils is 831 million ha, which includes 397 million ha of saline soils and 434 million ha of sodic soils (Rengasamy Reference Rengasamy2006). Increased soil salinity and sodicity are two of the primary abiotic stresses for crop production and have resulted in severe negative economic consequences (Ondrasek et al. Reference Ondrasek, Rengel, Veres, Shanker and Venkateswarlu2011). It is estimated that the annual rate of loss of agricultural lands by salinization and alkalinization is c. 1·5 million ha, and so far c. 77 million ha of agricultural lands have been degraded by soil salinization (Eynard et al. Reference Eynard, Lal, Wiebe and Lal2006). With the increasing world population, food production and supply must be increased. If per capita food supply to the growing world population is to be maintained at current levels, global food production would need to be increased by 38% by 2025 and by 57% by 2050 (Wild Reference Wild2003). Therefore, improving poor quality lands so that they can be turned into arable lands is a necessary and feasible approach for increasing food production complementing the projected increase in crop yields per unit area.
Salt-affected soils can be important and valuable land resources, with appropriate agronomical management. Planting rice (Oryza sativa L.) is a successful example of the biological improvement of salt-affected soils, especially in saline-sodic soils (Dahiya et al. Reference Dahiya, Malik and Singh1982; Maianu Reference Maianu1984; Chi et al. Reference Chi, Zhao, Sun and Wang2012).
The Western Songnen Plain is one of the five largest salt-affected soil regions in China and also has the largest distribution of saline-sodic soils in China (Yu & Cheng Reference Yu and Cheng1991). The total area of saline-sodic soils in Northeast of China has reached 3·42 million ha (Song et al. Reference Song, He, Deng, Song, He and Deng2003; Wang et al. Reference Wang, Li, Li, Song and Zhang2003), mainly located in the western portion of Jilin and Heilongjiang Provinces, with soil pH ranging from 7·02 to 10·16 and sodium adsorption ratio from 0·10 to 197 (mmolc/l)1/2 (Chi & Wang Reference Chi and Wang2010; Chi et al. Reference Chi, Zhao, Sun and Wang2012). Rice has been planted since the 1950s in saline-sodic soils of the Western Songnen Plain of China. At the beginning of the 21st century, the area of saline-sodic paddy fields had reached 0·8 million ha, accounting for 48·6% of the total area of paddy fields in the region, but these paddy fields usually belonged to slightly saline-sodic soils where soil pH is only between 8·5 and 9·0 and the average yield of rice was up to 7500 kg/ha (Wang Reference Wang2002). In recent years, a project for planting of rice to ameliorate moderate or severe saline-sodic soils (with soil pH of >9·0, in general) has been launched by the Chinese government. Approximately 0·3 million ha of moderate or severe saline-sodic soils has been reclaimed into paddy fields, hence the total area of saline-sodic paddy fields has increased rapidly.
Rice yield in the saline-sodic paddy fields is usually <5000 kg/ha, thus low rice yield has been an obstacle for farmers utilizing these fields. Abbas et al. (Reference Abbas, Quraishi and Chughtai1994) pointed out that salt-affected soils have decreased crop productivity at the global scale, but that these soils could be made more productive by leaching or application of amendments. This could be achieved with the use of good quality water in the case of saline soils and application of gypsum and sulphuric acid in the case of sodic and saline-sodic soil (Abbas et al. Reference Abbas, Quraishi and Chughtai1994). Rice is considered quite sensitive to salinity (Maas & Hoffman Reference Maas and Hoffman1977; Shannon et al. Reference Shannon, Rhoades, Draper, Scardaci and Spyres1998; Zeng & Shannon Reference Zeng and Shannon2000) but moderately tolerant to sodicity (Pearson Reference Pearson1960; Ayers & Westcott Reference Ayers and Westcott1989). However, it is known that plants in general also help in the reclamation of salt-affected soils. Plant roots release organic compounds and complex energy sources (Dormaar Reference Dormaar1988), increase partial pressure of carbon dioxide (CO2) (Qadir et al. Reference Qadir, Qureshi, Ahmad and Ilyas1996) and decrease soil pH (Mashli Reference Mashli and Choukr-Allah1991). Putting all these factors together would help increase dissolution of calcium carbonate (CaCO3) in the soil and, with time, lead to a decrease in soil salinity/sodicity (Sadiq et al. Reference Sadiq, Hassan, Mehdi, Hussain and Jamil2007). Therefore, rice cropping has been recommended to progressively remove salinity and sodicity (Obrejanu & Sandu Reference Obrejanu, Sandu and Szabolcs1971).
Paddy rice can be effectively cropped during reclamation of sodic soils, probably because the water on the fields limits the negative effects of degraded soil structure on the plants. Meanwhile, the shallow root system of rice makes this plant less sensitive to high contents of exchangeable sodium (Na) in the sub-soil (Abrol & Bhumbla Reference Abrol and Bhumbla1979); thus it was commonly believed that high rice yields would be obtained as long as there was enough water for irrigation, coupled with adequate fertilizer application. However, there are many environmental factors which interact with salt contamination, such as soil pH and nutrient deficiency in saline-sodic soil (James et al. Reference James, Tiller and Richards2005; Kopittke & Menzies Reference Kopittke and Menzies2005). Management and reclamation of salt-affected soils requires a combination of agronomic practices, including cultivation, fertilization and irrigation, among others (Eynard et al. Reference Eynard, Lal, Wiebe and Lal2006). Shaaban et al. (Reference Shaaban, Abid and Abou-Shanab2013a, Reference Shaaban, Abid and Pengb) observed that combined application of organic and inorganic amendments played a significant role in improving the properties of salt-affected soils under a rice paddy system. Yasin et al. (Reference Yasin, Rauf and Sarfraz1987) found that soil electrical conductivity (EC) increased with increasing EC of irrigation water. Irrigation with sodic waters high in carbonates and bicarbonates led to an increase in soil pH and exchangeable sodium percentage, with a related decrease in aeration and permeability due to clay dispersion and surface soil crusting, and clay migration clogging of pores (Grattan & Oster Reference Grattan, Oster, Goyal, Sharma and Rains2003; Levy et al. Reference Levy, Mamedov and Goldstein2003; Oster Reference Oster and Pandey2004). In addition, chemical amendment application and subsequent drainage with high electrolyte concentration might also bring adverse effects for environmental protection (Qadir & Oster Reference Qadir and Oster2004; Qadir et al. Reference Qadir, Noble, Schubert, Thomas and Arslan2006). Therefore, monitoring the change of soil salinity and major nutrients such as nitrogen (N) is very important for the environmental health of the Western Songnen Plain in Northeast of China.
The objectives of the current study were: (1) to identify the changes of soil salinity, pH and N contents with cultivation over time and different N application levels; (2) to examine the effects of irrigation and drainage on soil salinity and soil N contents.
MATERIALS AND METHODS
Study site
The study site was located at the Da′an Sodic Land Experiment Station (DASLES, 45°35′58″ to 45°36′28″N, 123°50′27″ to 123°51′31″E, 150–200 m a.s.l.), which was situated in Da′an city in Jilin Province, China, and associated with the Chinese Academy of Sciences (Fig. 1). The DASLES had a distribution of typical saline-sodic soils of the hinterland in Songnen Plain. The climate was semi-arid and temperate continental, with a mean annual temperature of 4·3 °C, varying from –20 °C in January to 26 °C in July, mean annual rainfall of 410 mm and evaporation of 1750 mm.

Fig. 1. Location of the study site, Da'an city of Jilin, China (based on Map data ©2013 Google Map IT). (a) Paddy field area which was irrigated with groundwater and reclaimed for 6 years or 9 years; (b) paddy field area which was irrigated with river water and reclaimed for 1 year or 3 years.
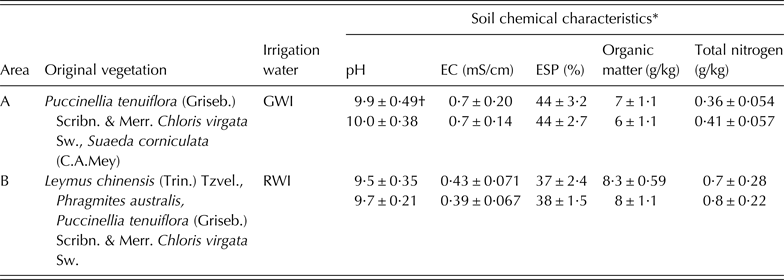
The original vegetation was natural grassland dominated by Leymus chinensis (Trin.) Tzvel., Phragmites australis, Puccinellia tenuiflora (Griseb.) Scribn. & Merr. Chloris virgata Sw., Suaeda corniculata (C.A.Mey) etc. The grassland had been degraded due to soil salinization. The region designated as zone A (6 ha) in Fig. 1 was reclaimed into paddy fields in 2003 and 2006 by irrigation with groundwater according to the local farming practice. The region designated as zone B (10 ha) in Fig. 1 was also reclaimed into paddy fields in 2009 and 2011 by irrigation with river water, diverted from the Nenjiang River. The main original characteristics of soils in zones A and B are shown in Table 1. Zones A and B were areas which had different soil characteristics and irrigation water sources, thus regarded as two independent experimental areas, as shown in Table 1.
Table 1. A summary of vegetation and soil chemical characteristics before paddy fields were cultivated in saline-sodic grassland in Songnen Plain of Northeastern China

EC, electrical conductivity; ESP, exchangeable sodium percentage; GWI: groundwater irrigation; RWI: river water irrigation.
* pH and EC were determined in soil: water = 1 : 5, ESP was calculated by soil exchangeable sodium and cation exchange capacity (CEC).
† Data expressed as means ± s.e.
Experimental design
In the current study, Observational Study 1 refers to paddy fields cropped for 9 years (started in 2003) and 6 years (started in 2006), located in zone A and irrigated with groundwater. Observational Study 2 refers to paddy fields cropped for 3 years (started in 2009) and 1 year (started in 2011), located in zone B and irrigated with river water. All paddy fields in Observational Studies 1 and 2 were rectangular with an area of 1000 m2 (40 × 25 m2), with individual (separate) irrigation and drainage systems, and the cultivation and fertilization were the same. Three 1000 m2 rectangles for each cultivation year were selected randomly as three repetitions of the observational study.
Experiment 3 refers to the experiment of N application rates. It was based on a long-term fertility experiment with four different N application rates, started in 2009 and continued for 3 years. The experiment was conducted in 12 plots which had the same cultivation years (9 years) located in zone A. The area of each plot was 20 m2, each N level treatment was allocated randomly and conducted three times. Plots were irrigated with groundwater, having separate irrigation and drainage systems. The N treatment rates were 0 (no N applied, as control), 100, 200 and 300 kg N/ha per year, labelled as N0, N1, N2 and N3, respectively. One hundred kg phosphorus pentoxide (P2O5) and 100 kg potassium oxide (K2O) were applied per hectare per year as basal fertilizer for 12 experimental plots.
During the growing period, rice was continuously flooded, with irrigation water level maintained at 5–10 cm deep, depending on the changes in rainfall and rice growth.
Soil sampling
Soil samples were collected twice from the paddy fields in each of the 4 cultivation years and from the plots with four N application treatments, at the end of April and the end of November, 2011. Three composite samples were taken randomly from paddy fields of each cultivation year and all plots of N application treatments. Samples were composites of five soil cores in each field of 1000 m2 area and three soil cores in each plot of 20 m2 area. The 100 cm-deep sample cores were divided into 0–20, 20–40, 40–60, 60–80, 80–100 cm depth increments. Samples were passed through a 2 mm sieve and a portion of each sieved sample was stored at 4 °C for subsequent analysis of mineral N (ammonium nitrogen (NH4+-N) plus nitrate nitrogen (NO3−-N)). The remaining portion was air-dried for analysis of total N, pH, EC and soluble ions.
Water sampling
Rice was transplanted on 1 June and irrigation was stopped on 30 September 2011 to enable field drying. Paired water metres were installed in the inlet and the outlet of paddy fields before cultivating rice, to monitor water quantities of irrigation and drainage. In addition, three pairs of water metres were installed in the paddy field with ground water irrigation (GWI), and another three pairs of water metres were installed in the paddy field with river water irrigation (RWI). Water samples (500 ml) were collected once every 2 weeks from the inlet and the outlet. The rainfall data during the rice growing season was collected from the DASLES weather station, and rain samples (if available) were collected every 2 weeks. All water samples were filtered with Whatman No. 40 filter paper, and then stored in a refrigerator at 4–5 °C and analysed for pH, EC, the main salt ions and NH4+-N, NO3−-N and total N concentrations in the water within 7 days.
Chemical analysis
Field-moist soil samples were analysed for inorganic N (NH4+-N and NO3−-N) within a few days of sieving in duplicate. Fresh soil samples were weighed and extracted with calcium chloride solution of 0·01 mol/l for 1 h, then analysed for inorganic N in the filtrates using a Continuous Flow Analyser (Alliance Instruments, Frépillon, France). Soil moisture, pH (soil-water ratio of 1 : 5), EC (soil-water ratio of 1 : 5), and total N (by Kjeldahl procedure) were measured. Water samples were removed from the refrigerator and placed at room temperature for 2 h, and then were analysed for pH using a CyberScan pH510 pH metre (Eutech Instruments Pte. Ltd., Singapore), and for EC using a DDS 11AW conductivity metre (Hangzhou Huier Instrument Equipment Co. Ltd., Hangzhou, China and Japan), respectively. The concentrations of Ca2+ and Mg2+ in water samples were analysed with AA-6300 Atomic Absorption Spectrophotometer (Shimadzu, Shanghai, Japan). The concentrations of K+ and Na+ in water samples were analysed with FP6410 Flame photometer (Shanghai Precision & Scientific Instrument Co. Ltd., Shanghai, China). The concentrations of chlorine (Cl−), sulphate (SO42−), carbonate (CO32−) and bicarbonate (HCO3−) in water samples were analysed with WDDY-2008 Potentiometric Titrator (Datang Analysis Instrument Co. Ltd., Taizhou, China). The concentrations of NH4+-N, NO3−-N and total N in water samples were analysed with FUTURA Continuous Flow Analyser (Alliance Instruments, Frépillon, France).
Statistical analysis
Means and standard errors were calculated using the SPSS 16·0 for Windows software package (SPSS Inc., Chicago, IL, USA). The data were reported as mean ± standard error of the mean (s.e.m.). In Observational Studies 1 and 2 and in Experiment 3, soil pH and EC at different depths on the same plots suitable for analysis with repeated-measures in space were subjected to a repeated-measures analysis of variance (ANOVA) between 1 cultivation year and 3 cultivation years, between 6 cultivation years and 9 cultivation years, and between N application rates and soil depths, respectively. The data were tested through their independence, normally distributed and homogeneity of variance, and they were suitable for analysis with general linear model with repeated measures. Firstly, Mauchly's test of Sphericity Assumption was conducted on the data. The results showed that P < 0·05 and the data were not suitable for Sphericity Assumption, so then multivariate tests or F-test of ANOVA (Geisser–Greenhouse or Huynh–Feldt) were conducted. The results of the statistical analyses were tabulated with tests of within-subjects effects, tests of within-subjects contrasts and tests of between-subjects effects and the linear model or quadratic model fitted. Soil N concentrations were subjected to repeated-measures ANOVA and a quadratic regression analysis, and the results of statistical analysis were drawn as graphs. Correlation analysis was used for the concentrations of N and N application rates, and the correlation coefficient r was reported with 95% confidence (P < 0·05). The graphs were generated using Microsoft Excel 2003, and the s.e.m. were calculated and presented in the graphs as error bars.
RESULTS
Soil pH and electric conductivity in different cultivation years
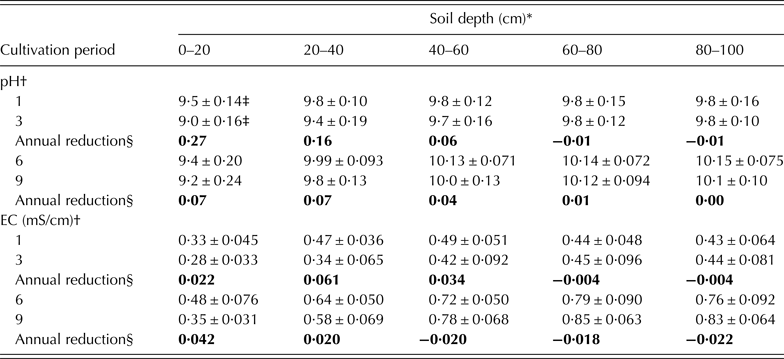
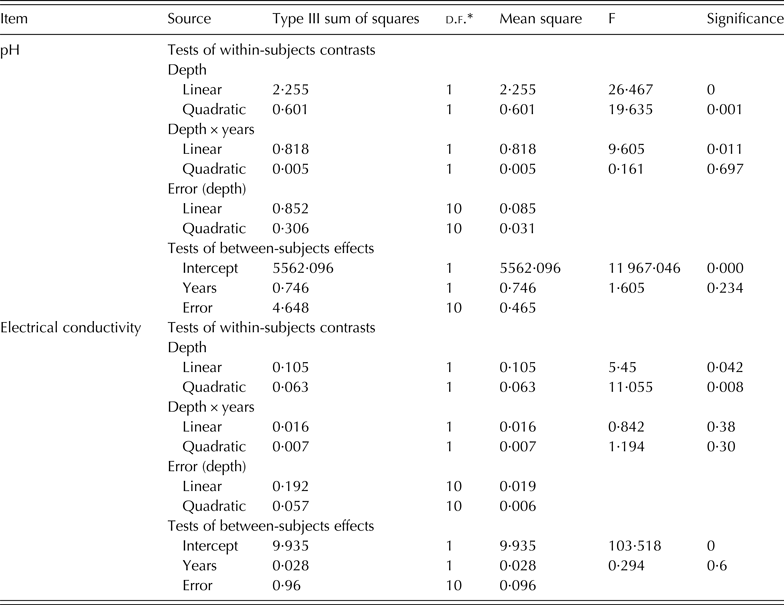
Table 2 shows the changes in pH and EC in saline-sodic paddy soil in different cultivation years. In zone B with RWI, soil pH decreased significantly (P < 0·05) by 0·53 units in the 0–20 cm layer from cultivation for 1 year to cultivation for 3 years, an average annual decrease of 0·27 units in soil pH. In zone A with GWI, soil pH decreased 0·22 units in the 0–20 cm layer from cultivation for 6 years to cultivation for 9 years, an annual decrease of 0·07 units, but the difference was not statistically significant. However, pH decreased by 0·5–0·7 units in the 0–20 cm layer after 6–9 years of cultivation, compared with that of the uncultivated soil before cultivation (Tables 1 and 2). A similar trend was observed in soil EC, as the annual EC decreased by 0·22 mS/cm from 1 year of cultivation to 3 years of cultivation and 0·42 mS/cm from 6 years of cultivation to 9 years in the 0–20 cm layer. Generally, with increasing years of cultivation, soil pH and EC showed a decreasing trend in the surface layer (0–40 cm depth), while the changes of pH and EC in the soils below 40 cm deep were minimal (Table 2). The repeated-measures ANOVA revealed that soil pH and EC were significantly different in different soil depths (P < 0·05), and there were significant quadratic relationships between soil depth and pH or EC, but the effects of cultivation years on soil pH and EC were not significant (Tables 3 and 4).
Table 2. Changes of soil pH and electrical conductivity (EC) in saline-sodic paddy field with continuous cultivation

* Data expressed as means ± s.e.
† pH and EC were determined in soil: water = 1 : 5, annual reduction mean changes of soil pH or EC in every year;
‡ Difference significant at P < 0·05.
§ Annual reduction was calculated between 1 and 3 cultivation years, between 6 and 9 cultivation years, respectively.
Table 3. The repeated-measures analysis of variance (ANOVA) of pH and electrical conductivity in different soil depths under cultivation years 1 v. 3

* The degrees of freedom for within-subject effects were approximated by the Geisser–Greenhouse method.
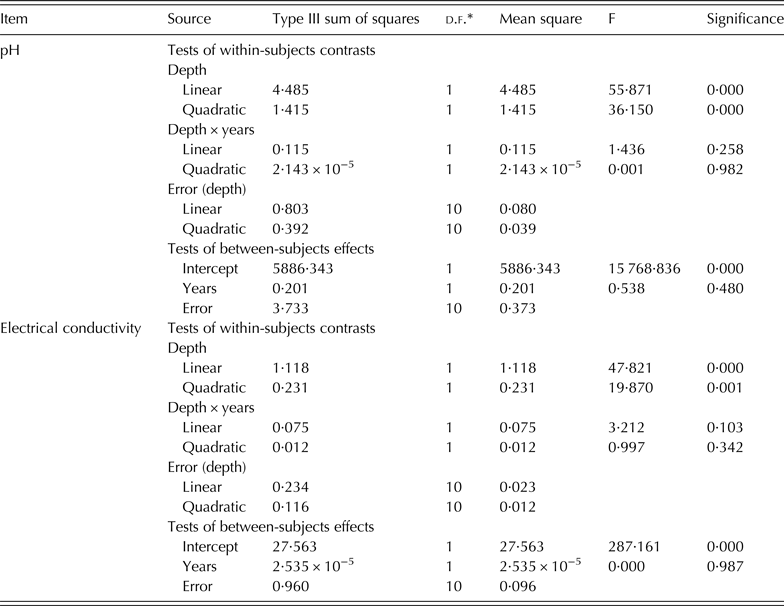
Table 4. The repeated-measures analysis of variance (ANOVA) of pH and electrical conductivity in different soil depths under cultivation years 6 v. 9

* The degrees of freedom for within-subject effects were approximated by the Geisser–Greenhouse method.
Changes in soil nitrogen with different years of cultivation
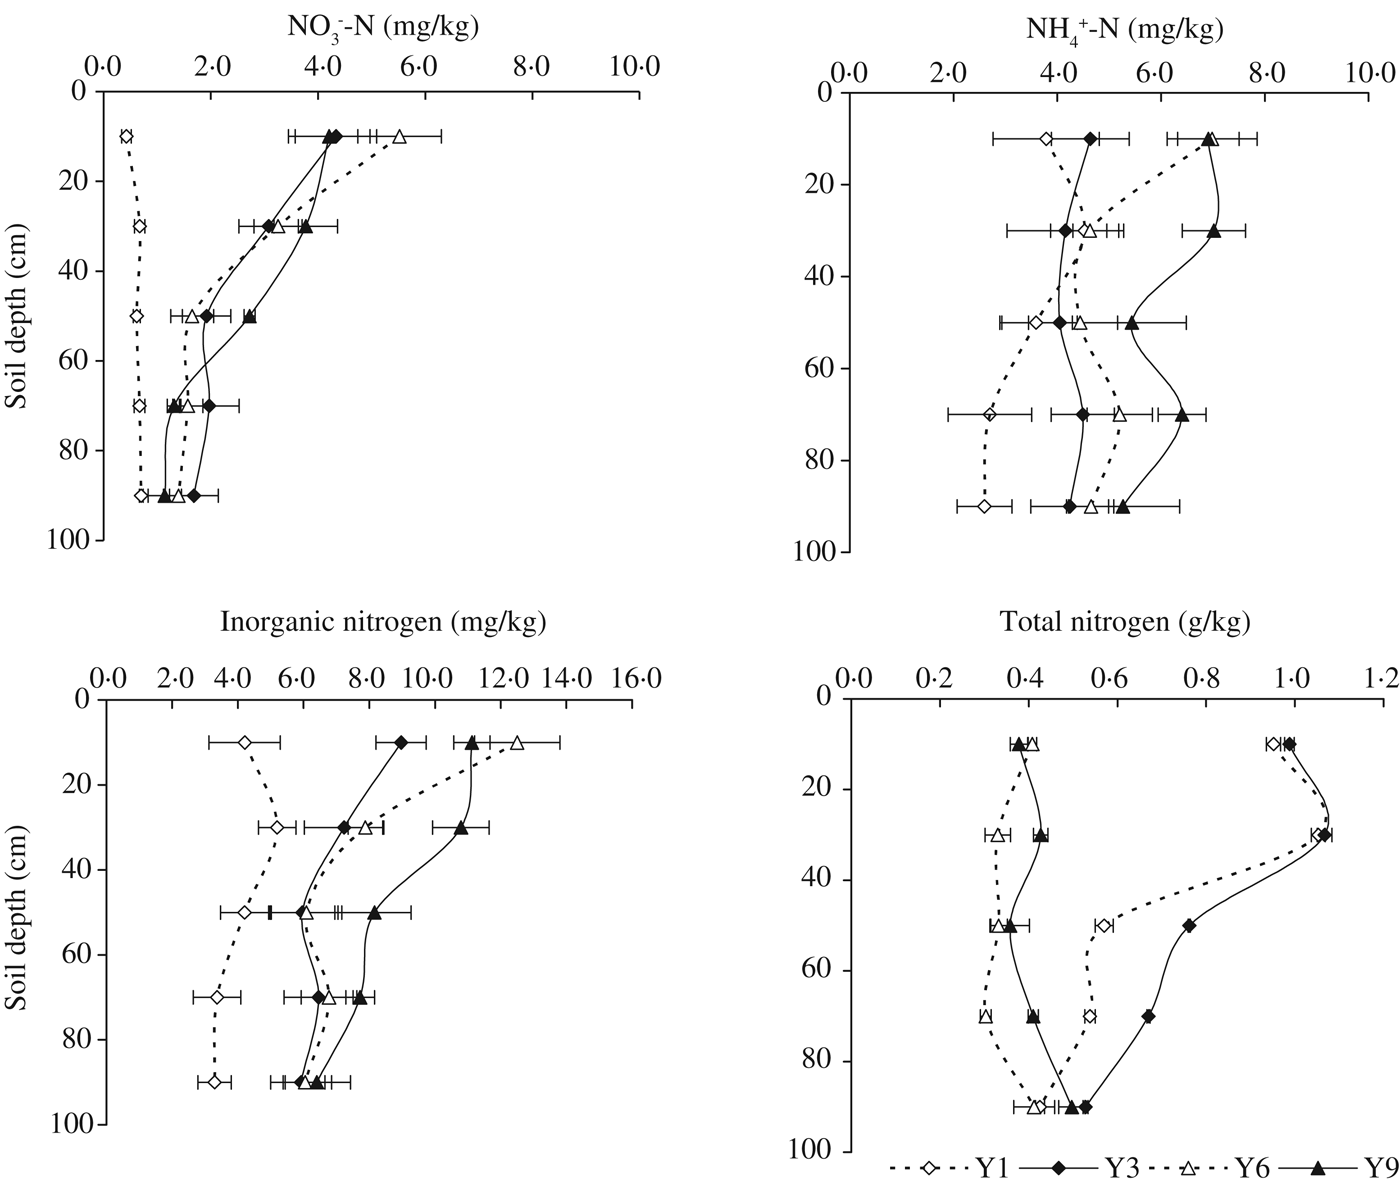
In saline-sodic paddy soil with both RWI and GWI, soil inorganic N (NH4+-N and NO3−-N) and total N content showed an increasing trend in the 0–100 cm soil layer with increasing years of cultivation (Fig. 2). The NO3−-N concentration, in particular, was increased significantly (P < 0·05) in the surface soil (0–40 cm deep). For example, in zone B – RWI, NO3−-N concentration increased 3·2–6·4 times in the surface soil after 3 years of cultivation as compared with that after 1 year of cultivation. Soil total inorganic N concentration was also significantly increased in the soil for the 0–100 cm layer after saline-sodic paddy field was cultivated for 3 years. In contrast, soil total N increased significantly (P < 0·05) in the soil below 40 cm deep after 3 years of cultivation as compared with that in the field with 1 year of cultivation. However, no significant change was observed for soil total N in the 0–40 cm layer. The changes of soil N in zone A with GWI were similar to those of zone B (Fig. 2). With increasing years of cultivation, soil inorganic N and total N concentrations increased gradually, but the change in total N concentrations in the 0–20 cm layer was not significant, while the increase of total N in the soil below 20 cm was significant (P < 0·05).

Fig. 2. Soil nitrogen changes in saline-sodic paddy field with different cultivation years.
Soil pH and electric conductivity under different nitrogen applications
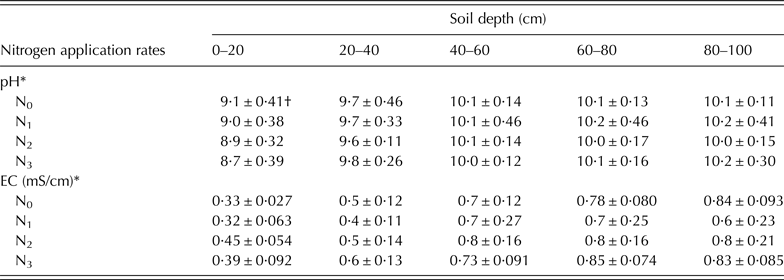
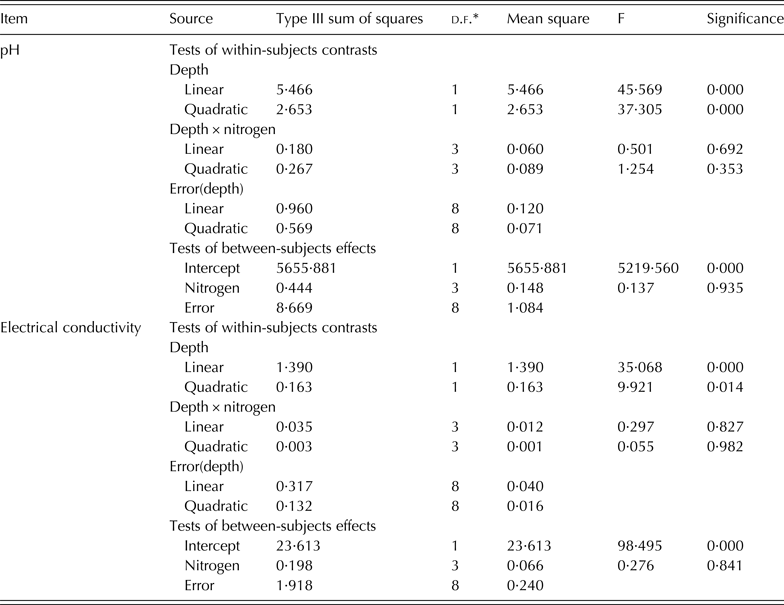
With continuous application of different levels of N fertilizers to saline-sodic paddy field, no significant changes were observed in soil pH and EC (Table 5). In the 0–20 cm layer, soil pH showed a decreasing trend with increasing rate of N fertilizer application, but the changes were not significant. With continuous N application at 300 kg N/ha for 3 years, soil pH only decreased by 0·46 units when compared with the control (no N application). The repeated-measures ANOVA revealed that soil pH and EC increased significantly (P < 0·05) with soil depth, but the effects of N application rates on soil pH and EC were not significant (Table 6). The repeated-measures ANOVA and regression analysis showed that there were significant quadratic relationships between soil depth and pH or EC, but no significant linear relationships between N application rates and pH or EC (Table 6).
Table 5. Changes of soil pH and electrical conductivity (EC) in saline-sodic paddy field with different nitrogen (N) application rates

* pH and EC were determined in soil: water = 1 : 5.
† Data expressed as means ± s.e.
Table 6. The repeated-measures analysis of variance (ANOVA) of pH and electrical conductivity in different soil depths under different nitrogen (N) application rates

* The degrees of freedom for within-subject effects were approximated by the Geisser–Greenhouse method.
Changes of soil nitrogen under different nitrogen applications
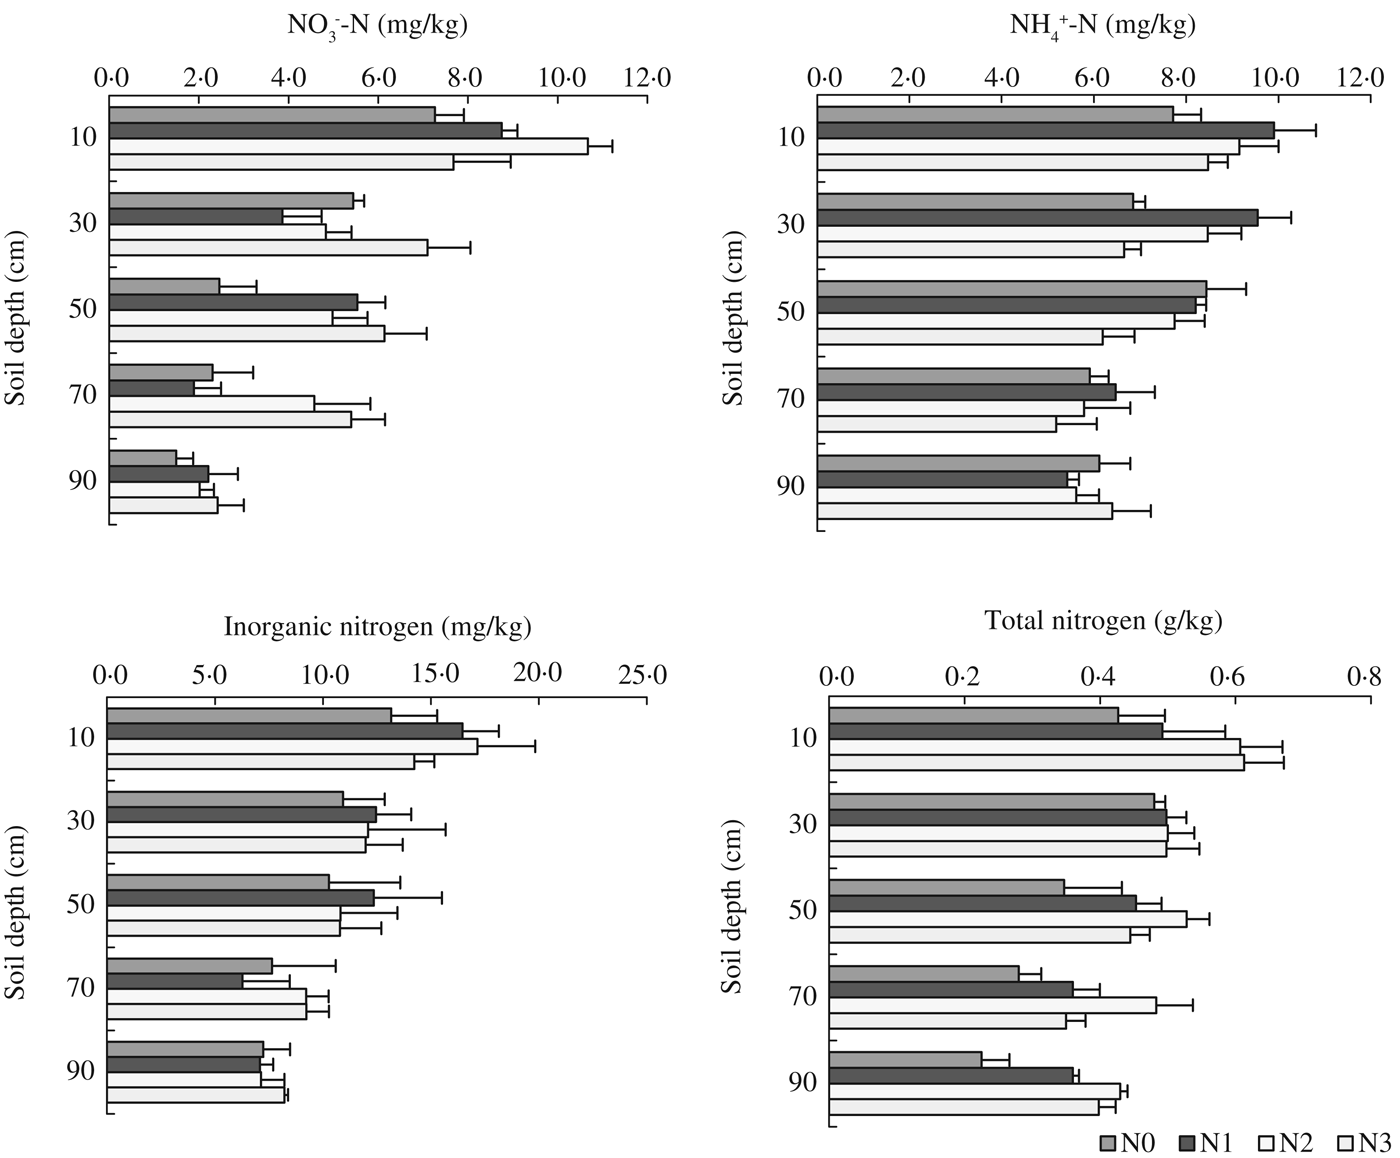
Soil inorganic N (especially NO3−-N) and total N increased significantly (P < 0·05) in saline-sodic paddy fields with increasing rates of N fertilizer application (Fig. 3). With no N fertilizer application, the ratio of NH4+-N and NO3−-N was near 1 : 1 in the surface soil (0–20 cm deep) and the concentration of NO3−-N was significantly lower (P < 0·05) than NH4+-N in various layers of soil below 0–20 cm. With increasing rates of N application, NO3−-N increased in surface soils (0–20 cm deep), while no increase in NH4+-N was found in soils below 20 cm. With the soil depth increasing, NO3−-N decreased significantly (P < 0·05), while NH4+-N changes were not significant. Therefore, soil inorganic N increased significantly (P < 0·05) with the application of N fertilizer only in the surface soil (0–20 cm deep), and the changes in inorganic N were less with increasing soil depth (Fig. 3). After application of different rates of N for 3 years, the increase in total N concentrations in the 0–100 cm soil layer was significant (P < 0·05) (Fig. 3).

Fig. 3. Soil nitrogen changes in saline-sodic paddy field with different nitrogen application rates.
Change of water quantity and quality with different irrigation sources
Table 7 shows that precipitation was 251·1 mm during the paddy rice growth period in 2011 and 81·4% of the precipitation occurred in July and August, with little precipitation in June and September. During the whole paddy rice growth cycle, the irrigation amount was 524·9 mm, with little drainage. The drainage amount was only 45 mm in the saline-sodic paddy field with GWI, while in the saline-sodic paddy field with RWI, the irrigation and drainage amount were 887·3 and 96·0 mm, respectively.
Table 7. Precipitation, irrigation and drainage water quantity during paddy rice growth period from June to September (mm)

* Budget = Precipitation + Irrigation – Drainage.
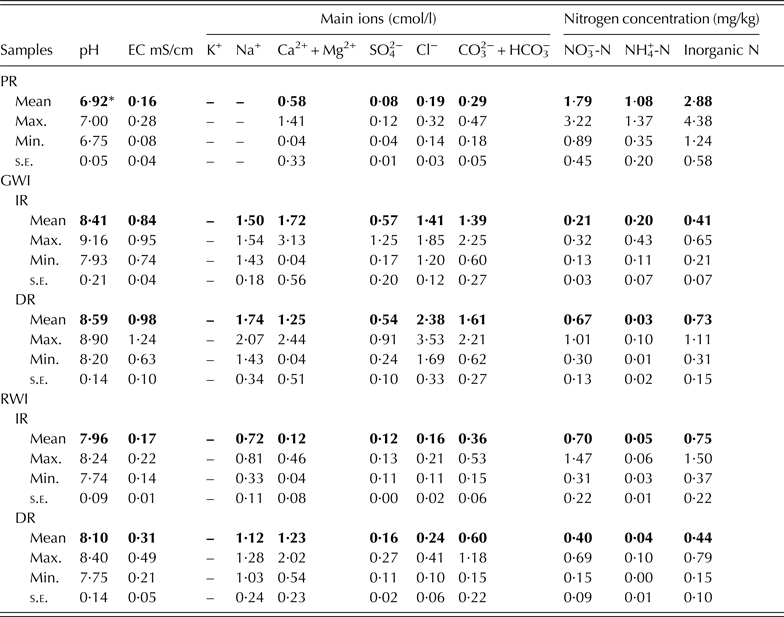
The changes in salinity and N concentrations of irrigation and drainage water are shown in Table 8. There were some significant differences in irrigation water quality among rain water, ground water and river water sources. For example, the pH of rain water was significantly lower (P < 0·05) than that of ground water and river water. Electrical conductivity and major ion concentrations in rain water and river water were significantly lower (P < 0·05) than those in ground water, but N concentrations in rain water were significantly higher (P < 0·05) than those in ground water and river water. However, when comparing irrigation water with drainage water, there was no significant difference in salinity and N concentrations, except for Cl− with GWI (Table 8).
Table 8. Quality characteristics of irrigation and drainage water samples during paddy rice growth period

PR, precipitation; IR, irrigation water; DR, drainage water; s.e., standard error; GWI, ground water irrigation; RWI, river water irrigation.
* Values in bold significant at P < 0·05.
Estimates of salinity and nitrogen balance in irrigation and drainage waters
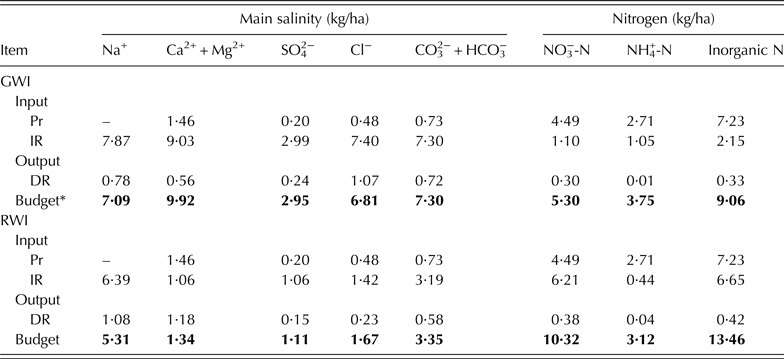
According to the changes of quantity and quality of irrigation and drainage waters, the mass balances for salts and N in the water system were calculated (Table 9). If salinity and N in irrigation and drainage water only were considered, soil salinity and soil N concentrations would be increased in saline-sodic paddy fields whether with GWI or RWI (Table 9). The increase of salinity with GWI was more than that with RWI in saline-sodic paddy field. The increase in inorganic N concentrations with GWI was less than that with RWI in the field irrigated. For example, sodium and inorganic N increased at an annual rate of 7·09 and 9·06 kg/ha respectively, in the paddy field irrigated with GWI; but the annual increase was 5·31 and 13·46 kg/ha, respectively, in the field irrigated with RWI.
Table 9. The gains or losses of salinity and nitrogen (N) under different irrigation and drainage (area: 1 ha)

Pr, precipitation; IR, irrigation water; DR, drainage water; GWI, ground water irrigation; RWI, river water irrigation.
* Budget = Input–output = (Pr + IR)-DR.
DISCUSSION
Impact of cultivation year on soil salinity and nitrogen content
Many studies have demonstrated that salinity is decreased and soil fertility improved in salt-affected soils after many years of cultivation (Dahiya et al. Reference Dahiya, Malik and Singh1982; Tan & Kang Reference Tan and Kang2009; Huang et al. Reference Huang, Bai, Chen, Zhang, Huang and Liu2012). The current results suggested the same impact on soil salinity after continuous cultivation, where soil pH and EC decreased 0·7 units and 0·325 mS/cm, respectively in the top 0–20 cm of the soil profile following 9 years of cultivation when compared with the same land before cultivation. However, the decreasing trend in soil salinity and pH was not observable below 40 cm.
High pH and salinity in soil has usually been regarded as a major obstacle for crop production in saline-sodic soils of the western Songnen Plain. However, an equally or even more limiting factor for agricultural development and productivity is water deficit (Oweis & Hachum Reference Oweis and Hachum2006; Helmreich & Horn Reference Helmreich and Horn2009). The relationship of salts moving with water has been widely recognized and irrigation with good quality water is the most commonly accepted method for improving saline-sodic soils. Due to competition with industry and construction, the area of agricultural land has decreased in some countries such as China. Reclamation of saline-sodic soils for rice production is feasible in practice, which would be of benefit to mitigate the pressure on food supply. In the current study, soil pH and EC in the top 0–40 cm of soil showed decreasing trends with years of cultivation using both GWI and RWI. It should be noted that the decrease in pH of the 0–20 cm soil layer after 3 years of reclamation was compared with 1 year of reclamation with RWI. Similarly, other studies by Wang et al. (Reference Wang, Wang, Xie, Yan and Liu1986), Tan & Kang (Reference Tan and Kang2009) and Huang et al. (Reference Huang, Bai, Chen, Zhang, Huang and Liu2012) also showed that planting rice could promote the desalination of the surface soil layer (0–40 cm) in saline-sodic paddy fields after a number of years of cultivation.
Nitrogen is one of the most important plant nutrients in arable agriculture. Cultivation generally leads to a temporary increase in soil mineral N, most probably because the soil disturbance causes a large pool of carbon substrates to become available, supporting greater mineralization (Wild Reference Wild1988; Silgram & Shepherd Reference Silgram and Shepherd1999). Furthermore, due to cultivation, fertilization, irrigation and other agricultural activities, a large quantity of inorganic N is added to the paddy field, also leading to increases in soil inorganic N (including NH4+-N and NO3−-N) and total N contents. Although the N background value was quite low in the current study, and was c. 0·39 g/kg in saline-sodic paddy fields, soil inorganic N and total N concentrations showed an increasing trend with time of cultivation. This trend is especially evident for NO3− concentrations in the 0–40 cm soil depth, with statistical significance. Therefore, N (especially inorganic N) concentrations after many years of cultivation in saline-sodic paddy soil should be monitored and assessed, so that N fertilizer application rates can be adjusted to avoid excessive N accumulation, subsequent N leaching and groundwater pollution.
Impact of nitrogen fertilizer applications on soil salinity and nitrogen concentrations
Most of the fertilizer and salinity interaction studies which were of great economic importance in improving productivity and fertilizer use efficiency were conducted on N-deficient soils (Grattan & Grieve Reference Grattan, Grieve and Pessarakli1999). In recent decades, the relationship of N and salinity in plants has been reviewed (Grattan & Grieve Reference Grattan, Grieve and Pessarakli1999; Hu & Schmidhalter Reference Hu and Schmidhalter2005). Some studies noted that when the degree of salinity was not severe, N application improved plant growth and yield (Papadopoulos & Rendig Reference Papadopoulos and Rendig1983; Soliman et al. Reference Soliman, Shalabi and Campbell1994), while others revealed that at a given salinity level, N application improved plant growth in the deficient treatment only (Hu & Schmidhalter Reference Hu and Schmidhalter1997). Recently, Semiz et al. (Reference Semiz, Suarez, Unlukara and Yurtseven2014) indicated that optimal N application was not necessary under higher saline conditions for pepper crop because the lower biomass accumulated under saline stress reduced the total N requirement.
The contribution of N fertilizer on rice yield was 30–45% in newly reclaimed saline-sodic paddy fields (data not shown), revealing that N deficiency exists in these saline-sodic soils, and N fertilizer played an important role in increasing rice yield. A study based on a pot experiment with paddy soil showed that soil pH significantly decreased and soluble salt contents increased with increasing rates of N fertilizer, while the effects of addition of (NH4)2SO4 and NH4Cl on soil pH and soluble salt contents were significantly different to those of CO(NH2)2 and NH4NO3 (Ai et al. Reference Ai, Sun, Yao, Li, Wang and Cao2008). A similar trend of pH decrease in the soil was observed at 0–20 cm with N application in the current study, but no significant differences were found for soil pH and EC under different rates of N application. The impact of increasing N application on soil pH and EC in saline-sodic paddy field in the short term depended on N source, but was minimal in the current relatively short-term study.
Many studies found that soil total N and inorganic N in the surface soil of 0–20 cm depth increased significantly under long-term repeated mineral and organic fertilizer application (Ju et al. Reference Ju, Liu, Zhang and Christie2006; Zhou et al. Reference Zhou, Gan, Shangguan and Zhang2013). In the current study, soil inorganic N and total N concentrations also showed a similar trend, but only the total N concentrations in the 0–20 cm layer and N application rates were linearly related (r > 0·95, P < 0·05). Inorganic N and total N concentrations were found to be highest in the topsoil layers (0–20 cm) and N concentrations gradually decreased with increasing soil depth. Similar results had also been reported by other experiments conducted in semi-arid areas (Wang et al. Reference Wang, Zhang, Li, Bai, Cao and Han2009; Gong et al. Reference Gong, Yan and Wang2012).
Impact of irrigation on balance of salinity and nitrogen in saline-sodic paddy field
Salt-affected soils could be converted to crop lands by irrigation with good quality water to leach the salts from the soils (Abbas et al. Reference Abbas, Quraishi and Chughtai1994). However, improper irrigation practices might cause salinization. At present, it is not clear whether the salinity was increasing or decreasing with irrigation in the saline-sodic paddy fields of the western Songnen Plain in China.
Traditionally, soil salinity changes have been evaluated using soil samples and laboratory analyses (Rhoades et al. Reference Rhoades, Lesch, LeMert and Alves1997). Evaluation of changes in soil salinity should include salt input by fertilization and output by crop harvest. The current study used salt concentration in irrigation/drainage water and water volume of irrigation/drainage to calculate salt balance. In this instance, it was reasonable because poor water permeability in saline-sodic soil limits downward leaching of salts. In accordance with local farming habits, little irrigation water was surface run-off because evaporation was as much as four or five times that of rainfall during the growth of rice. The experimental results verified that drainage water quantity was <10% of total irrigation water quantity in saline-sodic paddy field of western Songnen Plain.
There were significant differences in salinity between irrigation water and drainage water with GWI or with RWI. After one season of growing rice, salinity did not decrease but increased through irrigation and drainage in saline-sodic paddy field. Therefore, reducing soil salinity in saline-sodic paddy field through only simple irrigation and drainage was unrealistic. Partial reclamation success was seen from the decrease in soil pH and EC after years of rice cultivation, especially in the soil above 40 cm depth. The results illustrate that improving saline-sodic soil might not be possible with irrigation alone, but a combination with other agriculture practices would also be needed.
CONCLUSIONS
The current study described the changes in salinity and soil N concentrations under different years of cultivation, N fertilizer application rates and different irrigation water types in saline-sodic paddy field in Northeast of China. The results demonstrated that soil pH and EC decreased and N concentrations increased in the 0–40 cm soil depth with increasing years of rice cultivation. Nitrogen application did not significantly affect soil pH and EC in the short term, but it benefited N accumulation in the tillage layer and played an important role in increasing soil fertility. Therefore, soil reclamation and rice cultivation promoted the formation of a desalinized surface and fertile tillage layer in saline-sodic soil of the western Songnen Plain in China.
This work was supported by a grant from the Project of Western Action Plan of Chinese Academy of Sciences (KZCX2-XB3-16-02) and the foundation of Natural Science of Jilin Province (20140101156JC & 201115127).


