INTRODUCTION
Prostate cancer is the leading cancer in men and according to the 2016 Canadian Cancer Statistics, it is the highest (21%) among all new male cancer incidences and the third cause of cancer death in men. 1 Common treatment modalities for prostate cancer include surgery, hormonal therapy and radiotherapy. Various radiotherapy techniques mainly consisting of brachytherapy and external beam radiation therapy (EBRT) including three-dimensional conformal radiotherapy, intensity-modulated radiotherapy and volumetric-modulated arc therapy (VMAT) have been developed over decades. The EBRT techniques have been compared with respect to a variety of factors such as dosimetric and clinical effectiveness, complexity of the delivery and quality assurance (QA) processes, and influence on patient quality of life.Reference Palma, Vollans and James 2 , Reference Meier 3 Palma et al.Reference Palma, Vollans and James 2 compared all three techniques, and concluded that VMAT with variable dose rates does not only result in the lowest doses to critical normal organs at risk (OARs) while maintaining highly conformal dose distribution to the planning target volume (PTV), but it also has fewer monitor units (MUs). The reduced MU in VMAT minimise time for patient intra-fraction motion, and consequently improve the accuracy of the dose delivery. Low-intermediate risk prostate cancer is currently treated using VMAT with flattened 6 MV photon beam at 78 Gy in 39 fractions at our institution. Patients are usually treated 5 days each week for about 7–8 weeks.
Hypofractionated radiotherapy delivers a few fractions of larger doses per fraction than that in conventional radiotherapy, which reduces the overall treatment time and may produce more potent biologic effect. Hypofractionated stereotactic body radiation therapy (SBRT) has been extensively studied over the last decades to treat relatively small tumours with a maximum cross-sectional diameter up to about 5–7 cm.Reference Benedict, Yenice and Followill 4 As a great amount of the delivered dose is tightly conformed to the target, high accuracy of the tumour localisation is required, which is usually achieved via using advanced imaging modalities and careful treatment planning and delivery.Reference Han, Cheung, Basran, Poon, Yeung and Lochray 5 , Reference Kruis, van de Kamer, Sonke, Jansen and van Herk 6 SBRT has been studied and used to treat non-small cell lung cancer, liver cancers, spinal column tumours, prostate, etc., which show favourable long-term survival rates, and/or highly effective tumour control, while having minimum or equivalent side effects compared with other techniques.Reference Grills, Mangona and Welsh 7 – Reference Katz, Santoro, Diblasio and Ashley 15 In general, the use of hypofractionation scheme will benefit more for late responding tissue with relatively small α/β ratios. A value of ~1·5 Gy has been estimated for prostate tumour, which makes it a good candidate for hypofractionation scheme.Reference King, Brooks, Gill, Pawlicki, Cotrutz and Presti 16 Moreover, hypofractionated treatment can be combined with VMAT or VMAT flattening filter free (FFF) to further reduce treatment time and probability of intra-fraction movements.Reference Matuzak, Yan, Grills and Martinez 17 , Reference Navarria, Ascolese and Mancosu 18 An increasing number of theoretical and clinical studies on hypofractionated prostate cancer radiation treatment using either CyberKnife (Accuray Inc., Sunnyvale, CA, USA) or Linac machines are reported in recent years, which has shown some promising clinical benefits.Reference Alongi, Cozzi and Arcangeli 19 – Reference Gasic, Ohlhues and Brodin 22 In these studies, popular dose schemes are 35 or 36·25 Gy in 5 fractions.Reference Freeman and King 14 – Reference King, Brooks, Gill, Pawlicki, Cotrutz and Presti 16 , Reference Alongi, Cozzi and Arcangeli 19 A recent Radiation Therapy Oncology Group (RTOG) study, RTOG-0938, used 36·25 Gy in 5 fractions.Reference Lukka, Bahary and Lawton 23
A FFF photon beam can allow much higher dose delivery rate than a flattened beam, and its beam profile is much more forward peaked at the central axis because of the lack of the photon attenuation on the central axis by a flattening filter. This property of relatively higher intensity at the central axis of FFF beams proves to be a desirable characteristic for the optimisation of tightly focussed dose distribution on small targets while sparing surrounding normal tissues. Secondly dose delivery time can be dramatically reduced due to high dose rates (for instance, up to 2,400 MU/minute for 10 MV FFF beam), hence higher doses per fraction such as those in hypofractionation can be delivered in a reasonable time period.
This paper reports an investigation of preclinical studies on the implementation of FFF beams, specifically in the application of hypofractionated VMAT to treat prostate cancer. The treatment planning was accomplished using the Varian EclipseTM (Varian Medical Systems Inc., Palo Alto, CA, USA) treatment planning system (TPS) version 11.0. A total of 20 patients with low-intermediate risk prostate cancer are randomly selected for the studies. Throughout the rest of this manuscript, the conventional dose scheme refers to 78 Gy in 39 fraction or 78 Gy/39 (i.e., 2 Gy/fraction), and the hypofractionated dose scheme refers to 36·25 Gy in 5 fractions or 36·25 Gy/5 (i.e., 7·25 Gy/fraction). The patients’ plans are optimised using the same dose objective constraints for PTV and OARs for the same dose scheme. The optimisation constraints in the conventional plans are the same as are used clinically at our institution. The constraints used in the hypofractionated plans are the same clinical constraints but modified using the biological effective dose equation.
We investigated the potential benefits of hypofractionated dose scheme. We compared both dose–volume histograms (DVHs) and biological-effective dose–volume histograms (BEDVHs) of PTV and OARs for both the conventional and hypofractionated dose schemes. We further investigated conventional two-arc VMAT technique (78 Gy/39) using 6 MV, 10 MV, 6 MV FFF and 10 MV FFF, so that one can make dosimetric comparison via evaluating DVH, PTV homogeneity index (HI) and mean doses to OARs. The OARs considered in this study are rectum, bladder, left and right femoral heads. Furthermore, similar comparisons are made between 10 MV FFF and 6 MV for hypofractionated dose scheme (36·25 Gy/5). Finally, we investigated methods of plan delivery QA. This part of the study involved using an ArcCHECKTM (Sun Nuclear, Melbourne, FL, USA) device to perform QA measurements on ten randomly selected conventional scheme patients’ plans. We also repeated the set of measurements on five randomly selected patients’ plans from the ten patients using the new Varian 43×43 cm2 electronic portal imaging device (EPID). For this group of patients we measured both their conventional and hypofractionated plans using the EPID.
MATERIALS AND METHODS
Patient selection
Low-intermediate risk prostate cancer patients receiving radiotherapy are normally treated to 78 Gy in 39 fractions with two-arc VMAT technique using a 6 MV flattened photon beams at our centre. Data from 20 prostate cancer patients treated between 2013 and 2014 at our centre were randomly selected for this study. All patients have intact prostate and no prostheses in either femoral heads. Ten patients’ conventional treatment plans were randomly selected from the 20 cases for QA measurements using the ArcCHECKTM. Five patients’ plans were further randomly selected from the ten patients’ plans for portal dosimetry measurements using the EPID for both their conventional and hypofractionated plans.
Treatment planning
Conventional dose scheme (d 78=2 Gy/fraction) plans
Four treatment double arc plans were prepared for each patient using 6 MV, 6 MV FFF, 10 MV and 10 MV FFF beams. The dose rates in each plan were variable and dependent upon the plan optimisation results, however, the maximum for 6 MV FFF, 10 MV FFF, 6 MV and 10 MV were set to 1,200, 2,400, 600 and 600 MU/minute, respectively. All plans were optimised using departmental clinical protocol in the Varian EclipseTM TPS version 11.0. The prescription dose was 78 Gy in 39 fractions and the optimised plans were normalised such that the 99% volume of the PTV was covered by the 95% of prescribed dose. The plan DVHs along with dose information such as mean and maximum doses to structures were exported and further analysed and compared in MATLAB® (64-bit, R2012b, MA, USA). All the plans were evaluated against departmental acceptance criteria which are based on the Quantitative Analysis of Normal Tissue Effects in the Clinic and Emami et al. recommendations for the conventional scheme.Reference Bentzen, Constine and Deasy 24 , Reference Emami, Lyman and Brown 25
Hypofractionated dose scheme (d 36·25=7·25 Gy/fraction) plans
The same plan optimisation procedures described above were performed on the same 20 patients using a hypofractionated protocol of 36·25 Gy in 5 fractions (i.e., 7·25 Gy/fraction). In this part of the study we only compared the standard 6 MV with 10 MV FFF and our choice of the 10 MV FFF is based on the study comparing all energies as described above. The optimisation dose constraints used in this part of the study were obtained using the clinical dose constraints for the conventional scheme and adjusted based on the biological equivalent dose (BED) formalism [(Equation (1)].The dose constraints (D 78) in the conventional protocol were converted to the hypofractionated dose constraints (D 36·25) using Equation (1). The values of the α/β ratio used were 1·5 Gy for prostate (PTV), and 3 Gy for other OARs. The acceptance criteria were also obtained by scaling the departmental acceptance criteria for the conventional plans using the biological equivalent dose (BED) equation:
 $${\rm BED}{\equals}D_{{36.25}} \left( {1{\plus}{{d_{{36.25}} } \over {{\raise0.7ex\hbox{$\alpha $} \!\mathord{\left/ {\vphantom {\alpha \beta }}\right.\kern-\nulldelimiterspace}\!\lower0.7ex\hbox{$\beta $}}}}} \right){\equals}D_{{78}} \left( {1{\plus}{{d_{{78}} } \over {{\raise0.7ex\hbox{$\alpha $} \!\mathord{\left/ {\vphantom {\alpha \beta }}\right.\kern-\nulldelimiterspace}\!\lower0.7ex\hbox{$\beta $}}}}} \right)$$
Dosimetric comparison between beam energies
The mean doses (D mean) to the OARs were analysed and the HI of the PTV was calculated using Equation (2) for every plan. A lower value of HI indicates a more homogenous dose distribution. The average values of the mean doses (D avg, m ) and HI avg and the standard deviations were calculated for the 20 patients for all photon energies for both the conventional and hypofractionated dose schemes. Statistical differences in the D avg, m of the OARs as well as the PTV HI avg between different energies were evaluated in MATLAB using a paired sample Wilcoxon signed rank test with significance level of 0·05 (i.e., p<0·05):
 $${\rm HI}{\equals}{{D_{{2\,\%\,}} {\minus}D_{{98\,\%\,}} } \over {{\rm Prescribed}\,{\rm dose}}} $$
The mean integral doses to the body (D b ) for the plans using the 6 and 10 MV FFF were calculated via subtracting mean dose to PTV from that to the whole body and then normalised by body volume without PTV volume. The average (D avg, b ) and the standard deviation of the mean doses were calculated for the 20 patients.
Comparison between the different dose schemes
BED and BEDVH comparison
The relative DVHs (relative dose on the dose axis) of the PTV and OARs for the two dose schemes were compared. These relative DVHs were averaged over all the 20 patients’ DVHs. The differential BEDVHs were first obtained by converting doses in the differential DVH to BED using Equation (3), where n is number of fraction (n=39 for conventional scheme and n=5 for hypofractionated scheme) and D x is an arbitrary dose on the absolute differential DVH plot. The cumulative BEDVHs were obtained via summation of the differential BEDVHs, in the same way as derivation of DVH using differential DVH. Finally, the average cumulative BEDVH for the 20 patients was obtained and compared for each dose scheme:
 $$BED_{x} {\equals}D_{x} \left( {1{\plus}{{{{D_{x} } \mathord{\left/ {\vphantom {{D_{x} } n}} \right. \kern-\nulldelimiterspace} n}} \over {{\raise0.7ex\hbox{$\alpha $} \!\mathord{\left/ {\vphantom {\alpha \beta }}\right.\kern-\nulldelimiterspace}\!\lower0.7ex\hbox{$\beta $}}}}} \right) $$
Gantry rotation time evaluation
Treatment time may be defined as the total time from patient set-up to patient being taken off the couch or the actual beam-on time or gantry rotation time while patient is undergoing treatment. For this study, we assume treatment time as the gantry rotation time (T G ) and compares treatment time between the different dose schemes to evaluate dose rate effects of FFF beams on the T G . The T G was theoretically calculated for each optimised plan using the sum of all ratios of gantry rotation segments (θ i ) divided by the optimised gantry speed for that segment (v(θ i )) as shown in Equation (4):
 $$T_{G} {\equals}\mathop \sum\limits_{\theta _{i} } {{\theta _{i} } \over {v\left( {\theta _{i} } \right)}}$$
T G was calculated for 6 MV plans at different dose per fraction: 2, 4, 5, 6 and 7·25 Gy/fraction, and then for 10 MV FFF plan at 7·25 Gy/fraction.
MU/deg threshold calculation
The high dose rate of the FFF beam is known for its advantage in reducing treatment time of hypofractionated plans. FFF beams may be potentially used in any RapidArcTM (Varian Medical Systems Inc.) plan with high MUs that result in the gantry rotation to slow down in order to compensate for the dose delivery rate limitation when flattened filtered beams are used. In order to optimise the use of the FFF beams, an angular MU quantity is proposed to enable the choice between non-FFF beams and FFF beams. The angular MU (MU/deg) is defined as the average MU delivered per rotational angle in an optimised RapidArcTM plan. The threshold value of angular MU for using high dose rate FFF beam to avoid gantry rotation slowing down can be theoretically calculated using Equation (5), where Ḋ is the maximum dose delivery rate at given energy, v G is the maximum gantry rotational speed. For example, if the maximum gantry rotational speed is v G =4·8 deg/second, and maximum Ḋ=600 MU/minute at 6 MV photon beam, the theoretical threshold value is calculated to be (MU/deg)th=2·083 MU/deg. That means, if a partial or full arc RapidArcTM plan using 6 MV photon beam has average MU/deg value >2·083, the gantry rotation will be slowed down at some time during treatment (increasing treatment time), and the use of FFF beam may be beneficial in order to avoid increased treatment time. This threshold value can also be derived by investigating the relation between gantry rotational speeds with MU/deg for plans for a wide range of MUs. The amount of time reduction can be varied depending on the dose per fraction and maximum gantry speed used at local centres. In this study, the dose rate effects on time were investigated on the plans with doses per fraction of 2, 4, 5, 6 and 7·25 Gy/fraction at 6 MV and 7·25 Gy/fraction at 10 MV FFF:
 $$\left( {{{{\rm MU}} \mathord{\left/ {\vphantom {{{\rm MU}} {\deg }}} \right. \kern-\nulldelimiterspace} {\rm deg }}} \right)_{{{\rm th}}} {\equals}{{{{360\left[ {{\rm deg}} \right]} \over {v_{G} \left[ {{{{\rm deg}} \over s}} \right]}}{\times}\dot{D}\left[ {{{{\rm MU}} \over s}} \right]} \over {360\left[ {{\rm deg}} \right]}}{\equals}{{\dot{D}\left[ {{{{\rm MU}} \over s}} \right]} \over {v_{G} \left[ {{{{\rm deg}} \over s}} \right]}} $$
Plan QA measurements
ArcCHECKTM
Ten patients’ conventional dose scheme plans (each has four plans of different energies) were randomly selected for plan delivery verification QA measurements using the ArcCHECKTM. The Linac outputs for all the energies were verified following the Task Group 51 (TG 51) protocol.Reference Almond, Biggs and Coursey 26 The ArcCHECKTM device was then calibrated for these energies using an open field with gantry angle at 0° and a field size of 10×10 cm2. The dose in the central cavity of the ArcCHECKTM, representing the isocenter location, was independently measured for all the plans using a Farmer-type ion chamber detector (Capintec PR06C, NJ, USA) to independently monitor Linac performance during the course of the QA measurements. Finally, the ArcCHECKTM QA results were assessed using the gamma evaluation method. The region of interest (ROI) used was the Multileaf collimator Complete Irradiation Area Outline (MLC-CIAO) with no margin and the gamma criteria were both 2%/2 mm and 3%/3 mm.
Portal dosimetry
VMAT plan QA is routinely performed via portal dosimetry method using EPID at our centre; therefore, five patients’ conventional plans (6 MV, 6 MV FFF, 10 MV and 10 MV FFF) randomly selected from the ten patients used for the ArcCHECKTM QA measurements were remeasured using the EPID. The verification plans for the FFF beams were created in the EclipseTM TPS version 13.6. The portal dosimetry measurements were performed on a Varian Truebeam machine (Varian Medical Systems Inc., Palo Alto, CA, USA) version 2.5 equipped with the new Varian 43×43 cm2 EPID. The QA results were assessed using the gamma evaluation method with both 2%/2 mm and 3%/3 mm gamma criteria, and the ROI was set to MLC CIAO without any margin (i.e., MLC CIAO+0 cm). Moreover, the same five patients’ corresponding hypofractionated plans (6 MV and 10 MV FFF) were prepared, delivered and measured using this portal dosimetry method. The QA procedure and analysis method were the same as described above.
RESULTS AND DISCUSSION
Dosimetric comparisons between different plans
Conventional dose scheme
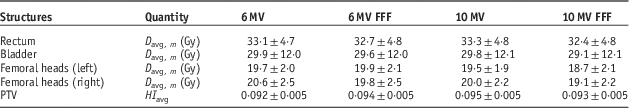
The average (D avg, m ) and standard deviation of the OAR doses are listed in Table 1. The statistical tests results (p<0·05) are as follows: for rectum, the D avg,m values are significantly different for all energies, and 10 MV FFF gives the lowest dose; for bladder, D avg,m the 6 MV FFF gives significantly lower dose than that for 6 MV, however, with 10 MV there is no difference comparing to 6 MV and 6 MV FFF. The 10 MV FFF gives significantly the lowest dose among all the energies; for left femoral head, no difference in D avg,m is found among 6 MV, 6 MV FFF and 10 MV, but the 10 MV FFF gives the lowest dose; for right femoral head, D avg,m for 6 MV is the highest, and no difference between 6 MV FFF and 10 MV is observed, and D avg,m for 10 MV FFF is statistically the lowest. The difference in the results of left and right femoral heads most likely comes from the anatomical variation among individual patients. In this study we have observed that using 10 MV FFF will result in statistically low dose to all the OARs and the PTV HI shows no statistical difference from all the other energies (p<0·05). These results are found to be in agreement with similar work done by Chung et al.Reference Chung, Kim and Eom 21 who compared VMAT-Stereotactic ablative body radiotherapy (SABR) treatment plans with flattening and FFF beam for localised prostate cancer.
Table 1 Average and 1 SD of both the mean doses to organs at risk and planning target volume (PTV) homogeneity index (HI) for all 20 patients

Notes: All plans are based on the convention dose scheme.
Abbreviation: FFF, flattening filter free.
Figures 1–5 show the DVHs comparison for the OARs. For simplicity and to ensure clarity in the results presentation, we have compared the standard 6 MV photon beam with 6 MV FFF (Figure 1), 6 MV with 10 MV FFF (Figure 2) and 6 with 10 MV (Figure 3). We have also compared the 6 with 10 MV FFF (Figure 4) and 10 MV with 10 MV FFF (Figure 5). The solid lines represent the mean DVH and the ‘cloud of DVHs’ represents ±1 SD of the mean DVHs. The results show that the FFF beams (except for the left femoral head at 6 MV FFF), show relatively lower low dose volume than the 6 MV. Comparison of DVHs between the 6 and 10 MV shows the bladder and left femoral head DVHs are almost the same between the two energies. The rectum DVH for 10 MV is slightly higher than that at 6 MV overall, but the right femoral head DVH is lower. As previously found in the statistical tests of the D avg,m , all OARs treated with 10 MV FFF have smaller low dose volume which results in the lower D mean on average.

Figure 1 Comparison of average organs at risk dose–volume histograms (DVHs): 6 MV versus 6 MV flattening filter free (FFF): bladder (a), rectum (b), left femur (c) and right femur (d). Notes: The solid lines are the mean DVH and the ‘cloud of DHVs’ represents 1 SD above and below the mean.

Figure 2 Comparison of average organs at risk dose–volume histograms (DVHs): 6 MV versus 10 MV flattening filter free (FFF): bladder (a), rectum (b), left femur (c) and right femur (d). Notes: The solid lines are the mean DVH and the ‘cloud of DHVs’ represents 1 SD above and below the mean.

Figure 3 Comparison of average organs at risk dose–volume histograms (DVHs): 6 versus10 MV: bladder (a), rectum (b), left femur (c) and right femur (d). Notes: The solid lines are the mean DVH and the ‘cloud of DHVs’ represents 1 SD above and below the mean.

Figure 4 Comparison of average organs at risk dose–volume histograms (DVHs): 10 versus 6 MV flattening filter free (FFF): bladder (a), rectum (b), left femur (c) and right femur (d). Notes: The solid lines are the mean DVH and the ‘cloud of DHVs’ represents 1 SD above and below the mean.

Figure 5 Comparison of average organs at risk dose–volume histograms (DVHs): 10 MV flattening filter free (FFF) versus 10 MV: bladder (a), rectum (b), left femur (c) and right femur (d). Notes: The solid lines are the mean DVH and the ‘cloud of DHVs’ represents 1 SD above and below the mean.
The mean integral doses to the body averaged over 20 patients, D avg, b from plans using 10 MV FFF beams, is found to be 8·7±1·2% lower than that from plans using 6 MV FFF. The results show that the average MU delivered at 6 MV FFF is about 16·5±18·5 MU greater than that at 10 MV FFF, and with the maximum difference of 53 MU. As 6 MV FFF beam has much lower photon energy than 10 MV FFF beam, more MU would be necessary to penetrate large body tissue like pelvis in order to deliver the same dose to PTV. This will consequently result in high integral dose to the whole body.
Figure 6 shows the comparison of PTV DVHs for all energies. The PTV coverage is similar with all energies and hence the mean DVHs and ‘cloud of DHVs’ of ± standard deviation are too small to be apparent on the plot. As mentioned earlier, all plans were optimised using the same objective constraints and were normalised such that the 99% of the PTV volume was covered by the 95% of the prescribed dose (78 Gy). The PTV DVHs from the four different energies are nearly identical as shown. The above comparison results show that using 10 MV FFF results in OARs receiving relatively lower doses, which consequently reduce the mean doses. These plans also have smaller integral doses to the body when compared with those using 6 MV FFF; however, the PTV HI remains the same. Therefore, in the hypofractionated scheme we will only present results comparing standard 6 MV and 10 MV FFF beams. In addition, because of the locations of rectum and bladder being closer to the PTV, maximum doses to these OARs are mostly limited to the prescribed dose to PTV. Among all the OARs, femoral heads seem to be benefited the most by using the FFF beams.

Figure 6 Mean planning target volume (PTV) dose–volume histograms (DVHs) of the 20 patients for 6 MV, 6 MV flattening filter free (FFF), 10 MV and 10 MV FFF beam energies. Notes: The solid lines are the mean DVH and the ‘cloud of DHVs’ represents 1 SD above and below the mean. However, the results closely overlap and are not apparent. Abbreviation: PTV_PROS, PTV prostate.
Hypofractionated dose scheme
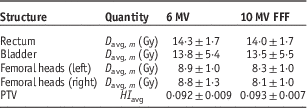
Table 2 presents the average and 1 SD of the mean doses to the OARs as well as the HIs of the PTVs averaged over all 20 patients. Statistical tests reveal that the averaged D mean (i.e., D avg, m ) to the OARs for 10 MV FFF are significantly lower than those with 6 MV, whereas the average PTV HIs (HI avg) shows no significant difference between the two energies (p<0·05). The difference can also be observed in Figures 7b–7e, which shows the DVHs of the OARs for the 20 patients. The solid lines are the mean DVHs and the ‘cloud of DHVs’ represents 1 SD above and below the mean. The DVHs with 10 MV FFF beam show that the OARs receive relatively lower doses. The PTV DVHs are almost the same between the two energies, as shown in Figure 7a.

Figure 7 Comparison of average planning target volume (PTV) and organs at risk dose–volume histograms (DVHs) of hypofractionated volumetric-modulated arc therapy (VMAT) plans between 6 MV and 10 MV flattening filter free (FFF). (a) PTV_prostate, (b) bladder, (c) rectum, (d) left femur and (e) right femur. Notes: The solid lines are the mean DVH and the ‘cloud of DHVs’ represents 1 SD above and below the mean.
Table 2 The average and 1 SD of the mean doses to the organs at risk and of planning target volume (PTV) homogeneity index (HI) for the 20 patients

Note: All plans are based on the hypofractionated dose scheme.
Abbreviation: FFF, flattening filter free.
DVH and BEDVH
Figure 8 shows a comparison of the DVHs (relative volume versus relative dose) of the hypofractionated VMAT and conventional VMAT plans for 6 MV and 10 MV FFF beam energies. The hypofractionated plans for both energies show relatively lower doses to OAR in the low and intermediate relative dose regions. This lower dose is most significant for bladder, followed by rectum. There is no significant difference in PTV coverage for both energies and prescription schemes. Figure 9 shows a comparison of the BEDVH. The results show that hypofractionated scheme will deliver more biological effective dose to PTV (up to about 20% more) and much less dose to OARs, clearly indicating the benefit of using hypofractionated dose scheme for prostate cancer treatments. However, short–term and long-term clinical data are required to validate the clinical effect.

Figure 8 Comparison of average planning target volume (PTV) and organs at risk dose–volume histograms (DVHs) between conventional (6X, 10X FFF) and hypofractionated (Hypo 10X FFF, Hypo 6X) dose schemes at energies of 6 MV and 10 MV flattening filter free (FFF). (a) PTV_prostate, (b) bladder, (c) rectum, (d) left femur and (e) right femur.

Figure 9 Biological effective dose–volume histograms comparison between conventional (6X, 10X FFF) and hypofractionated (Hypo 10X FFF, Hypo 6X) dose schemes for 6 MV and 10 MV flattening filter free (FFF). (a) PTV_prostate, (b) bladder, (c) rectum, (d) left femur and (e) right femur. Abbreviation: BED, biological equivalent doses.
Treatment time and (MU/deg) evaluations
Figure 10a shows the relation of gantry speed with MU/deg for a full arc for a range of MUs. It is shown that the gantry rotation speed starts to decrease at about 2·086 MU/deg, corresponding to about 750 MU per full arc. This extrapolated value agrees well with the previously calculated theoretical value. Figure 10b clearly shows an increase in T G when MU is >750 for 6 MV beams. The red symbols representing the 7·25 Gy/fraction plan with 10 MV FFF beam (maximum 2,400 MU/minute) demonstrate that the T G time is identical to that of conventional plan at 2 Gy/fraction using 6 MV because the high dose rates compensate for the increased MU per arc. In this specific study, the maximum reduction in T G using ten FFF beam is about 80% per full arc. The significance of these results and MU/deg threshold concept are not only for a full arc hypofractionated plan, but it also can be applied to a partial arc with relatively high MU/deg (>2·083 MU/deg if the gantry speed is set at 4·8 deg/second) such as those used in Head and Neck (H&N) cases. Taking advantage of high dose rate of FFF beam, T G will be best optimised to reduce errors induced by internal motion during treatment because of prolonged treatment time. Note that, for prostate cancer, PTV coverage using ten FFF shows no significant difference from using other energies, however, the OAR dose and body integral doses are significantly lower even though the clinical impact of this reduction needs to be clinically evaluated.

Figure 10 (a) Relationship between gantry rotational speed and monitor unit (MU) delivered per gantry angle for full counterclockwise (CCW) arcs with a range of MUs (288, 603, 782, 882, 921, 1,082 MU). (b) Relation between normalised gantry rotation time (t second/75 second) and total MU per arc for a range of prescribed fractional doses [2, 4, 5, 6 and 7·25 Gy/fraction at 6 MV and 7·25 Gy/fraction at 10 MV flattening filter free (FFF)]. Notes: The time of 75 seconds is the total time for one arc when gantry rotates at its maximum speed of 4·8 deg/second.
Plan QA using ArcCHECKTM and EPID
ArcCHECKTM for conventional scheme plans
Before plan QA measurements with the ArcCHECKTM device, the Linac outputs were measured for all four energies following the TG 51 protocol.Reference Almond, Biggs and Coursey 26 Moreover, during the ArcCHECKTM measurements of the ten patients’ plans, the doses at the isocenter were measured using a Farmer-type ion chamber inserted in the central cavity of the ArcCHECKTM detector. The measured doses were compared with the calculated ones from the TPS. A total number of ten patients’ plans were measured and each had four plans with different energies. Figure 11 shows the deviation between the calculated and measured doses for each patient plan measured and the maximum dose difference is about 1·86% at 10 MV FFF.

Figure 11 Deviation of the doses between measured by an ion chamber at the central cavity of the ArcCHECK device and calculated in the Eclipse treatment planning system. Abbreviation: FFF, flattening filter free.
The VMAT plans measured with the ArcCHECKTM detector were evaluated using the gamma evaluation method for both a 3%/3 mm and a 2%/2 mm gamma criteria. The ROI for the gamma evaluation was set to zero margins and using the MLC CIAO. The minimum passing rate is 97·1% for the 3%/3 mm criteria at 10 MV FFF, which is still above our current clinical acceptance threshold of 95%. Figure 12 shows the average and 1 SD of the percentage pass rate for the various energies. The data indicate that all the VMAT plans can be measured via ArcCHECKTM, and results are in good agreements with the predictions in the TPS.

Figure 12 Gamma evaluation of the plan quality assurance measurement using ArcCHECK. Notes: The prefix ‘CW’ means the clockwise arc and the prefix ‘CCW’ refers to the counterclockwise arc. The CW and CCW arcs were measured separately. The prefix ‘Total’ refers to both the CW and CCW arcs measured together. (a) Gamma evaluation criteria: 3 mm and 3%. (b) Gamma evaluation criteria: 2 mm and 2%. Abbreviation: FFF, flattening filter free.
EPID for both conventional and hypofractionated scheme plans
We further randomly selected five patients for plan verification QA measurements using onboard EPID, as this method is currently locally used for patient-specific plan QA. The same gamma evaluation method and criteria of 3%/3 mm and 2%/2 mm are used. The lowest passing rate among the conventional plans is 94·3% at 10 MV for the 3%/3 mm criteria. The average and 1 SD of the passing ratios for the conventional plans are plotted in Figure 13. Similarly, MLC CIAO without any margins was considered in the gamma evaluation.

Figure 13 Gamma evaluation of conventional plan quality assurance measurement using electronic portal imaging device. Note: The prefix ‘CW’ means the clockwise arc and the prefix ‘CCW’ refers to the counterclockwise arc. (a) Gamma evaluation criteria of the 3 mm and 3%. (b) Gamma evaluation criteria of the 2 mm and 2%. Abbreviation: FFF, flattening filter free.
Figure 14 shows the average and 1 SD of the passing rates for hypofractionated plans. As seen in both Figures 13 and 14, the plans using 10 MV FFF with the maximum dose rate of 2,400 MU/minute can be readily measured using the new 43×43 cm2 EPID, and the measured fluence fields agree well with the predictions in the Eclipse TPS.

Figure 14 Gamma evaluation of hypofractionated plan quality assurance measurements using electronic portal imaging device. Note: The prefix ‘CW’ means the clockwise arc and the prefix ‘CCW’ refer to the counterclockwise arc. (a) Gamma evaluation criteria: 3 mm and 3%. (b) Gamma evaluation criteria: 2 mm and 2%. Abbreviation: FFF, flattening filter free.
CONCLUSIONS
The evaluation of conventional VMAT plans for prostate cancer treatment using flattened and FFF photon beams illustrates that plans using 10 MV FFF will result in OAR volumes receiving relatively low doses, which results in the statistically reduced mean doses, as well as relatively lower integral body doses. Plans using FFF beams can be readily measured using EPID although the Eclipse TPS version 13.6 or higher is required to prepare the verification plans, and the new Varian electronic portal imaging detector is required for high dose rate delivery. For centres where the Linac machines are equipped with the older generation EPID the response can be saturated at the high beam dose rates at standard measurement distance (100 cm), and hence an extended distance may be required. Plan delivery QA can also be done using the ArcCHECKTM device; however, the ArcCHECKTM must be capable of measuring high dose rate. The agreements from the gamma evaluation analyses using either device are well acceptable.
The comparison between conventional VMAT and hypofractionated VMAT shows a clear advantage of using hypofractionated VMAT for prostate cancer patients: (1) lower BED doses are delivered to the OARs and higher BED doses to PTV; (2) dose delivery time per treatment for hypofractionated plans using ten FFF beam is the same as the current conventional plans; (3) patients treatment visit times are significantly reduced to five times versus conventional 39 times.
The proposed angular MU quantity with a threshold value of 2·083 MU/deg (for Linac speed set at 4·8 deg/second) could be a useful indicator to switch from 6 MV to FFF beam for any arc plans with high MUs. This threshold value could be different depending on the machine set gantry speed and therefore be calculated for specific machines depending on the machine parameter settings such as maximum gantry rotational speed. Moreover, this value is an average value assuming total MU is delivered uniformly throughout the arc. Finally, although the study of angular MU (MU/deg) was focus on prostate treatment it may be applicable to other sites.
Acknowledgements
The authors are very much grateful to all the staff at the Medical Physics, Radiation Therapy and Radiation Oncology Departments for their advice and support during the course of this research.
Financial support
This research was partially supported with funding from the TELUS Ride For Dad (RFD) and the Prostate Cancer Fight Foundation (PCFF), and the authors would like to acknowledge with much gratitude the continual support for research at Grand River Cancer Center by RFD and PCFF.
Conflicts of Interest
None.