


1. Introduction
The hydrodynamic regime in hydrothermal systems is dominated by advective fluid flow at shallow crustal levels, controlled by thermal/chemical buoyancy-driven convective circulation under a cold/hot hydrostatic fluid pressure regime (e.g. Henley, Reference Henley1985; Hedenquist & Lowenstern, Reference Hedenquist and Lowenstern1994; Hanson, Reference Hanson1995). Permeability distribution within the rock mass primarily controls the mode of hydrothermal flow, which is typically focused along large-scale, structurally controlled zones of high permeability (e.g. Oliver, Reference Oliver1996; Sibson, Reference Sibson1996; Cartwright & Buick, Reference Cartwright and Buick1999; Cox, Knackstedt & Braun, Reference Cox, Knackstedt and Braun2001). Evidence from active and fossil hydrothermal systems indicates, in particular, that faulting of the brittle crust exerts a primary role in providing fracture-controlled, high-permeability conduits that focus fluid flow (e.g. Curewitz & Karson, Reference Curewitz and Karson1997). As such, fluid discharge along fracture-controlled fluid pathways has a significant role in genesis of epithermal ore deposits and associated alteration zones (e.g. Henley, Reference Henley1985; Sibson, Reference Sibson1987; Dipple & Ferry, Reference Dipple and Ferry1992; Cox, Knackstedt & Braun, Reference Cox, Knackstedt and Braun2001; Sheldon & Ord, Reference Sheldon and Ord2005). Structural permeability induced by faulting is intrinsically anisotropic in time and space owing to a range of possible fault zone architecture varying with displacement, host rock lithology and fault rock cementation (e.g. Caine, Evans & Forster, Reference Caine, Evans and Forster1996; Rowland & Sibson, Reference Rowland and Sibson2004). Active deformation (fracturing) is a necessary prerequisite to maintain structural permeability and to sustain fluid flow in hydrothermal systems that should be instead inhibited by rapid mineral precipitation in the permeable pathways (e.g. Sibson, Reference Sibson1987, Reference Sibson1996; Cox, Knackstedt & Braun, Reference Cox, Knackstedt and Braun2001).
Hydrothermal activity commonly occurs in regions of active tectonism associated with magmatism, where the geological structure hosts a geothermal system and input of magmatic heat promotes structurally controlled, near-surface convective upflow, fluid–rock interaction and dispersion (Henley, Reference Henley1985). The Neogene extensional domain of southern Tuscany in central Italy (Fig. 1) provides an outstanding example of both fossil and active magma-related hydrothermal systems, as attested by diffuse distribution of epithermal ore deposits, mineralized hot springs and active geothermal systems (e.g. Arisi Rota & Vighi, Reference Arisi Rota and Vighi1971; Tanelli, Reference Tanelli1983; Lattanzi, Reference Lattanzi1999; Batini et al. Reference Batini, Brogi, Lazzarotto, Liotta and Pandeli2003; Dini, Reference Dini2003; Bellani et al. Reference Bellani, Brogi, Lazzarotto, Liotta and Ranalli2004; Liotta et al. Reference Liotta, Ruggieri, Brogi, Fulignati, Dini and Nardini2009). In particular, a long-lived thermal anomaly focused by advection of heat driven by multiple granite emplacements during the last 3.8 Ma is recorded in the Larderello–Travale geothermal region (Gianelli, Manzella & Puxeddu, Reference Gianelli, Manzella and Puxeddu1997; Mongelli, Pialli & Zito, Reference Mongelli, Pialli and Zito1998; Dini et al. Reference Dini, Gianelli, Puxeddu and Ruggieri2005; Villa et al. Reference Villa, Ruggieri, Puxeddu and Bertini2006; Bertini et al. Reference Bertini, Casini, Gianelli and Pandeli2006; Boiron et al. Reference Boiron, Cathelineau, Ruggieri, Jeanningros, Gianelli and Banks2007; Rossetti et al. Reference Rossetti, Balsamo, Villa, Bouybaouenne, Faccenna and Funiciello2008). This is the area with the largest geothermal anomaly in Italy, with a maximum thermal heat flow of more than 600 mW m−2 (Mongelli, Pialli & Zito, Reference Mongelli, Pialli and Zito1998). The intimate relationships between ore deposits and active hydrothermal systems, coupled with the wealth of both geological and geophysical data acquired during geothermal exploratory activities, make the Larderello–Travale geothermal area a key region to investigate modes of hydrothermal flow (see for example Cavarretta, Gianelli & Puxeddu, Reference Cavarretta, Gianelli and Puxeddu1982; Cathelineau et al. Reference Cathelineau, Marignac, Boiron, Gianelli and Puxeddu1994; Ruggieri et al. Reference Ruggieri, Cathelineau, Boiron and Marignac1999; Ruggieri & Gianelli, Reference Ruggieri and Gianelli1999; Boyce, Fulignati & Sbrana, Reference Boyce, Fulignati and Sbrana2003). Recent investigations have elucidated fault patterns and their extensional kinematics (e.g. Brogi et al. Reference Brogi, Lazzarotto, Liotta and Ranalli2003; Rossetti et al. Reference Rossetti, Balsamo, Villa, Bouybaouenne, Faccenna and Funiciello2008) and have addressed the issue of the structural control on fluid circulation in the region (Bellani et al. Reference Bellani, Brogi, Lazzarotto, Liotta and Ranalli2004; Liotta et al. Reference Liotta, Ruggieri, Brogi, Fulignati, Dini and Nardini2009), providing a basis for formulation of the hydrological modelling of the past and present geothermal reservoir.

Figure 1. Regional geological map of the Tuscan region with location of the study area (modified and readapted after Jolivet et al. Reference Jolivet, Faccenna, Goffé, Mattei, Rossetti, Brunet, Storti, Cadet, Funiciello, D'Agostino and Parra1998). The map also illustrates distribution and age of post-orogenic magmatism (after Dini et al. Reference Dini, Innocenti, Rocchi, Tonarini and Westerman2002).
This study describes modes of fluid flow, fluid–rock interaction and alteration mineralogy within the damage zone of the Pliocene Boccheggiano extensional fault (hereafter referred to as BF; Fig. 2), which has been recognized as the main hydraulic channel for hydrothermal circulation in the southern branch of the Larderello geothermal field (Liotta et al. Reference Liotta, Ruggieri, Brogi, Fulignati, Dini and Nardini2009). The findings of this study are used (i) to propose a hydrodynamic model for fluid flow and mineralization within the damage zone of the BF, and (ii) to infer possible implications for the modalities of fault-controlled hydrothermal outflow in extensional settings.

Figure 2. Geology of the Larderello geothermal region (modified and re-adapted after Brogi et al. Reference Brogi, Lazzarotto, Liotta and Ranalli2003) and the subsurface structural architecture as reconstructed from the LAR46 seismic line. The reflections interpreted as the subsurface prolongation of the Boccheggiano Fault fade into the Montieri pluton whose summit is also known from borehole data (modified and readapted after Rossetti et al. Reference Rossetti, Balsamo, Villa, Bouybaouenne, Faccenna and Funiciello2008). The inset shows the cross-section of the Campiano ore deposit, with location of the main ore deposits (after Masotti & Favilli, Reference Masotti and Favilli1987).
2. Regional geology and the Boccheggiano mining area
The Larderello–Travale geothermal field covers an area of about 400 km2 and consists of a steam-heated reservoir (temperature of 200–350°C at a pressure of 4–7 MPa) with 28 power units for a total installed capacity of 703 MWe (Bertani, Reference Bertani2005). Available drillhole logs and geophysical and seismic data have documented that the metamorphic substratum is pervasively intruded by granitic intrusions that, together with the associated alteration caps and contact aureoles, were found at relatively shallow depth (from about 2000 m below ground level; Franceschini, Reference Franceschini1998; Boyce, Fulignati & Sbrana, Reference Boyce, Fulignati and Sbrana2003; Dini et al. Reference Dini, Gianelli, Puxeddu and Ruggieri2005; Villa et al. Reference Villa, Ruggieri, Puxeddu and Bertini2006; Bertini et al. Reference Bertini, Casini, Gianelli and Pandeli2006; Rossetti et al. Reference Rossetti, Balsamo, Villa, Bouybaouenne, Faccenna and Funiciello2008). This is the evidence of a regional-sized (at least 300 km2) intrusive complex that evolved from multiple magmatic pulses from about 3.8 to 0.7 Ma to form a major tabular granitic intrusion (Bertini et al. Reference Bertini, Casini, Gianelli and Pandeli2006; Rossetti et al. Reference Rossetti, Balsamo, Villa, Bouybaouenne, Faccenna and Funiciello2008).
Neogene extensional faulting controls localization and distribution of epithermal ore-grade sulphide mineralization (Arisi Rota & Vighi, Reference Arisi Rota and Vighi1971; Tanelli, Reference Tanelli1983). Among these, the polymetallic sulphide (Cu–Pb–Zn) deposit hosted within the damage zone of the BF constitutes by far the most important mining site for pyrite exploitation in the region, which lasted beyond the 1990s in the Campiano Mine (Fig. 2). The BF constitutes the eastern boundary of the Boccheggiano tectonic window, where the low-grade metamorphic sequences of the Tuscan Metamorphic Complex (TMC; Boccheggiano Fm) crop out (Costantini et al. Reference Costantini, Elter, Pandeli, Pascucci and Sandrelli2002) (Fig. 2). Pyrite ores occur both as sub-horizontal conformable bodies within the Boccheggiano Fm at the footwall of the BF and as veins and masses localized at the immediate hangingwall (Masotti & Favilli, Reference Masotti and Favilli1987) (see inset in Fig. 2). Sulphide mineral assemblages consist of pyrite–sphalerite, galena, chalcopyrite and tetrahedrite in association with Fe oxides and native Ag (Masotti & Favilli, Reference Masotti and Favilli1987; Corsini, Morelli & Tanelli, Reference Corsini, Morelli and Tanelli1991), which are typical of intermediate-sulphidation epithermal deposits (Einaudi, Hedenquist & Inan, Reference Einaudi, Hedenquist, Inan, Simmonds and Graham2003). The temperature of ore forming fluids was between 290 and 375°C, and the elemental and isotopic compositions of the Campiano sulphide deposits suggest that the sulphur was likely a mixture of magmatic and inorganic sources (Cortecci, Lattanzi & Tanelli, Reference Cortecci, Lattanzi and Tanelli1985; Martarelli, Ferrini & Masi, Reference Martarelli, Ferrini and Masi1995).
The LAR-46 seismic reflection profile (acquired by ENEL Green Power Electric Company for geothermal exploration purposes) provides information on both the subsurface prolongation of the BF and the lithostratigraphic and structural architecture of the Boccheggiano mining area (Rossetti et al. Reference Rossetti, Balsamo, Villa, Bouybaouenne, Faccenna and Funiciello2008; Liotta et al. Reference Liotta, Ruggieri, Brogi, Fulignati, Dini and Nardini2009). The subsurface prolongation of the BF is well imaged as a set of sinuous low-angle reflections down to about 0.5 s TWT (two-way time), corresponding to a depth of about 1 km (see also Brogi et al. Reference Brogi, Lazzarotto, Liotta and Ranalli2003). The seismic expression of the BF fades at the top of the c. 3 Ma Montieri pluton of Villa et al. (Reference Villa, Ruggieri, Puxeddu and Bertini2006), whose top surface is well imaged by a set of rather continuous reflections, culminating at the core of the Boccheggiano tectonic window (see the geological cross-section in Fig. 2).
3. Methods
Fluid–rock interactions associated with hydrothermal sulphide ore mineralization along the BF were investigated through an integrated approach that combines structural, mineralogical and geochemical data. Structural investigations were carried out both at the meso- and the micro-scale to define the linkage between faulting and hydrothermal mineralization, as well as the structural architecture across the BF. Patterns and mineralogical changes associated with the mineralized host rocks were defined by means of X-ray diffraction quantitative analyses. The volumes and possible sources for fluids involved in the hydrothermal mineralization were investigated through the application of whole-rock geochemical, fluid inclusion and stable oxygen isotope studies. The analytical methods adopted in this study are described in the Appendix.
4. Fault zone architecture and permeability structure
The BF is a part of the NW–SE-striking, E-dipping extensional fault system that controlled the structural architecture of the southern branch of the Larderello geothermal field during Pliocene–Pleistocene times (Brogi et al. Reference Brogi, Lazzarotto, Liotta and Ranalli2003; Bellani et al. 2005; Rossetti et al. Reference Rossetti, Balsamo, Villa, Bouybaouenne, Faccenna and Funiciello2008; Liotta et al. Reference Liotta, Ruggieri, Brogi, Fulignati, Dini and Nardini2009). Normal offset along the BF is estimated in the order of 1800 m (Costantini et al. Reference Costantini, Elter, Pandeli, Pascucci and Sandrelli2002). In the fault footwall, the Palaeozoic phyllites of the Boccheggiano Fm show a sub-horizontal foliation attitude and a main second-phase ductile plano-linear fabric. The fault hangingwall consists of marine siliceous-carbonate strata belonging to the Ligurian Complex (Calcari a Palombini Fm), Cretaceous in age. In the immediate hangingwall of the BF, these strata are intensively metasomatized and mineralized to form the major massive sulphide ore deposit known as the Filone di Boccheggiano (Masotti & Favilli, Reference Masotti and Favilli1987). Along the fault, the carbonate strata strike N140° and dip towards the northeast by about 25° (see also Costantini et al. Reference Costantini, Elter, Pandeli, Pascucci and Sandrelli2002).
Field studies have documented that the BF consists of two nearly parallel, low-angle NW–SE-striking extensional fault strands, linked by a N–S-striking, high-angle dextral fault segment (Rossetti et al. Reference Rossetti, Balsamo, Villa, Bouybaouenne, Faccenna and Funiciello2008) (Fig. 2). The damage zone thickness varies across strike (from about 20 to 100 m across both the footwall and the hangingwall), broadening within the N–S-striking fault zone. Within the fault damage zone, the fracture pattern consists of steeply dipping, seldom conjugated joints striking nearly subparallel to the strike of the main fault segments, i.e. NW–SE and N–S. Both the footwall and the hangingwall rocks included in the fault damage zone underwent intense metasomatic alteration during hydrothermal fluid flow and sulphide ore deposition. Alteration mostly obliterated the original (primary and secondary) rock fabrics, which are preserved only in a few outcrops. The fault rocks include a c. 30 m thick damage zone, which encloses a c. 1 m thick fault core (Fig. 3a). Rock fabric in the damage zone is distinctly different when moving from the footwall to the hangingwall of the fault. Footwall rocks are affected by a set of low-angle (average dip 40°), E-dipping anastomosing extensional fault systems synthetic to the shear transport direction of the BF (Fig. 3a, b). Sub-horizontal, foliation-parallel, quartz-sulphide vein (1–2 to 50 cm across) arrays and breccia bodies also occur within the footwall rocks and are cut across by the E-dipping fault systems (Fig. 3c, d). In the fault hangingwall, exposed rocks show a massive aspect and the fabric is dominated by a conjugate set of high-angle, closely spaced joints and veins with apertures between about 0.1 and 3 mm (Fig. 3e). Attitude and aperture of these joints are kinematically consistent with the fault slip. A subordinate set of joints strikes N50° and dips towards the northwest by about 70° (Fig. 3a). Late sulphate mineralization also occurs across the fault core in both the footwall and hangingwall rocks, permeating the pre-existing fracture pattern (Fig. 3f).

Figure 3. (a) Studied exposure of the Boccheggiano Fault. The main ore deposit (Filone di Boccheggiano) is located in the immediate hangingwall of the fault. To the left: stereographic projections (Schmidt equal-area net, lower hemisphere) of representative structural data collected within the damage zone of the BF: (top) fault planes with slickenlines at the footwall of the fault (TMC); (bottom) fracture planes at the fault hangingwall. Fault and fracture planes as great circles; slickenlines as arrows. (b) Sub-horizontal quartz-sulphide breccia veins in the TMC at footwall of the BF. Note that extensional faults cut across the veins. (c) Enlargement of (b) showing the alteration halos surrounding the veins. (d) Sub-horizontal quartz veins and associated mineral alteration at the footwall of the BF. Note the sub-horizontal attitude of foliation in the TMC rocks. (e) Brittle tectonic fabric (fault fracture meshes) in the immediate hangingwall of the BF (i.e. about 5 m from the principal fault surface). (f) Sulphate mineralization decorating the fracture systems within the damage zone of the BF. See http://journals.cambridge.org/geo for a colour version of this figure.
The fault core thickness is variable along the fault and the fault core and includes (i) an inner dark, 60–70 cm thick layer of cohesive foliated phyllosilicate-rich gouge (phyllonite); and (ii) an outer 120–130 cm thick layer of fault breccia (Figs 3a, 4a). Microphotographs obtained from impregnated samples of the fault gouge show that the core consists of a few isolated sub-rounded survivor grains, most of which are less than 1 mm in size (Fig. 4b). These grains, made of fragments of both metamorphic host rock (predominantly composed of white mica and quartz) and quartz-pyrite veins, are embedded within a clayey matrix. The remainder of the phyllonite is made dominantly of quartz microlithons (mostly relict veins) and minor opaques. Pyrite crystals are also disseminated within the phyllonite matrix. The fault breccia consists of angular and coarse grains with a diameter generally larger than 1 mm (Fig. 4c). By using the Optimas 6.51 software for image analysis produced by Media Cybernetics (Silver Spring, Maryland, USA), we determined the size distribution (e.g. Francus, Reference Francus1998) of the coarse grains as displayed in the differently magnified images shown in Figure 5 (760 × 560 pixels, resolution 253 dpi). For each detected grain, the software semi-automatically computed the diameter (here named equivalent diameter) of a circle with the same area as the grain area. The obtained equivalent diameters are plotted against the relative numbers of data. Results show that the fault gouge consists of some isolated survivor grains, which mainly range in size between 0.063 and 0.032 mm (i.e. sand- to silt-size grains; Fig. 5a). These grains are embedded within a matrix whose grain size mostly spans the fine domain of the clay sizes (Fig. 5b).

Figure 4. (a) The fault core of the Boccheggiano Fault. Transition from a cohesive fault breccia to a fine-grained fault gouge is observed. (b) Thin-section microphotograph of the fault gouge (natural light) showing cataclastic fabric with survivor grains surrounded by a very fine-grained matrix. Contacts among coarse grains are absent or very rare. (c) Thin-section microphotograph of the Boccheggiano Fault breccia showing an early stage of the cataclastic process as inferred from the size of the grains (i.e. significantly larger than those forming the adjacent fault gouge) and from the numerous contacts among the coarse grains. Pr – pyrite; Qz – quartz.

Figure 5. Representative histograms showing the 2D grain size distribution within the fault gouge of the Boccheggiano Fault as determined after the image analyses of microphotographs. The measured grains are only those measurable in the considered photographs (i.e. only the coarsest grains; d – equivalent diameter of grains; n – number of grains). (a) Survivor grains. (b) Matrix grains.
To infer information about the hydraulic properties of the fault hangingwall and footwall, we measured the abundance of fractures and the fault-related porosity in the related rocks (i.e. from the fault hangingwall and footwall; see Fig. A1 in the online Appendix at http://journals.cambridge.org/geo). The fracture abundance was determined by the circle-inventory method (Titley, Reference Titley1976; Davis & Reynolds, Reference Davis and Reynolds1996). In this method, the fracture abundance (ρf) is defined as the total length of all fractures (L) within a significant (i.e. for the fracture abundance) inventory circle of radius r divided by the area of the circle itself, according to the following expression:
where ρf is measured in units of length/area (hereafter referred to as mm−1). Results are expressed in mm−1 and show that the fracture abundance of the fault hangingwall is about three orders of magnitude greater than the fracture abundance from the fault footwall (0.1761 versus 0.0005 mm−1; see Fig. A1 in the online Appendix at http://journals.cambridge.org/geo). The fracture-related porosity was determined by a circle-inventory modified method (Billi et al. Reference Billi, Valle, Brilli, Faccenna and Funiciello2007). Results show that the fracture-related porosity of the fault hangingwall is about one order of magnitude greater than that of the fault footwall (12:2). It should be noted that these porosity values are estimates done on the exposed rocks. The same rocks under different boundary conditions (i.e. in the subsurface) may be characterized by significantly different porosities.
5. Mineralized zones and vein textures
Sulphide mineralization occurs disseminated within the damage zone of the BF, dominantly within quartz vein ore bodies. Distinct structural characteristics are observed when moving from the footwall to the hangingwall of the BF (Fig. 3). In the footwall, mineralized zones are observed for a maximum distance of about 20 m from the fault core, and consist of multi-stage, sub-horizontal quartz-sulphide veins, including breccia veins, up to 50 cm thick (Fig. 3b, c). Veins are largely composed of quartz, but occasionally contain minor adularia, white mica and disseminated sulphide grains. Pale, centimetre to decimetre thick alteration zones are systematically associated with the veins that commonly lie within the fault zones, documenting an overall pre-faulting veining (Fig. 3b, d). Breccia veins form discontinuous pinch and swell massive bodies (Fig. 3b), made of hydrothermally altered TMC angular wall rock and vein fragments supported by a matrix of quartz-sulphide minerals (Fig. 6a, b). Quartz typically exhibits a blocky texture (e.g. Bons, Reference Bons, Jessell and Urai2000), with multiple episodes of fracture opening and mineral precipitation (crack-sealing/healing processes) (Fig. 6c). Texturally late brecciation and fracturing of the previously sutured intragranular quartz contacts are commonly observed and adularia-pyrite with minor illite segregations commonly constitutes the cement filling the voids (size 50–100 μm) (Fig. 6c, d). The main ore bodies occur in the immediate hangingwall of the BF and are irregular in shape, dominantly controlled by well-developed fault fracture meshes, which formed an interconnected high permeability network (Fig. 3e). Sulphide ore minerals dominantly occur as open-space filling in a strongly altered, highly siliceous, vuggy rock matrix (Fig. 6e). Quartz and adularia are the dominant gangue minerals that make up the vein fill, together with variable amounts of pyrite. Euhedral blocky textures in quartz are common, with well-preserved growth zoning marked by dense arrays of fluid inclusions (Fig. 6f). The size of the quartz crystals in the vein commonly ranges from 0.1 to 2 mm and the pores between quartz crystals are commonly filled by pyrite and anhedral adularia. These textural features are indicative of advective fluid flow regimes (Oliver & Bons, Reference Oliver and Bons2001) and argue for high rates of fluid ascent during blocky vein formation (Okamoto & Tsuchiya, Reference Okamoto and Tsuchiya2009).

Figure 6. (a) Photograph of rock slab showing textures of veins and breccias in the footwall of the Boccheggiano Fault, with abundant pyrite mineralization hosted by quartz. (b) Microtexture at the thin-section scale (natural light) of the rock slab shown in (a), showing brecciated wall-rock fragments (WRF), healed by quartz–pyrite ore. (c) Quartz microtextures in sample (a) show multiple episodes of healed microfractures, marked by arrays of fluid inclusions (crossed polars). (d) Multiphase fracturing and brecciation at the thin-section scale for sample shown in (a), healed by quartz–adularia sulphide ore (crossed polars). (e) Photograph of rock slab showing sulphide ore mineralization in the Filone di Boccheggiano, hosted by quartz–adularia–sericite gangue. (f) Thin-section of the sample shown in (e) showing euhedral quartz grain with well-preserved growth structures marked by dense arrays of fluid inclusions. Ad – adularia; Ms – muscovite; Pr – pyrite; Qz – quartz; WRF – wall-rock fragments.
6. Fluid inclusion data
A fluid inclusion study was carried out on quartz separates from both footwall (F3 samples) and hangingwall (FIL samples) vein quartz ore bodies. Samples were prepared as 200 μm thick, doubly polished sections, then observed with a polarized microscope to define types of fluid inclusions and their genetic relationships, and analysed to study physico-chemical characteristics and origin of the segregating fluid.
6.a. Hangingwall veins (FIL samples)
Two compositional types of fluid inclusions have been detected in euhedral inner quartz crystals from FIL samples: (i) Type-1, three-phase liquid aqueous, liquid carbonic and vapour carbonic (Laq + Lcar + Vcar), H2O–CO2 inclusions, and (ii) Type-2, two-phase liquid and vapour (L + V), L-rich, H2O–NaCl inclusions (Fig. 7a). Type-1 inclusions are mainly V-rich, with the carbonic volumetric fraction ranging from about 50 to 90%; CO2 is nearly equally partitioned between the liquid and gas phases. They occur as isolated clusters or small trails, trapped in the cores of the inner quartz crystals of the veins. Type-2 inclusions occur within the quartz growth zones, but also in association with Type-1 inclusions in the inner cores of the quartz crystals. They also occur as intragranular and intergranular trails (Fig. 7a). No evidence of CO2 or other gases has been observed in Type-2 fluid inclusions. Type-1 fluid inclusions have dimensions up to 25–30 μm; Type-2 are smaller and their sizes reach 10–15 μm. Based on petrographic observation, Type-1 fluid inclusions are considered the earliest generation, together with the Type-2 ones marking the inner growth zoning domains. Intragranular rows of Type-2 fluid inclusions are instead considered late. The outer rims of the quartz crystals are outlined by abundant Type-2 fluid inclusions, which form sequential bands delineating the last incremental quartz growth stage. Because of their optical darkness, no analytical measurement was carried out on this type of fluid inclusion. Furthermore, fluid inclusions hosted within the intergranular fracture arrays are too small to be microthermometrically measured.

Figure 7. (a) Schematic line drawing of the fluid inclusion types and characteristics hosted in the quartz crystals associated with the ore mineralization in the Filone di Boccheggiano (FIL sample). (b) Primary and secondary Type-2 inclusions hosted in quartz from brecciated sulphide veins at the footwall of the Boccheggiano Fault (F3 sample). (c) Decrepitated fluid inclusions hosted in quartz from brecciated sulphide veins from F3 sample.
6.b. Footwall veins (F3 samples)
Well visible are dense arrays of fluid inclusions along healed microfracture trails, with mutual overprinting relationships (Fig. 7c). This microtextural arrangement did not always allow an accurate assessment of temporal relationships between trapped fluid inclusions. The presence of bigger (up to 25–30 μm) and more isolated and randomly distributed inclusions should indicate an earlier origin compared to the various trails. Early fluid inclusions are distinguished from late inclusions by shape and size (Fig. 7b). The former show irregular shape and dimension, whereas the latter are very uniform in shape (oval, rectangular, cubic) and their sizes reach 10–15 μm. The latest trapping event (intergranular trails) is evidenced by fluid inclusions too small to be microthermometrically measured. Both early and late fluid inclusions contain two phases, L + V (Type-2), with the liquid being dominant over the vapour with a constant V/V + L ratio (Fig. 7b). Nevertheless, scattered cases of V-rich inclusions have been observed. No sign of gas in the vapour phase was recorded. Finally, the presence of big (up to 40 μm), mostly decrepitated inclusions were also observed, and for them it might be suggested an earlier origin compared to the various trails (Fig. 7c).
6.c. Microthermometry
Conventional freezing and heating microthermometric analyses were carried out according to the procedure outlined in the Appendix. We measured inclusions occurring either in isolated clusters or within intragrain trails (Type-1 and -2 in FIL and F3 samples) and those defining the quartz growth zoning (Type-2 in FIL samples). In the FIL samples, Type-1 fluid inclusions have a temperature of melting of the vapour phase Tm(V) at −56.6°C, indicating the trapped gas is pure CO2. Temperatures of homogenization of the carbonic phase (Th-car) are very consistent and group at +31°C, homogenizing in the majority of cases to the vapour phase (see Fig. A2 in the online Appendix at http://journals.cambridge.org/geo); in a few cases they show fading of the meniscus between Lcar and Vcar, probably towards the liquid carbonic phase. When detected, total homogenization for the three-phase fluid inclusions occurred to the vapour phase at temperatures (Th-tot) ranging between 270 and 290°C. Type-2 fluid inclusions from intragrain trails show Th values from 220 to 310°C, with a distinctive peak at 250–260°C (see Fig. A2 in the online Appendix at http://journals.cambridge.org/geo). Apparent salinity values as converted from final melting temperature of ice (Tm-ice) span from 0 to 9 wt% NaCl equiv., with a gap between 3 and 6 wt% NaCl equiv. (Fig. 8). Apparent salinity data within the single trails are very consistent. It was not possible to measure any eutectic temperatures (Te). Since Type-2 inclusions froze at about −36°C, we excluded the presence of cations other than Na and considered the fluid as a H2O–NaCl system. In an inner quartz vein crystal from the FIL samples, occurrence in the same group of coexisting three-phase V-rich and two-phase L-rich inclusions was also observed. Microthermometric results indicate they homogenize to the vapour and the liquid at around 290°C and 250°C, respectively, indicating fluid immiscibility.

Figure 8. Homogenization temperature (Th)–salinity diagram for quartz ore veins from both the fault hangingwall (FIL samples) and footwall (F3 samples).
In the F3 samples, homogenization temperatures between liquid and vapour range from 250 to 360°C, clustering at 280–290°C. Rare cases of homogenization to the vapour phase have been measured at 360°C (see Fig. A2 in the online Appendix at http://journals.cambridge.org/geo). No sign of gas in the vapour phase was detected. Salinity values range from 0 up to 7 wt% NaCl equiv. (Fig. 8). Only two Te measurements were obtained at about −23°C. Analogously to the FIL samples, since the inclusions froze between −35 and −40°C, we excluded the presence of different cations besides Na. The occurrence of L-rich and V-rich inclusions in the same group has been observed in a few cases, homogenizing at about 290–300°C to the liquid and to the vapour, respectively. This suggests that a boiling episode might have occurred.
Collectively, these data indicate that homogenization temperatures were about 30°C higher for the fluid inclusions hosted in the F3 samples with respect to those hosted in the FIL ones. Microthermometric data are quite consistent, indicating the fluid(s) did not experience significant thermal change during the trapping events. On the other hand, the Th versus salinity diagram (Fig. 8) shows an isothermal mixing/dilution trend between a low-medium salinity (9–7 wt% NaCl equiv.) fluid and an essentially salt-free meteoric water.
7. Wall rock alteration
7.a. Alteration mineralogy and zoning
A suite of 17 samples was collected along a 500 m long transect and analysed by XRD diffraction in order to evaluate modes and types of hydrothermal alteration across the BF, and to define the mineralogical assemblages associated with the texturally late sulphate mineralization episode. Four samples are from the hangingwall rocks (Ligurian units) and the fault gouge, five from the footwall rocks (Tuscan Metamorphic Complex). Three additional samples were collected from veins parallel to the main foliation in the footwall and one from the late-stage sulphate mineralization (Fig. 9a, b). XRD qualitative and quantitative analysis of the whole-rock mineralogy and the <2 μm grain-size fraction is shown in Tables 1 and 2, respectively. Hydrothermal alteration types are described here using the nomenclature based on the dominant mineral (or group of minerals) that characterizes each assemblage (e.g. Reyes, Reference Reyes1990).

Figure 9. (a) Schematic geological cross-section across the BF with sample locations. (b) Enlargement of (a) showing the fault rock architecture across the fault core with related mineralogical assemblages. (c) Selected X-ray diffraction patterns of the whole-rock composition (to the right) and of the oriented, air dried (AD) and ethylene glycol-solvated (EG) mounts (to the left) of samples F150, C6 and P50. Cal – calcite; Chl – chlorite; C-S – chlorite-smectite mixed layers; Go – goethite; I – illite; I-S – illite-smectite mixed layers; Jar – jarosite; K – kaolinite; KWM – K-white mica; Pg – paragonite; Qtz – quartz.
Table 1. Mineralogy of the whole-rock samples

Abbreviations: Qtz – quartz; Cal – calcite; Kfs – K-feldspar; KWM – K-white mica; Pg – paragonite; K – kaolinite; Chl – chlorite; I-S – illite–smectite mixed layers; C-S – chlorite–smectite mixed layers; Sm – smectite; Jar – jarosite; Pr – pyrite; Go – goethite. ** – major phase; * – minor phase.
Table 2. X-ray quantitative analysis of the <2 μm grain-size fraction

Abbreviations: Sm – smectite; I – illite; Pg – paragonite; I-S – illite–smectite mixed layers; C-S – chlorite–smectite mixed layers; K – kaolinite; Chl – chlorite; R – stacking order (Jagodzinski, Reference Jagodzinski1949); % I in I-S – illite content in illite–smectite mixed layers; % C in C-S – chlorite content in chlorite–smectite mixed layers; tr – trace; Qtz – quartz; Jar – jarosite; Go – goethite; Pr – pyrite; Cal – calcite.
In the footwall rocks, an unaltered sample (F150; Fig. 9c) is characterized by quartz, K-white mica, chlorite and subordinate paragonite. Minor amounts of albite and graphite locally observed in the Tuscan Metamorphic Complex by Costantini et al. (Reference Costantini, Elter, Pandeli, Pascucci and Sandrelli2002) were not identified. Among major minerals, chlorite abruptly decreases in concentration and K-white mica alters in a series of fine-grained and interstratified minerals moving towards the fault zone. Retrograde alteration of high-temperature micas is accompanied by a loss in sharpness of the 001 peak and progressive formation of small illite particles and low expandable mixed-layer illite-smectite (sample C6; Fig. 9c). In the <2 μm grain-size fraction, illite is ubiquitous and kaolinite increases in abundance towards the fault plane reaching the maximum concentration at the contact with the mineralized fault gouge (sample C10; Fig. 9b; Table 2). Alteration selvages around quartz + pyrite veins consist of quartz, K-feldspar (adularia), illite, jarosite, goethite and kaolinite, a mineral assemblage that suggests multiple episodes of mineral deposition and chemical weathering. The fault gouge samples (C6, C7, C9, C10) mainly consist of quartz, K-white mica and pyrite. Calcite, jarosite and goethite are present as minor phases. In their <2 μm fractions, illite is the most abundant clay mineral; smectite and kaolinite are found in minor quantities and mixed-layer illite-smectite occurs only in small amounts (<2%). Chlorite is absent. This alteration assemblage is compatible with the argillic alteration type.
In the hangingwall rocks, an unaltered sample (P50; Fig. 9c) from the Ligurian unit is mainly composed of quartz, calcite, K-white mica and clay minerals such as chlorite and mixed-layers illite-smectite and chlorite-smectite. Moving towards the fault zone, calcite disappears and K-feldspar (adularia) crystallizes (samples P25 and P10). Goethite was observed in the most altered sample. In the <2 μm grain-size fractions, illite progressively decreases in abundance from 52 to 20% and mixed-layer illite-smectite increases from 6 to 58%. This trend is diagnostic of the illite alteration type.
Samples of the late mineralization document the occurrence of different kinds of hydrated Fe-sulphates (paracoquimbite, coquimbite) and Fe-sulphate hydroxides (ferricopiapite, copiapite) associated with quartz.
7.b. Whole-rock geochemistry and mass balance
The nature and extent of the alteration processes in the fault zone rocks were quantified by comparing the whole-rock chemistry of the damage zone rocks to that of their undeformed protoliths, based on a suite of samples collected along the profile shown in Figure 9a. The protoliths were defined by the average composition of three samples arbitrarily distributed over several hundreds of metres at the fault footwall (TMC; sample F150 in Fig. 9; Table 3) and hangingwall (Ligurian Complex; sample P50 in Fig. 9; Table 3). Standard deviations for most major elements are typically below 1%, indicating little compositional variation within the selected lithologies. In order to reduce the influence of unhomogeneities caused by ore bodies within the damage zone of the BF, samples were collected carefully excluding quartz and sulphide veins.
Table 3. Representative whole-rock data of altered and unaltered samples of footwall and hangingwall rocks from the damage zone of the Boccheggiano Fault

Element gains and losses were calculated by the mass balance isocon method of Grant (Reference Grant1986). Plotting C 0 versus CA of immobile elements defines a line that passes through the origin (the isocon line), whose equation is as follows:
where C 0 and CA are the element concentrations in the unaltered and altered rocks, respectively, MA is the mass of the altered rock and M 0 is the mass of the protolith. The slope of the isocon (M 0/MA) is obtained from a best-fit of the analytical data forming a linear array through the origin; the variation in the absolute concentrations of the elements (ΔCi) from the unaltered to the altered rocks is given by the equation:
Calculations were obtained though the software GEOISO (Coelho, 2005). The results of the major element mass balance calculations are different when moving from the footwall to the hangingwall rocks of the BF (Fig. 10). In the TMC footwall rocks, mass balance was carried out by comparing the protolith composition with an average composition obtained from four samples collected within the alteration zone from 5 to 10 m from the fault core (sample F2 in Fig. 9 and Table 3). The isocon line was calculated using Ti, Cr and Ge as immobile elements, which gives M 0/MA = 0.68, corresponding to a ~47% mass gain and a ~53% volume increase (Fig. 10a). For the major elements, this was achieved by removal of Ca, by the almost total removal of Mg (decrease of 70%), Mn (decrease of 85%), Na (decrease of 88%), and by reduction of P (decrease of 29%), Al (decrease of 23%) and LOI. These depletions are in part counterbalanced by the increase of Si (increase of 92%), K (increase of 50%) and Fe (increase of 40%). Among the trace elements, Rb and Ba show significant gains, which correlates well with the high K2O content and illitization of the alteration zone. For the base and precious metals, Cu and Ag concentrations show significant increases (enrichment by >18 times); As is also enriched (~6 times), while Ni and Zn show depletions.

Figure 10. Element abundance within different portions of the damage zone of the BF versus original wall rock abundances, scaled by random factors. (a) Footwall of the fault; (b) and (c) hangingwall of the fault. Major element abundances are in wt% oxides; trace elements are in ppm. Dashed line is the constant mass reference frame. C 0 – unaltered composition; CA – altered composition. Data from the profile shown in Figure 9 and reported in Table 3.
In the Ligurian hangingwall rocks, the wall rock alteration was calculated by comparing the protolith composition with the composition of samples obtained from the alteration zone at different distances from the fault core: (i) an average composition obtained from three samples collected at c. 10 m from the fault core (sample P10 in Fig. 9; Table 3), where the major alteration is observed, and (ii) a composition obtained from samples of the Filone di Boccheggiano, in the immediate fault hangingwall (sample H1 in Fig. 9; Table 3). For sample P10, the isocon line was constructed using Ti, Cd and Y as immobile elements, which gives M 0/MA = 0.74, corresponding to a ~36% mass gain and a ~42% volume increase (Fig. 10b). Intense silicification is documented by the sole gain of SiO2 (increase of 132%) and the total depletion of the other major elements, with the removal of Na2O and the almost total removal of CaO and MgO (decrease of 98 and 91%, respectively). Depletions in Fe2O3, P2O5, LOI and Al2O3 are significant (decrease of 83, 81, 56, and 51%, respectively); depletion in K2O is minor (decrease of 21%). Also in this case, alteration is associated with an enrichment in Ag (>6 times) and As (>3 times). No Cu enrichment is reported, while the Rb and Ba gains are compatible with adularia crystallization.
For sample H1, whole-rock analytical data show the systematic decrease of most of the element concentrations (also those commonly assumed to be immobile, such as Al, Ti, Zr and Y) and an abrupt increase in Si (Fig. 10c). The isocon line was calculated using Cs and Sm as immobile elements, which gives M 0/MA = 0.46, corresponding to a ~119% mass gain and a ~109% volume increase. Notable among the major elements is the enrichment of SiO2 by >2 times and the gain in Fe2O3 (increase of 47%), compensated by the almost total removal of Al, Na, Ca, Mg, Mn and K. Particularly significant is the enrichment of metals such as As (>60 times), Cd, Yb and Ag (>12 times).
8. Stable isotope analyses
Oxygen isotope analysis was performed on quartz samples collected from sulphide veins both in the footwall and in the hangingwall of the BF. The isotopic compositions of the quartz veins range from 8.31‰ to 10.15‰ (footwall) and 8.05‰ to 9.67‰ (hangingwall), respectively. For the full results see Table A1 in the online Appendix at http://journals.cambridge.org/geo. The average values of the two types of quartz (9.0‰ and 9.1‰ for the footwall and the hangingwall, respectively) indicate that both deposits equilibrated isotopically with the same oxygen reservoir. The temperature of equilibration of about 300°C, measured from fluid inclusion microthermometric determinations (this study and Liotta et al. Reference Liotta, Ruggieri, Brogi, Fulignati, Dini and Nardini2009), allows us to calculate the isotopic composition of the water phase of the fluid where quartz precipitated. This estimation requires crucial assumption of isotopic equilibrium and the choice of one of the many experimental and theoretical expressions relating the isotopic compositions of water, quartz and temperature. Using the equation of Clayton, O'Neil & Mayeda (Reference Clayton, O'Neil and Mayeda1972) recalculated by Friedman & O'Neil (Reference Friedman, O'neil and Fleischer1977), it was inferred that the formation of quartz occurred within a fluid whose aqueous phase isotope composition was bracketed between 0.55 and 2.39‰ and 0.29 and 1.91‰ for the footwall and the hangingwall veins, respectively. Also taking into consideration the data reported in Liotta et al. (Reference Liotta, Ruggieri, Brogi, Fulignati, Dini and Nardini2009), the isotopic water composition can be interpreted in terms of mixing of meteoric water and the aqueous component of fluids of magmatic provenance and/or isotopically equilibrated with the host rocks. It is furthermore evident that quartz–sulphide segregation and genesis of the Filone di Boccheggiano derived from the same fluid system, under similar thermal conditions.
9. Discussion
Fault rocks across the BF were infiltrated by fluids that changed their structural fabric, mineralogy and major element geochemistry. The presence of an active fluid phase within the damage zone of the BF is indicated by (i) veining and mineralized breccias in the phyllonite gouge, and (ii) precipitation of an interconnected network of phyllosilicate aggregates in cataclasites, which suggests that fluid-assisted diffusive mass transfer operated during formation of the phyllonite gouge (see also Jefferies et al. Reference Jefferies, Holdsworth, Wibberley, Shimamoto, Spiers, Niemeijer and Lloyd2006). Geochemical alteration features across the fault document that fluid circulation was systematically associated with the removal of Ca, Mg, Na and Al from the protoliths, largely compensated by Si (and partly K) enrichment that is maximum in the immediate hangingwall of the fault. This general pattern of rock alteration and element mobility is predicted to occur during down-temperature fluid flow (Dipple & Ferry, Reference Dipple and Ferry1992), a flow regime commonly predicted for active hydrothermal systems (e.g. Henley, Reference Henley1985).
Collectively, the ore-associated dominant argillitic alteration mineralogy and zoning within the damage zone of the BF, as well as the textures dominated by multiple episodes of mineral deposition and fracturing show characteristics typical of the low-sulphidation (near-neutral pH) epithermal environments (e.g. Giggenbach, Reference Giggenbach1992; White & Hedenquist, Reference White and Hedenquist1995; Einaudi, Hedenquist & Inan, Reference Einaudi, Hedenquist, Inan, Simmonds and Graham2003; Simmons, White & John, Reference Simmons, White and John2005). This is in accordance with (i) the presence of adularia and illite associated with quartz as the main gangue minerals in the ore deposits and (ii) the isotopic signature and the trend in fluid mixing evidenced by the fluid inclusions (see also Liotta et al. Reference Liotta, Ruggieri, Brogi, Fulignati, Dini and Nardini2009), both documenting a fluid dominated by a meteoric supply. Approaching the core of the BF (in both the footwall and hangingwall rocks) and in alteration selvages surrounding the quartz ore veins in the footwall, an incipient advanced style of argillitic alteration is also present, as indicated by kaolinite associated with jarosite. The increase of kaolinite abundance towards the fault core suggests a high degree of fluid–rock interaction, attesting that the major palaeofluid conduits were created in the rock volume adjacent to the fault core. The presence of smectite in the fault core (Fig. 9b) reflects changes in chemical and fluid–rock conditions, since its crystallization together with kaolinite strongly depends on pH or Na+/H+ or Ca2+/H+ variations (Velde, Reference Velde1985). It is thus deduced that the high-permeability conduits within the damage zone of the BF also constituted preferred pathways for degassing of the hydrothermal system, with formation of steam-heated acid-sulphate waters from oxidation of H2S (cf. Giggenbach, Reference Giggenbach1992). This argues for late-stage acid-sulphate alteration of the low-sulphidation system during post-hydrothermal weathering of the sulphide minerals, typical of the epithermal discharge of steam-heated acid waters convecting into the upper part of a hydrothermal system (e.g. Henley, Reference Henley1985; White & Hedenquist, Reference White and Hedenquist1995).
9.a. P–T conditions of fluid entrapment
The microthermometric results may contribute to elucidating the physico-chemical process associated with sulphide ore formation during hydrothermal outflow along the damage zone of the BF. The presence of coeval CO2-rich fluid inclusions and L-rich aqueous inclusions in the mineralizing fluids responsible for formation of the Filone di Boccheggiano ore (FIL samples) documents a fluid immiscibility at the time of the inclusion formation that occurred during the rising of the fluids along the conduits (Hedenquist & Lowerstern, Reference Hedenquist and Lowenstern1994; Bodnar, Reference Bodnar and Thompson1995 and references therein). It is known that in this case, homogenization temperatures can be considered as the trapping temperature (Roedder, Reference Roedder1984), and isochores of immiscible saline fluids and CO2-rich inclusions provide constraints on the fluid pressure–temperature (P–T) trapping conditions during quartz vein formation (cf. Bodnar, Reference Bodnar and Thompson1995). In F3 samples, the occurrence, even though sporadic, of L-rich and V-rich Type-2 inclusions in the same group, homogenizing at about the same temperature (290–300°C) to the liquid and to the vapour phase respectively, suggests that episodic boiling conditions occurred during the footwall vein formation. Homogenization temperatures can be considered as well as trapping temperatures (Roedder, Reference Roedder1984).
Fluid inclusion isochores (Fig. 11) have been constructed using the program package FLUIDS by Bakker (Reference Bakker2003). Isochores were chosen considering two representative fluid inclusions for each type and sample: (i) two for the aqueous Type-2 inclusions of the FIL samples, labelled a and c; (ii) two for the Type-1 carbonic inclusions of the FIL samples, labelled e and f; and (iii) two for the aqueous Type-2 inclusions of the F3 samples, labelled as b and d. Calculations were based on the equations of state of Sterner and Bodnar (Reference Sterner and Bodnar1991) for isochores a, e and f; Haar, Gallagher, & Kell (Reference Haar, Gallagher and Kell1984) for isochores b and d; and Knight & Bodnar (Reference Knight and Bodnar1989) and Bodnar & Vityk (Reference Bodnar, Vityk, De Vivo and Frezzotti1994) for isochore c. Density values range from 0.80 (isochore a) to 0.20 (isochore f) g cm−3. We then assumed a palaeogeothermal gradient of 90°C km−1, as reconstructed from the in-depth mineralogical zonation in the basement rocks of the Montieri area hosting the southern branch of the Larderello geothermal field (Rossetti et al. Reference Rossetti, Balsamo, Villa, Bouybaouenne, Faccenna and Funiciello2008). Lithostatic and hydrostatic thermobaric gradients are based on 27 MPa km−1 and 10 MPa km−1, respectively. The P–T field defined by intersections of isochores is consistent with the hydrostatic thermobaric gradient of 90°C km−1. Accordingly, the minimum trapping pressure for fluid inclusions ranges between 30 and 50 MPa for temperatures in the order of 300–350°C (stage II in Fig. 11). Intersections of the isochores a, b and c with the lithostatic gradient line define maximum trapping conditions of 80–130 MPa (stage I in Fig. 11) and argue for nearly isothermal transient and fluctuating fluid pressure conditions (from (supra)lithostatic to hydrostatic) within the damage zone of the BF during sulphide ore mineralization. Textures in the wall rocks provide evidence for fracturing and subsequent crack-sealing by precipitation of quartz–adularia–sulphide assemblages. In addition, evidence for pressure changes during fluid infiltration along the BF can be also deduced by the decrepitation textures in some of the fluid inclusion assemblages (Fig. 7c; see Oliver et al. Reference Oliver, Rubenach, Fu, Baker, Blenkinsop, Cleverley, Marshall and Ridd2006) and is consistent with boiling of the hydrothermal fluids.
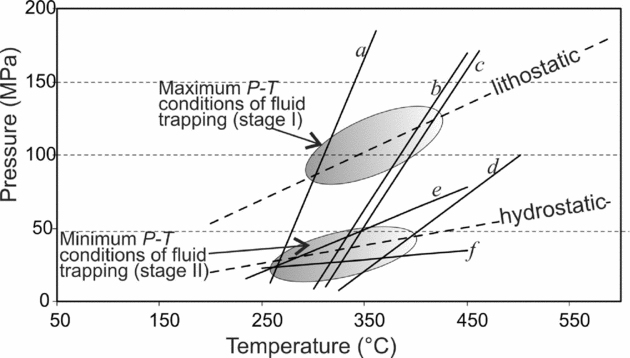
Figure 11. Pressure–temperature diagram with isochores for the different types of fluid inclusions: Type-1 CO2-bearing and aqueous Type-2 fluid inclusions hosted in quartz veins from the Boccheggiano ore deposit. Crossing of isochores of the two coeval immiscible fluids defines their trapping conditions. Also shown are lithostatic and hydrostatic thermobaric gradients based on a palaeogeothermal gradient of 90°C km−1 (see text for further details).
9.b. Fluid fluxes and the hydraulic transmissivity model
As most of the protolith rocks cut across by the BF are quartz-bearing, the Si content in the fault rocks is likely to reflect changes in solubility due to the decreasing temperatures of the infiltrating fluids. The amount of quartz precipitated/dissolved in an advective flow regime can be then used to constrain the volume of metasomatizing fluids, assuming local fluid–rock equilibrium and ignoring dispersion (e.g. Streit & Cox, Reference Streit and Cox1998; Cartwright & Buick, Reference Cartwright and Buick1999). In these calculations it is also assumed that silica solubility in the circulating fluids is approximately that of SiO2 in pure water and that silica precipitation was controlled only by changes in P–T (e.g. Fournier & Potter, Reference Fournier and Potter1982). This is justified by the fluid inclusion results, documenting the presence of two-phase, low salinity, H2O-dominated fluid inclusions in mineralized quartz veins from the damage zone of the BF.
Understanding these assumptions, fluid fluxes, q (in mol m−2), can be calculated via the equation (Dipple & Ferry, Reference Dipple and Ferry1992):
where ni is the change in concentration of the element i during alteration, (∂Xi/∂T)P and (∂Xi/∂P)T are the temperature and pressure dependencies, respectively, of the solubility of species i, and dT/dz and dP/dz are the temperature and pressure gradients along the fluid flow path, respectively. Being that the pressure dependency of quartz solubility is less significant than its temperature dependency, the second term of the denominator of equation (4) is commonly discounted when calculating fluid fluxes (e.g. Dipple & Ferry, Reference Dipple and Ferry1992; Cartwright & Buick, Reference Cartwright and Buick1999).
In the damage zone of the BF, increase of SiO2 is distinctly different when moving from the footwall to the hangingwall rocks (Table 3), with values ranging from 40 to 140 g per 100 g, or, based on the rock density values shown in Table 3, from 1.8 × 10⁴ to 6.2 × 10⁵ mol Si m−3. For the calculation we employed a temperature of 300–350°C, as deduced from the fluid inclusion data presented in this study and the available thermometric data for the ore stage (Martarelli, Ferrini & Masi, Reference Martarelli, Ferrini and Masi1995), and an average background temperature gradient during alteration of 90°C km−1 (0.09°C m−1). The temperature derivative of the quartz solubility at 300°C is in the order of 5 × 10⁻⁵ (Rimstidt, Reference Rimstidt1997). Given these parameters, time integrated fluid fluxes in the damage zone of the BF range between c. 4 × 10⁹ and 1 × 10¹⁰ mol m−2, when moving from the footwall to the hangingwall rocks, respectively (Fig. 12).

Figure 12. Curve showing the time integrated fluid flux q versus mass of quartz precipitated per 100 g of protolith (temperature of c. 300°C; rock density from Table 3) for the damage zone of the Boccheggiano Fault. The shaded areas represent the ranges of Si mobility for both footwall and hangingwall alteration (see text for further details).
These data indicate that fluid flow in the damage zone of the BF was highly concentrated in the immediate hangingwall of the fault, with flow magnitudes higher for the hangingwall than for the footwall rocks. This is in agreement with the analysis of the fracture pattern in the fault rocks across the BF, documenting an abrupt decrease in the fracture abundance, and hence in the hydraulic transmissivity, moving from the hangingwall to the footwall rocks. This is also in agreement with the alteration mineralogy found respectively at the footwall and hangingwall of the fault. In particular, adularia is distributed in the hangingwall rocks and as a gangue mineral in the Filone di Boccheggiano at the immediate hangingwall of the BF, whereas it only seldom occurs in alteration halos surrounding mineralized veins at the footwall of the BF. Since the occurrence of adularia has been commonly used as an indicator of an intense water/rock ratio and correlated with the development of secondary porosity in hydrothermally altered rock sections (e.g. Moore et al. Reference Moore, Hickman, Lockner and Dobson2001), the pattern of adularia occurrence in the damage zone of the BF once again confirms that the hangingwall rocks have been by far subjected to the largest amount of fluid flow. Based on the above points, we propose that the fine-grained phyllonite fault gouge separated a low flow region below (footwall rocks) from a high flow one above (hangingwall rocks) and, hence, the fault gouge operated as a permeability barrier to fluid circulation, preventing fluid flow across the fault (see e.g. Caine, Evans & Forster, Reference Caine, Evans and Forster1996; Sibson, Reference Sibson2000; Rowland & Sibson, Reference Rowland and Sibson2004). This resulted in a highly anisotropic hydraulic transmissivity along the BF, with fluid flow being focused within the highly fractured damage zone at the fault hangingwall.
9.c. Model of fluid flow and mineralization
Collectively, the geological, fluid inclusion and geochemical information described above indicate that sulphide mineralization of the Campiano mine was primarily controlled by near-neutral pH thermal waters, circulating within permeable zones created within the damage zone of the BF. The main features involved during sulphide ore genesis along the BF may be summarized as follows: (i) highly anisotropic hydraulic transmissivity across the BF, with upward fault-parallel fluid flow occurring dominantly at the fault hangingwall; (ii) transient and fluctuating fluid pressure conditions during ore mineralization; (iii) a source of thermal energy (magmatic body) to account for the Th values of the footwall vein fluids and the volume of fluid/vapour required to account for both the hydrothermal alteration and sulphide mineralization (the Late Pliocene Montieri pluton of Villa et al. (Reference Villa, Ruggieri, Puxeddu and Bertini2006); (iv) deep circulation of meteoric water and mixing with magmatic fluid(s) to account both for the widespread variation in the δ34S values in sulphides (Martarelli, Ferrini & Masi, Reference Martarelli, Ferrini and Masi1995) and the range in fluid salinities that is a typical feature of epithermal ore environments worldwide (e.g. Heinrich, Reference Heinrich2005).
Considering the above issues, we propose a model of fault-controlled hydrothermal fluid discharge along the BF during transition from a magmatic to hydrothermal environment at the southern branch of the Larderello geothermal field. This model is framed within the regional regime of extensional tectonics that accompanied the Neogene–Quaternary evolution of southern Tuscany. Meteoric fluids permeating along the steeply dipping fracture network created by extensional tectonics (Cameli, Dini & Liotta, Reference Cameli, Dini and Liotta1993; Liotta et al. Reference Liotta, Ruggieri, Brogi, Fulignati, Dini and Nardini2009) were firstly equilibrated at depth with their host rocks (rock-buffered circulation system), were reduced, and then they retained a near-neutral pH (Giggenbach, Reference Giggenbach1992). Convective fluid circulation at depth maintained by the cooling Montieri pluton was channelized along the anisotropic permeability structure of the BF that indeed constituted a major hydrothermal discharge conduit. The anisotropic structure of the fault damage zone across the fault core controlled the mode of fluid flow and mineralization. Fluid flow was structurally controlled and compartmentalized by the barrier of permeability constituted by the fault core that acted as an impermeable barrier to cross-fault flow, focusing fluid flow along the high permeability conduits created at the fault hangingwall (Fig. 13). Interplay among active deformation, fracturing and sealing (e.g. Sibson, Reference Sibson1996; Cox, Knackstedt & Braun, Reference Cox, Knackstedt and Braun2001; Sheldon & Ord, Reference Sheldon and Ord2005) during convective circulation at depth maintained by the cooling of the Montieri pluton was primarily responsible for the ore genesis along the hangingwall of the BF. Structural permeability at the fault hangingwall was achieved by means of a network of fault fracture meshes (cf. Sibson, Reference Sibson1996), compatible with the regional extensional stress field (see inset in Fig. 13). On the other hand, the extremely low permeability expected in the fault gouge was responsible for creation of forced fluid overpressure conditions (Neuzil, Reference Neuzil1995; Sibson, Reference Sibson2000) at the footwall of the BF during fluid outflow at the fault hangingwall. This caused hydrofracturing of the country rocks below the seal created by the fault core, as attested by development of multiple episodes of sub-horizontal sulphide vein formation and brecciation. Formation of this vein swarm might have also been favoured by the pre-existing mechanical anisotropies (foliation planes) in the TMC rocks (see inset in Fig. 13). The higher homogenization temperatures derived from the fluid inclusions hosted in quartz from the footwall ore bodies of the BF together with the evidence of faulting post-dating ore formation suggest that footwall mineralization pre-dated the main ore genesis in the hangingwall. This argues that efficient fluid outflow along the BF occurred only after a threshold of critical fracture permeability (percolation threshold in Cox, Knackstedt & Braun, Reference Cox, Knackstedt and Braun2001) was overcome in the fault hangingwall. There, texture of the quartz crystals in the vein ores (Fig. 6f) argues that cyclic fluid supply accompanied ore genesis and that a cyclic fault valve behaviour (Sibson, Reference Sibson1992, Reference Rowland and Sibson2004; Cox, Reference Cox1995) may be invoked as a dynamic fluid flow model to create the fracture pathways for fluid percolation along the BF. During this upward flow, fluid immiscibility and polycyclic mineralization occurred, probably related to cyclically repeated pressure drops accompanying crack sealing during stress-induced dilatation and continuous deformation (e.g. Robert, Boullier & Firdaous, Reference Robert, Boullier and Firdaous1995). Fluid flow was further controlled by the relative permeability structure of the host rocks and fault zone elements, with fluid flow focused along the permeable/impermeable interfaces (cf. Rowland & Sibson, Reference Rowland and Sibson2004). In the fault footwall, this process resulted in fluid flow focused along horizontal paths as documented by the multiple sub-horizontal skarn mineralization levels formed at the carbonate–phyllite interfaces (see inset in Fig. 2). Finally, degassing of the separated vapour phase occurred along the fracture conduits, forming steam-heated acid-sulphate waters and final weathering of the sulphide ores.

Figure 13. Conceptual model for the sulphide mineralization and hydrothermal outflow within the damage zone of the Boccheggiano Fault. The inset shows the different features of the structural permeability across the damage zone of the BF under the prevailing extensional stress regime accompanying sulphide mineralization (see text for further details).
Even though this study presents analogies with the scenario reconstructed by Liotta et al. (Reference Liotta, Ruggieri, Brogi, Fulignati, Dini and Nardini2009), important elements of novelty arise with elements that may contribute to refine conceptual models of fault hydraulic architecture in extensional settings. The major outcome of this study is that a large heterogeneity of fluid flow and hence of alteration/mineralization may be predicted across the damage zone of a major extensional fault zone. Particularly, hydraulic properties are strongly anisotropic when moving from the footwall to the hangingwall rocks, with fluid flow paths strongly influenced by (i) the fault core permeability (i.e. fault core thickness and grain size), and (ii) the anisotropic fracture permeability of the fault damage zone. In this context, the rate of secondary permeability creation and maintenance by active deformation in the hangingwall of the fault appears to be by far the major factor leading to effective hydraulic transmissivity in extensional terranes. Strongly focused fluid flow and structurally controlled mineralized zones are then expected within the fracture-controlled pathways created at the fault hangingwall.
The generalization of the model presented in this paper implies the prerequisite that, in extensional settings, hangingwall blocks are more deformed (and therefore likely more permeable) than footwall blocks. There is no definitive agreement in the current literature about whether asymmetric fault damage always occurs and localizes in the hangingwall of extensional faults, mostly because fault blocks often host deformations inherited from previous tectonic events and the deformation discrimination is usually difficult. However, modern technologies applied to actively deforming terranes have recently demonstrated that, in extensional settings, the fault hangingwall usually undergoes deformation larger than the fault footwall, as in the case of the April 2009 L'Aquila earthquake (magnitude 6.3) in central Italy (Walters et al. Reference Walters, Elliott, D'Agostino, England, Hunstad, Jackson, Parsons, Phillips and Roberts2009; Wilkinson et al. Reference Wilkinson, McCaffrey, Roberts, Cowie, Phillips, Michetti, Vittori, Guerrieri, Blumetti, Bubeck, Yates and Sileo2010). Obviously, the contrast in the rheological properties between the hangingwall and footwall rocks may also play an important role in the finite deformation and damage (ductile versus brittle behaviour; cf. De Paola, Faulkner & Collettini, Reference De Paola, Faulkner and Collettini2009) as may be the case in the BF, where foliated Palaeozoic phyllites are exposed at the footwall and Cretaceous marine siliceous–carbonate strata are exposed at the hangingwall.
10. Conclusions
This study documents that the bulk hydrological properties of the sulphide-mineralized fault damage zone of the BF were strongly influenced by the low permeability structure of the fault core, which induced fluid flow compartmentalization and dominant upward fault-parallel flow. Stress-controlled components of structural permeability created at the fault hangingwall enhanced bulk permeability and primarily controlled fluid outflow and mineralization, resulting in integrated fluid fluxes nearly one order of magnitude higher in the hangingwall than in the footwall. These features intimately link ore-grade mineralization in extensional settings to telescoping of hydrothermal flow along the fracture permeability in the hangingwall block(s) of major extensional fault systems.
Acknowledgements
This paper is dedicated to the memory of R. Funiciello, who promoted this research. We are indebted to T. Theye and A. Kazbor (Stuttgart University) for providing XRF data. The paper benefitted from constructive criticism from N. De Paola and advice from the journal editor M. Allen.
Appendix 1. Analytical methods
Fluid inclusion analyses
Microthermometric measurements have been carried out at the Flinc Lab of the Istituto di Geologia Ambientale e Geoingegneria, CNR, Rome, with a Linkam THMSG600 freezing/heating stage. The calibration of the stage was performed using pure natural CO2 inclusions for low temperatures and synthetic fluid inclusions for high temperatures. Reproducibility of the triple point of CO2 (T mCO2) at −56.6°C was ± 0.2°C (± 1 °C for heating runs). Eutectic and final melting temperatures (Te and Tm, respectively) were determined with a 0.5–1°C min−1 rate, homogenization temperature (Th) with a heating rate of 5–10°C min−1.
Stable isotope analysis
Stable isotope ratios were measured at the Mass Spectrometry Lab of the Istituto di Geologia Ambientale e Geoingegneria, CNR, Rome. Mineral separation was achieved by hand picking. Oxygen isotope ratios of quartz samples were measured by laser fluorination (Sharp, Reference Sharp1990), reacting 1.5–1.8 mg fragments in a F2 gas atmosphere. We employed a 15W CO2 laser operating at a wavelength of 10.6 m to irradiate the samples, and pure fluorine desorbed at about 300°C from hexafluoropotassium–nickelate salt (Asprey, Reference Asprey1976) as a reagent. The O2 produced during laser fluorination was purified of excess fluorine and transferred to a cold finger with a 13 Å molecular sieve. Further oxygen gas purification was achieved by desorbing oxygen from the molecular sieve at around 110°C using a liquid nitrogen–ethanol mixture. The purified gas was then transferred to a Finnigan Delta+ mass spectrometer for oxygen isotope analysis. The laboratory standard, calibrated against the NBS 28 standard, was measured several times during the analysis session. Its standard deviation after ten repetitions is less than 0.1. The oxygen isotope compositions are reported in the usual delta notation that represents the deviation in parts per million of the 18O/16O ratio relative the same ratio of the standard SMOW (Standard Mean Oceanic Water).
XRD analyses
XRD analyses were performed with a Scintag X1 XRD system (CuKα radiation) at 40 kV and 45 mA at Roma Tre University. Randomly oriented whole-rock powders were run in the 2–70°2θ interval with a step size of 0.05°2θ and a counting time of 3 s per step. Oriented air-dried samples were scanned from 1 to 48°2θ with a step size of 0.05°2θ and a count time of 4 s per step. The presence of expandable clay minerals was determined for samples treated with ethylene glycol at room temperature for 24 hours. Ethylene glycol solvated samples were scanned at the same conditions as air-dried aggregates with a scanning interval of 1–30°2θ. Expandability measurements for both I-S and C-S mixed-layer minerals were determined according to Moore & Reynolds (Reference Moore and Reynolds1997) using the delta two-theta method after decomposing the composite peaks between 9 and 10°2θ and 16 and 17°2θ for I-S and between 10 and 12.3°2θ and 25 and 26°2θ for C-S using Pearson VII functions. Peaks in relative close position were selected for clay mineral quantitative analysis of the <2 μm (equivalent spherical diameter) in order to minimize the angle-dependent intensity effect. Integrated peak areas were transformed into mineral concentrations by using mineral intensity factors as calibration constants (see Moore and Reynolds Reference Moore and Reynolds1997 for a review). Non-clay minerals that were observed in the <2 μm grain-size fraction were not included in the quantitative analysis of the oriented aggregates, thus the given data refer to the phyllosilicate group only.
Whole-rock chemistry
Major and selected trace elements of bulk rock samples were measured by X-ray fluorescence analysis (XRF) with a Panalytical PW2400 sequential wavelength-dispersive X-ray spectrometer (equipped with a Rh excitation source) at the Institute of Mineralogy, University of Stuttgart. Glass discs were used for major elements, pressed powder pellets for trace elements. Calibration was done with international geochemical reference samples. The reproducibility was found to be smaller than 1% for major elements and smaller than 2% for trace elements. Loss on ignition (LOI) was determined by heating to 850°C.


