I. INTRODUCTION
Owing to its promising potential on energy saving and environmental safety, much attention has been focused on magnetic refrigeration, which is considered as an alternative to the conventional gas-based refrigeration technique. Magnetic refrigeration is based on the magnetocaloric effect (MCE) described in terms of isothermal magnetic entropy change (∆S M) and/or adiabatic temperature change (∆T ad). A variety of prototype materials and intermetallic compounds have been studied in order to achieve a large MCE at proper temperatures. Since the discovery of giant MCE in Gd5(Ge1−xSix)4 alloys (Pecharsky and Gschneidner, Reference Pecharsky and Gschneidner1997), which undergo a first order magnetic transition coupled with the crystal structural transition, many other compounds with giant MCE have been found, such as La–Ca–Sr–Mn–O manganites (Zhang et al., Reference Zhang, Tejada, Xin, Sun, Wong and Bohigas1996), MnAs (Kuhrt et al., Reference Kuhrt, Schittny and Bärner1985), MnFeP1−xAsx (Tegus et al., Reference Tegus, Bruck, Buschow and de Boer2002), MnAs1−xSbx (Wada and Tanabe, Reference Wada and Tanabe2001), LaFe13−xSix (Hu et al., Reference Hu, Shen, Sun, Cheng, Rao and Zhang2001), MnNiGe (Zhang et al., Reference Zhang, Wang, Cao, Han, Xuan and Du2008), MnCoGe, etc. Among these materials, Ni–Mn-based ferromagnetic shape memory alloys (FSMAs) Ni–Mn–Z (Z = Ga, In, Sn, and Sb) have received increasing attention because of several noteworthy characteristics such as large magnetic field-induced-strain (Kainuma et al., Reference Kainuma, Imano, Ito, Sutou, Morito, Okamoto, Kitakami, Oikawa, Fujita, Kanomata and Ishida2006), relatively cheap raw materials, and adjustable phase transition temperature (Krenke et al., Reference Krenke, Duman, Acet, Wassermann, Moya, Manosa and Planes2005a). High MCE with |∆S M| of 86 J kg−1 K−1 in a field change of 50 kOe at about 313 K has been reported in a Ni2MnGa single crystal (Pasquale et al., Reference Pasquale, Sasso, Lewis, Giudici, Lograsso and Schlagel2005). A large magnetic entropy change ∆S M of 19 J kg−1 K−1 in a field change of 50 kOe in Ni50Mn50−xSnx alloys is obtained near its martensitic transformation (MT) at 300 K (Krenke et al., Reference Krenke, Duman, Acet, Wassermann, Moya, Manosa and Planes2005a). A large MCE has been observed due to the sudden increase of magnetization (∆M) by the magneto-structural transition from the martensitic phase to the austenitic phase in the Ni–Mn–Z system.
It was reported that there is a ferromagnetic (FM) coupling between the Mn atoms while the magnetic moments of the Ni atoms were kept zero in the stoichiometric Ni2MnZ alloys (Helmholdt and Buschow, Reference Helmholdt and Buschow1987). Antiferromagnetic (AFM) order was found in the off-stoichiometric Ni2MnZ alloy, in which the Mn atoms strongly prefer to occupy the 4a positions, and the excess Mn atoms occupy the 4b positions (Brown et al., Reference Brown, Gandy, Ishida, Kainuma, Kanomata, Neumann, Oikawa, Ouladdiaf and Ziebeck2006). The Mn atoms in the 4a site have ferromagnetic interaction, but in the 4b sites are coupled antiferromagnetically to the surrounding Mn atoms in the regular Mn sites (Krenke et al., Reference Krenke, Acet, Wassermann, Moya, Manosa and Planes2005b). It is also true in both martensitic and austenitic states of the Ni50Mn35In15 alloy (Bhobe et al., Reference Bhobe, Priolkar and Nigam2008). It means that excess Mn will enhance AFM interaction and result in weakness of ∆M when the alloy undergoes a magneto-structural transition from the paramagnetic martensitic state to the ferromagnetic austenitic state. The previous studies suggested that Co substitution in bulk Ni43Mn46−xCoxSn11 (Gao et al., Reference Gao, Hu, Shen, Wang, Sun and Shen2009; Han et al., Reference Han, Wang, Qian, Feng, Jiang and Du2010) and Ni42.7Mn40.8Co5.2Sn11.3 ribbons (Ma et al., Reference Ma, Cao, Xuan, Zhang, Shen, Wang and Du2011) induced the Mn moments to align in a ferromagnetic order and enhance magnetization in the austenitic phase. It was also pointed out that the addition of Co in Ni43Mn46−xCoxSn11 alloys enhanced notably ∆M across MT, because magnetization of austenitic phase was significantly increased while that of martensitic state remained almost unchanged (Gao et al., Reference Gao, Hu, Shen, Wang, Sun and Shen2009). The large MCE originating mainly from this large ∆M makes Ni–Mn–Co–Sn alloys potential refrigerants (Gao et al., Reference Gao, Hu, Shen, Wang, Sun and Shen2009; Han et al., Reference Han, Wang, Qian, Feng, Jiang and Du2010). However, a lower Ni content or a higher Mn content in these alloys may enhance antiferromagnetic interaction, resulting in lower MCE.
In this work, the authors investigate the effect of Co substitution for Mn in higher Ni content Heusler alloys Ni50Mn35−xCoxSn15 on the martensitic transformation and MCE.
II. EXPERIMENTAL
The polycrystalline Ni50Mn35−xCoxSn15 alloys with x = 0, 1.0, 1.5, 2.0, and 3.0 were prepared by arc melting using a non-consumable tungsten electrode and a water-cooled copper tray in an atmosphere of pure argon. The alloys, each 6 g in total weight, were prepared using Ni, Mn, Co, and Sn with purity of 99.9 wt% as raw materials. The alloys were re-melted thrice to ensure homogeneity. The weight loss was measured from the weight before and after arc melting for each alloy button. The excess 3 wt% Mn was added to the alloy to compensate for evaporation of Mn during melting. Then, the alloy buttons were sealed in evacuated quartz tubes and annealed at 1173 K for 48 h, followed by quenching in liquid nitrogen. The sample was polished and etched using the solution of HNO3:alcohol in the ratio 5:100, for the scanning electron microscope (SEM) observation and energy dispersive spectrum (EDS) analysis performed in a SU-70 scanning electron microscopy. X-ray powder diffraction (XRD) data were collected using a Bruker-axs D8 superspeed 18 kW diffractometer with CuKα radiation. The phase transformation temperatures and latent heat were analyzed by a TAQ200 differential scanning calorimeter (DSC) with a heating and cooling rate of 5 K min−1. The temperature dependence and field dependence of magnetization were measured using a vibrating sample magnetometer (VSM). The thermomagnetic curves were recorded in an applied field of 0.1 T and the isothermal magnetization curves were measured in magnetic fields of 0–1.5 T.
III. RESULTS AND DISCUSSION
A. Structure and phase transition
XRD patterns of the Ni50Mn35−xCoxSn15 alloys with x = 0, 1.0, 1.5, 2.0, and 3.0 at room temperature, shown in Figure 1, indicate that all alloys are austenitic phases with the Heusler L21-type structure. The unit-cell parameters of the samples, obtained by Rietveld refinement method using Topas 3.0 software, were listed in Table I. One can see that the unit-cell parameters for the samples, except for the sample with x = 3.0, decrease with increasing Co content, due to the Co atom substitution for Mn atom in the structure. The empirical atomic radius (r e) (Slater, Reference Slater1964) of Co atom (1.35 Å) is smaller than that of Mn (1.40 Å) and Sn (1.45 Å) atoms but equal to that of Ni atom (1.35 Å). The Co and Mn are both transition elements, and the r e of Co is closer to that of Mn than that of Sn. On the other hand, if we consider the calculated atomic radius (Clementi et al., Reference Clementi, Raimondi and Reinhardt1967) (r c), the r c of Co (1.52 Å) is larger than that of Ni (1.49 Å) and Sn (1.45 Å), and smaller than that of Mn (1.61 Å). Hence, it is preferred to substitute the Co for Mn not Ni or Sn. A second phase in the sample with x = 3.0 is observed from the shoulder at 2θ = 43.04° and the diffraction peak at 73.85°, which is also confirmed by the SEM observation. The two peaks can be indexed as (011) and (112) with an NiMn-type structure (space group: I4/mmm). The presence of two crystalline phases is clearly observed in the SEM image, labeled with A and B in Figure 2. The EDX results show that the chemical composition is 50.1% Ni, 30.5% Mn, 17.3% Sn, and 2.1% Co in atomic percent for the A phase, and 59% Ni, 32.5% Mn, 2.5% Sn, and 6% Co for the B phase. The chemical formulas are Ni50.1Mn30.5Sn17.3Co2.1 and Ni59Mn32.5Sn2.5Co6, respectively. It is in good agreement with the reported decomposition of Ni50Mn50−xSnx into Ni50Mn30Sn20 and Ni54Mn45Sn after 4 weeks annealing at 1223 K (Yuhasz et al., Reference Yuhasz, Schlagel, Xing, Dennis, McCallum and Lograsso2009). As the chemical composition of Ni59Mn32.5Sn2.5Co6 is closer to that of NiMn, the alloy should be crystallized in the NiMn-type structure and Ni50.1Mn30.5Sn17.3Co2.1 as the L21 austenite phase. The decomposition occurred in the sample with x = 3.0 annealed at 1173 K for only 48 h in this work, implying that the doping of Co led to decomposition at a lower temperature and a shorter annealing time.

Figure 1. XRD patterns of Ni50Mn35−xCoxSn15 alloys with x = 0, 1, 1.5, 2, and 3. The label “06-0652 > MnNi2Sn” is the ICDD powder diffraction file for Ni2MnSn austenitic phase. An enlarged pattern for x = 3 is presented above.
Figure 2. SEM image of Ni50Mn32Co3Sn15 shows the presence of two phases. EDX spectroscopy indicates that the compositions of A and B are Ni59Mn32.5Sn2.5Co6 and Ni50.1Mn30.5Sn17.3Co2.1, respectively.
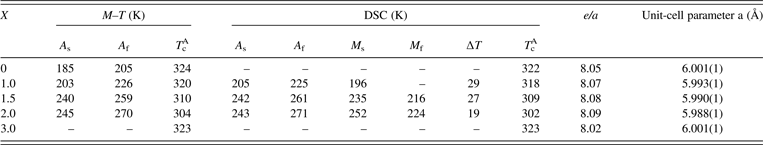
Table I. Magnetic transformation temperatures, valence electron concentration (e/a), thermal hysteresis (∆T), and lattice parameters a of austenitic phase for Ni50Mn35−xCoxSn15 (x = 0, 1, 1.5, 2 and 3) alloys.
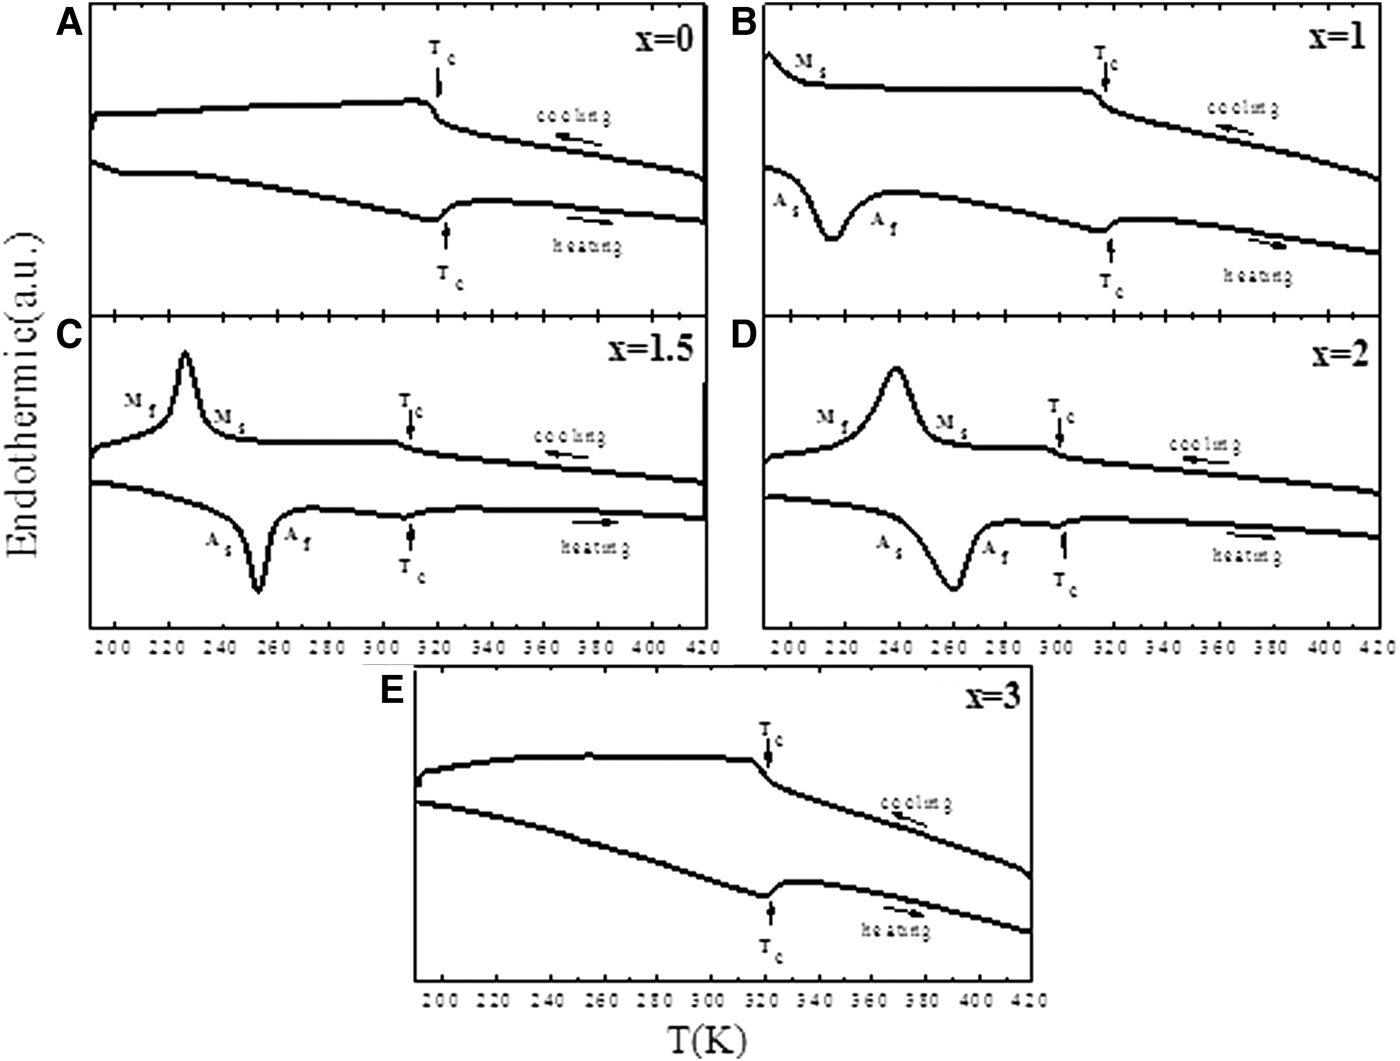
The DSC cooling and heating curves between 200 and 420 K for the Ni50Mn35−xCoxSn15 alloys are shown in Figure 3. The sharp exothermic and endothermic peaks, corresponding to the reverse martensitic reverse transformation and direct martensitic transformation, show the martensitic start (M s) and finish (M f) temperatures, the austenitic start (A s) and finish (A f) temperatures, and the Curie temperature (T CA) of the austenitic phase. The results obtained from these DSC curves are listed in Table I. Only the endothermic peak of austenitic transition was observed for the sample with x = 1.0, while no other peaks of martensitic or austenitic transformation for the sample with x = 0 were detectable. The martensitic transformation was not observed by DSC for the sample with x = 3.0. Generally, the thermal hysteresis is regarded as a typical feature of the martensitic transformation due to the first-order nature of the transition (Ortin and Delaey, Reference Ortin and Delaey2002). The thermal hysteresis around T M is about 20–30 K for Ni50Mn35−xCoxSn15 alloys.
Figure 3. DSC curves for the Ni50Mn35−xCoxSn15 alloys with x = 0 (a), 1 (b), 1.5 (c), 2 (d), and 3 (e) on both heating and cooling modes.
Figure 4 shows the temperature dependence of the magnetization (M–T curves) for the Ni50Mn35−xCoxSn15 compounds with x = 0, 1.0, 1.5, 2.0, and 3.0 in an applied field of 0.1 T. The MT is not found in the M–T curve for the sample with x = 3.0 till 80 K, which may be due to the decomposition of this sample mentioned above. The same phenomenon had also been reported in Ni50−xCoxMn39Sb11 alloy for x = 11 due to the suppression of the martensitic phase by Co doping (Han et al., Reference Han, Wang, Zhang, Xuan, Zhang, Gu and Du2008). Krenke et al. (Reference Krenke, Moya, Aksoy, Acet, Entel, Manosa, Planes, Elerman, Yucel and Wassermann2007) calculated the density of states (DOS) for the L21, L10, and 5M modulated structures for Ni2MnGa, and pointed out that the modulated martensitic states are metastable from the DOS. It was also reported that an MT occurs in the alloys having a critical value of the unit-cell parameter a ≈ 6 Å or less in the austenitic state for the NiMn-based Heusler alloys (Planes et al., Reference Planes, Manosa and Acet2009). The unit-cell parameter of Ni50.1Mn30.5Sn17.3Co2.1 alloy is about a = 6.001 Å, which may attribute to the disappearance of MT for the alloy with x = 3.0. However, the unit-cell parameter a for the sample with x = 0 is also equal to 6.001 Å, but the MT of this sample occurred because the valence electron concentration e/a is also a critical factor influencing the characteristics of MT. It has been well established that the compositional dependence of temperature of MT (T M) and T C for martensitic and austenitic phases are closely related to e/a. The e/a-dependence of T M has been found to increase monotonously (Planes et al., Reference Planes, Manosa and Acet2009). The valence electron concentration e/a of Ni50.1Mn30.5Sn17.3Co2.1 is 8.02. According to Planes et al. (Reference Planes, Manosa and Acet2009), the temperature of MT for Ni50.1Mn30.5Sn17.3Co2.1 will expect to be about 150 K, but actually not occur. It is maybe the affection of lattice parameter or the existence of the second phase.
Figure 4. Temperature-dependent magnetization (M–T) curves for Ni50Mn35−xCoxSn15 alloys in a field of 0.1 T.
The A s, A f and T CA estimated from the M–T curves are also listed in Table I. The results obtained from the DSC analysis agree well with those obtained from M–T measurements. With increasing temperature, the M–T curves of Ni50Mn35−xCoxSn15 compounds, except for the sample with x = 3.0, show a slightly tilted platform first and then climb sharply at A s with reverse magnetic transformation accompanied with MT. The A s determined from Figure 2 are 185, 203, 240, and 245 K for the samples with x = 0, 1.0, 1.5, and 2.0, respectively. On further increase in temperature, the austenitic undergoes a ferromagnetic transition from the FM state to the PM state. The M–T curves for the samples, except for x = 3.0, show clearly that the austenitic transformation temperatures are increasing but T CA is decreasing with increasing Co content, because the valence electron concentration e/a of the alloy is increased with increasing Co content.
For the samples with x = 1.0, 1.5, and 2.0, maximum magnetizations of the austenitic state increase from 24 to 28 Am2 kg−1. However, the ΔM does not increase with increasing Co content because magnetizations of the martensitic state increase too. In the earlier reports, it was suggested that Co substitution helps the Mn moments align in a ferromagnetic ordering, giving rise to the magnetization in the austenitic phase (Yu et al., Reference Yu, Cao, Ma, Liu, Chen, Wu, Zhang and Zhang2007; Kainuma et al., Reference Kainuma, Ito, Umetsu, Oikawa and Ishida2008; Ma et al., Reference Ma, Zhang, Yu, Zhu, Chen, Wu, Liu, Qu and Li2008; Han et al., Reference Han, Wang, Qian, Feng, Jiang and Du2010). The calculated result of Co-doped Mn2NiGa with the first principle confirmed that Co acts as a ferromagnetic activator, and leads to ferromagnetic alignment of Mn moments in the austenitic phase (Ma et al., Reference Ma, Zhang, Yu, Zhu, Chen, Wu, Liu, Qu and Li2008). The exchange coupling is suggested to be a competition between the spin polarization of transportation electrons among localized Mn moments and the s–p hybridizing effect induced by Co. According to the calculation results (Ma et al., Reference Ma, Zhang, Yu, Zhu, Chen, Wu, Liu, Qu and Li2008), the original two Mn sites become three sites when the Co atom enters the Mn2NiSn-type lattice because the embedded Co atom breaks the crystallographic symmetry. Therefore, a similar mechanism may account for this system.
B. Magnetocaloric effect
The isothermal magnetization (M–H) curves for Ni50Mn35−xCoxSn15 alloys have been measured near T M. The magnetization loop in both increasing and decreasing fields is presented in Figure 5. It shows the M–H curves for the alloy Ni50Mn33.5Co1.5Sn15 measured at various temperatures around T M in the magnetic field range of 0–1.5 T. Hysteresis losses are detected. The increment in temperature is 2 K with increasing temperature mode. The curves below 240 K and above 259 K reveal low magnetization in the martensitic phase but high magnetization in the austenitic phase, respectively. At temperatures between 245 and 255 K, the metamagnetic behavior characterized by magnetic hysteresis has been observed, which confirms a reversible martensitic transformation that can be induced by applying a magnetic field. Using the Maxwell relation (∂S/∂H)T = (∂M/∂T)H, the magnetic entropy changes can be calculated as.
 $$\eqalign{& \Delta S_{\rm M} \left({T\comma \; H} \right)=S_{\rm M} \left({T\comma \; H} \right)- S_{\rm M} \left({T\comma \; 0} \right)\cr & \quad =\vint_0^H {\left({\displaystyle{\partial S_{\rm M} } \over {\partial H}}\right)} _T {\rm d}H=\vint_0^H {\left({\displaystyle{\partial M} \over {\partial T}} \right)} _H {\rm d}H }$$
Figure 5. Isothermal magnetization loops (M–H curves) for the alloy of Ni50Mn33.5Co1.5Sn15 measured at various temperatures around T M in a magnetic field range of 0–1.5 T.
The sign of ∆S M is determined by the sign of ∂M/∂T, as shown in Eq. (1). The majority of the reported ∆S M values of Ni–Mn–Ga and other ferromagnetic systems exhibiting first-order phase transition are calculated using Eq. (1). Based on this common practice, the ∆S M (T, H) of Ni50Mn35−xCoxSn15 alloys are shown in Figure 6, which is evaluated with a magnetic field change of 1.5 T. Peaks can be observed near T M and the calculated maximum values of ∆S M are 3.73, 1.37, 2.88, and 2.11 J kg−1 K−1 for x = 0, 1.0, 1.5, and 2.0, respectively. The maximum magnetic entropy change of 3.73 J kg−1 K−1 is obtained in Ni50Mn35Sn15 alloy with a magnetic field change of 1.5 T at about 193 K, which is comparable with 5 J kg−1 K−1 in a field of 2 T and 2.2 J kg−1 K−1 in a field of 1 T for Ni50Mn35Sn15 (Krenke et al., Reference Krenke, Duman, Acet, Wassermann, Moya, Manosa and Planes2005a), whereas the effect of Co addition on MCE is not obvious in this work, Co addition promotes T M from 196 to 252 K. As a result, Co-doped Ni–Mn-based Heusler alloys possess potential applications as magnetic refrigerants at an appropriate temperature.
Figure 6. Magnetic entropy change ∆S M of Ni50Mn35−xCoxSn15 alloys in a magnetic field range of 0–1.5 T.
VI. CONCLUSION
In summary, the effect of Co substitution on the martensitic transformation and MCE of Ni50Mn35Sn15 alloy has been investigated. Ni50Mn35−xCoxSn15 (x = 0, 1, 1.5, 2, and 3) alloys have the Heusler L21-type structure at room temperature. For the sample with x = 3.0, it decomposes into two phases with the chemical compositions of Ni50.1Mn30.5Sn17.3Co2.1 and Ni59Mn32.5Sn2.5Co6. With an increase of the Co content from 0 to 2.0, the martensitic transformation temperature T M increases from 185 to 245 K. This agrees with the rule of e/a-dependence of T M. The maximum magnetic entropy changes ∆S M of 3.73, 1.37, 2.88, and 2.11 J kg−1 K−1 are obtained for the samples x = 0, 1.0, 1.5, and 2.0, respectively, near their martensitic transformation temperatures in a magnetic field change of 1.5 T. Co doping promotes T M to an appropriate temperature range, which may have potential applications as magnetic refrigerants near room temperature.
ACKNOWLEDGMENTS
The work was supported by the National Natural Science Foundation of China (No. 51171117 and 51101103), Shenzhen Science and Technology Research Grant (No. JC200903120081A, JC201005280515A and JCYJ20120613115247045), and Foundation for Distinguished Young Talents in Higher Education of Guangdong, China (No. LYM10119)