1 Introduction
Some of the candidate schemes for fusion reactors are based on magnetic mirrors (Post Reference Post1987; Bagryansky et al.
Reference Bagryansky, Anikeev, Denisov, Gospodchikov, Ivanov, Lizunov, Kovalenko, Malygin, Maximov and Korobeinikova2015). Their main advantage is relative simplicity however they exhibit fundamental difficulties which are detrimental to achieving a viable reactor. One is particle losses due to unconfined areas in phase space (Rosenbluth & Post Reference Rosenbluth and Post1965) for which there are some suggested solutions (Logan et al.
Reference Logan, Lichtenberg, Lieberman and Makhijani1972; Sudnikov et al.
Reference Sudnikov, Beklemishev, Postupaev, Burdakov, Ivanov, Vasilyeva, Kuklin and Sidorov2017). Another is due to flute instabilities (Rosenbluth & Longmire Reference Rosenbluth and Longmire1957) which drive macroscopic radial flow with azimuthal variations or modes. These modes are a result of an effective acceleration field (
![]() $g$
) which is due to the magnetic field curvature or also might be due to plasma rotation (Sorokina Reference Sorokina2009). The growth rate follows the equation
$g$
) which is due to the magnetic field curvature or also might be due to plasma rotation (Sorokina Reference Sorokina2009). The growth rate follows the equation
![]() $\unicode[STIX]{x1D6FE}=\sqrt{gk}$
where
$\unicode[STIX]{x1D6FE}=\sqrt{gk}$
where
![]() $k$
is the mode wavenumber. Some schemes to tackle this include shear flow stabilization (Tajima et al.
Reference Tajima, Horton, Morrison, Schutkeker, Kamimura, Mima and Abe1991; Hassam Reference Hassam1992; Beklemishev et al.
Reference Beklemishev, Bagryansky, Chaschin and Soldatkina2010) and active feedback stabilization (Be’ery & Seemann Reference Be’ery and Seemann2015). It has also been shown that high frequency fields can have a stabilizing effect for field reversed and tandem configurations, but the stabilizing effect of a rotating magnetic field (RMF) in a simple mirror configuration has not been explored (Ferron et al.
Reference Ferron, Hershkowitz, Breun, Golovato and Goulding1983; Yasaka & Itatani Reference Yasaka and Itatani1984; Guo et al.
Reference Guo, Hoffman, Milroy, Miller and Votroubek2005). In this work we study rotating magnetic field stabilization in a simple table top magnetic mirror. We observe an asymmetry of energy coupling between the plasma and external fields with respect rotating left and right directions, in resemblance to previously published experiments (Okamura et al.
Reference Okamura, Adati, Aoki, Baker, Fujita, Garner, Hattori, Hidekuma, Kawamoto and Kumazawa1986; Miljak & Chen Reference Miljak and Chen1998; Guo et al.
Reference Guo, Hoffman, Brooks, Peter, Pietrzyk, Tobin and Votroubek2002). The increase in stability depends on both the polarization of the fields and the trap magnetic field strength.
$k$
is the mode wavenumber. Some schemes to tackle this include shear flow stabilization (Tajima et al.
Reference Tajima, Horton, Morrison, Schutkeker, Kamimura, Mima and Abe1991; Hassam Reference Hassam1992; Beklemishev et al.
Reference Beklemishev, Bagryansky, Chaschin and Soldatkina2010) and active feedback stabilization (Be’ery & Seemann Reference Be’ery and Seemann2015). It has also been shown that high frequency fields can have a stabilizing effect for field reversed and tandem configurations, but the stabilizing effect of a rotating magnetic field (RMF) in a simple mirror configuration has not been explored (Ferron et al.
Reference Ferron, Hershkowitz, Breun, Golovato and Goulding1983; Yasaka & Itatani Reference Yasaka and Itatani1984; Guo et al.
Reference Guo, Hoffman, Milroy, Miller and Votroubek2005). In this work we study rotating magnetic field stabilization in a simple table top magnetic mirror. We observe an asymmetry of energy coupling between the plasma and external fields with respect rotating left and right directions, in resemblance to previously published experiments (Okamura et al.
Reference Okamura, Adati, Aoki, Baker, Fujita, Garner, Hattori, Hidekuma, Kawamoto and Kumazawa1986; Miljak & Chen Reference Miljak and Chen1998; Guo et al.
Reference Guo, Hoffman, Brooks, Peter, Pietrzyk, Tobin and Votroubek2002). The increase in stability depends on both the polarization of the fields and the trap magnetic field strength.
2 Apparatus description
The table top machine consists of several coils which create a pulsed magnetic mirror trap, 20 cm wide and 1 m long. The trap magnetic field is relatively constant for the duration of the experiment and its value is
![]() $B_{0}\approx 60~\text{mT}$
at the centre and 400 mT at the mirrors. Experiments were taken at nominal and half-magnetic field values which both have the same magnetic geometry. A layout of the system and diagnostics is presented in figure 1.
$B_{0}\approx 60~\text{mT}$
at the centre and 400 mT at the mirrors. Experiments were taken at nominal and half-magnetic field values which both have the same magnetic geometry. A layout of the system and diagnostics is presented in figure 1.
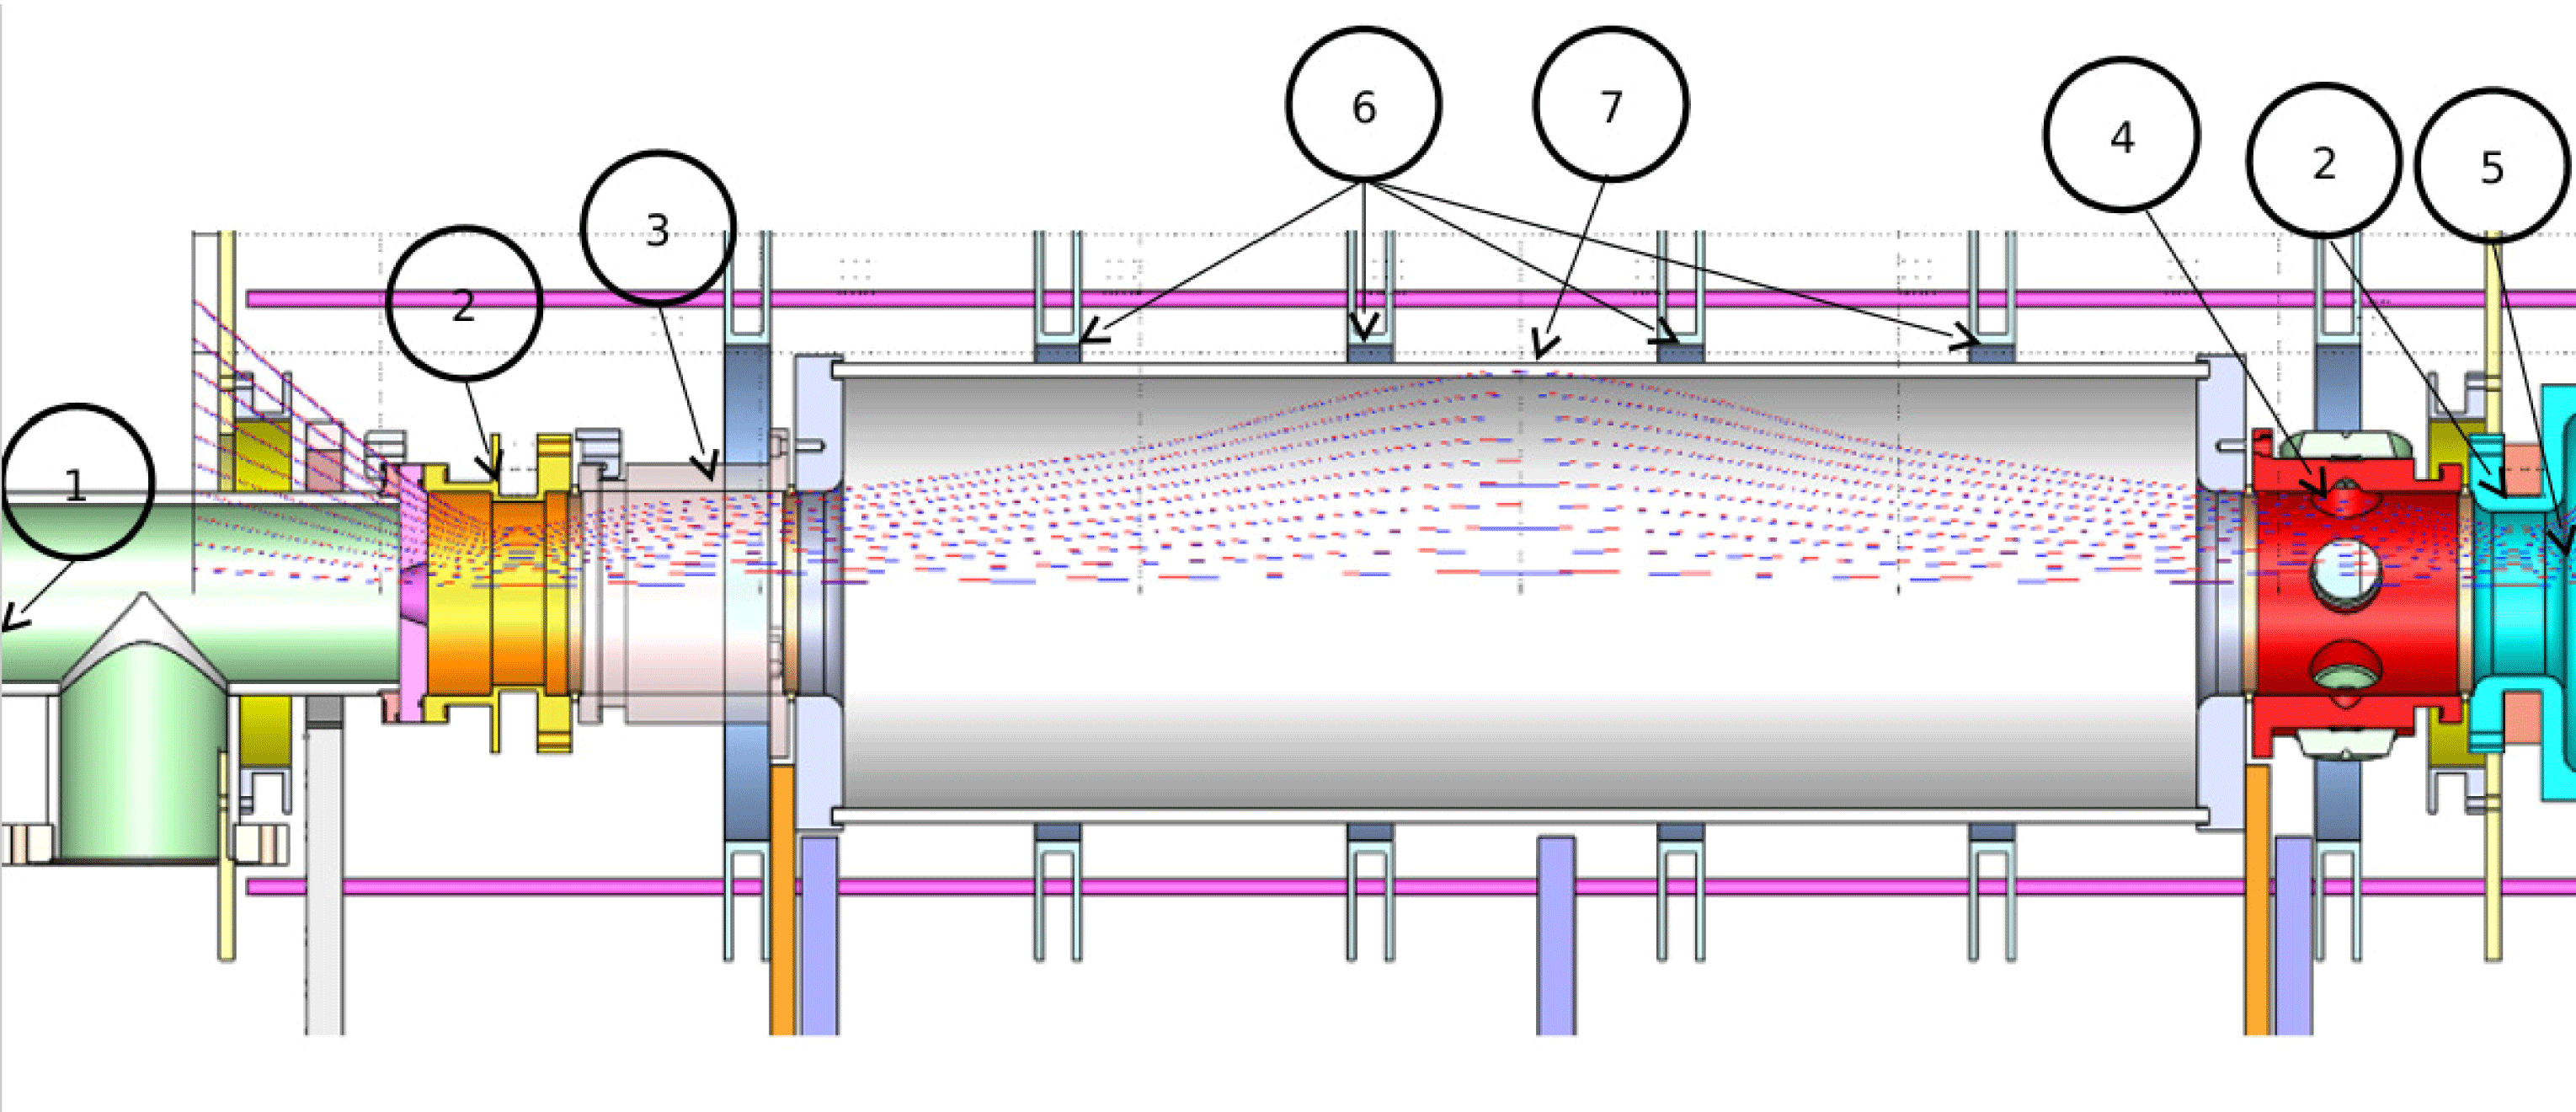
Figure 1. Schematics of the system. (1) position of plasma gun and vacuum pump, (2) magnetic mirror, (3) position of Langmuir probes, (4) position of vacuum photodiodes facing radially inwards (XUV), (5) position of glass window for imaging measurements, (6) central magnetic coils, (7) RMF antenna position.

Figure 2. (a) Electronic scheme of RMF driver system. (b) Nagoya type-III geometry used in the experiments. Two such antennae were used and were rotated
![]() $90^{\circ }$
from each other (
$90^{\circ }$
from each other (
![]() $X$
and
$X$
and
![]() $Y$
direction with respect to the magnetic field direction
$Y$
direction with respect to the magnetic field direction
![]() $Z$
).
$Z$
).
The 1.5 MHz fields are generated by 2 Nagoya-Type-III antennae in perpendicular directions such that one creates a magnetic field in the
![]() $X$
direction and the other in the
$X$
direction and the other in the
![]() $Y$
direction (the trap magnetic field is in the
$Y$
direction (the trap magnetic field is in the
![]() $Z$
direction). The sources were custom built utilizing high voltage MOSFET transistors to drive capacitors in parallel to the antennae and operated in resonance frequency (figure 2). Two such systems were installed in perpendicular directions. The phase between the two antenna was controlled to achieve different fields polarization such as linear oscillating fields and rotating fields in the left-hand and right-hand directions. Currents were measured with Pearson current sensing transformers to determine relative phase and amplitude. The magnetic field generated due to the antennae is approximately
$Z$
direction). The sources were custom built utilizing high voltage MOSFET transistors to drive capacitors in parallel to the antennae and operated in resonance frequency (figure 2). Two such systems were installed in perpendicular directions. The phase between the two antenna was controlled to achieve different fields polarization such as linear oscillating fields and rotating fields in the left-hand and right-hand directions. Currents were measured with Pearson current sensing transformers to determine relative phase and amplitude. The magnetic field generated due to the antennae is approximately
![]() $B_{\unicode[STIX]{x1D714}}\approx 0.75~\text{mT}$
and is much smaller than the trap fields (
$B_{\unicode[STIX]{x1D714}}\approx 0.75~\text{mT}$
and is much smaller than the trap fields (
![]() $B_{0}$
).
$B_{0}$
).
The plasma source is based on capillary discharge which ablates the surface of a polyethylene tube. It is believed that the plasma consists of hydrogen only as only hydrogen spectroscopic lines were observed for the duration of the experiment. Densities of the order of
![]() $10^{10}~\text{cm}^{-3}$
and temperatures of the order of 10 eV–100 eV were measured using two double Langmuir probes. Plasma azimuthal symmetry was measured using 6 XUV silicon photodiodes situated at equal spacing at the periphery of the vessel near the magnetic mirror opposite to the plasma source. Their response is proportional to photon energy. Averaged measurements of the XUV photodiodes and plasma source current with respect to time are presented in (figure 3). High frequency fields start at
$10^{10}~\text{cm}^{-3}$
and temperatures of the order of 10 eV–100 eV were measured using two double Langmuir probes. Plasma azimuthal symmetry was measured using 6 XUV silicon photodiodes situated at equal spacing at the periphery of the vessel near the magnetic mirror opposite to the plasma source. Their response is proportional to photon energy. Averaged measurements of the XUV photodiodes and plasma source current with respect to time are presented in (figure 3). High frequency fields start at
![]() $200~\unicode[STIX]{x03BC}\text{s}$
and end long after the decrease in plasma radiation. The decrease in plasma radiation at later times during the experiments is sharper then the decrease in plasma source current. This might be caused by an increase in the density of neutrals coming in from the plasma source.
$200~\unicode[STIX]{x03BC}\text{s}$
and end long after the decrease in plasma radiation. The decrease in plasma radiation at later times during the experiments is sharper then the decrease in plasma source current. This might be caused by an increase in the density of neutrals coming in from the plasma source.

Figure 3. (a) XUV photodiode voltage measurements, averaged over 6 XUV photodiodes and several experiments, plotted with respect to the plasma gun current at the bottom starting at
![]() $t=0$
. Dotted lines represent the range of
$t=0$
. Dotted lines represent the range of
![]() $\pm 1$
standard deviation. There is a delay between the gun current (b) and plasma radiation power increase (a), likely due to the time of flight between plasma source and photodiodes’ positions. The RF sources were started at time
$\pm 1$
standard deviation. There is a delay between the gun current (b) and plasma radiation power increase (a), likely due to the time of flight between plasma source and photodiodes’ positions. The RF sources were started at time
![]() $200~\unicode[STIX]{x03BC}\text{s}$
and continued far after the plasma decay.
$200~\unicode[STIX]{x03BC}\text{s}$
and continued far after the plasma decay.
3 Asymmetry of coupling
The readings of the XUV photodiodes were averaged over 5 experiments and averaged over
![]() $150~\unicode[STIX]{x03BC}\text{s}$
(
$150~\unicode[STIX]{x03BC}\text{s}$
(
![]() $350{-}500~\unicode[STIX]{x03BC}\text{s}$
from plasma gun initiation). The mean is a measure of plasma bremsstrahlung radiation power and is proportional to plasma density and electron temperature according to
$350{-}500~\unicode[STIX]{x03BC}\text{s}$
from plasma gun initiation). The mean is a measure of plasma bremsstrahlung radiation power and is proportional to plasma density and electron temperature according to
![]() $n^{2}T^{1/2}$
. The results show a sine behaviour with a maximum at
$n^{2}T^{1/2}$
. The results show a sine behaviour with a maximum at
![]() $+90^{\circ }$
phase which indicates a far stronger coupling for that polarization (right-hand direction with respect to the trap magnetic field) (figure 4). This behaviour is almost identical for nominal magnetic field and half-magnetic field experiments. Variations in the Langmuir probes with two different voltages are also measured. The physical parameters extrapolated are far less accurate as they rely on inferring the temperature. These inferences are based on probe measurements at two different positions which exhibit high fluctuation (figure 5).
$+90^{\circ }$
phase which indicates a far stronger coupling for that polarization (right-hand direction with respect to the trap magnetic field) (figure 4). This behaviour is almost identical for nominal magnetic field and half-magnetic field experiments. Variations in the Langmuir probes with two different voltages are also measured. The physical parameters extrapolated are far less accurate as they rely on inferring the temperature. These inferences are based on probe measurements at two different positions which exhibit high fluctuation (figure 5).

Figure 4. Mean voltage measurements of the 6 XUV photodiodes and 5 experiments in each data point, as a function of phase between the RF
![]() $X$
and
$X$
and
![]() $Y$
direction antennae. Bars represent one standard deviation. Two colours are shown for different parallel magnetic field strengths. It is seen that the bolometer readings resemble a sine of the phase with a maximum near
$Y$
direction antennae. Bars represent one standard deviation. Two colours are shown for different parallel magnetic field strengths. It is seen that the bolometer readings resemble a sine of the phase with a maximum near
![]() $+90^{\circ }$
.
$+90^{\circ }$
.
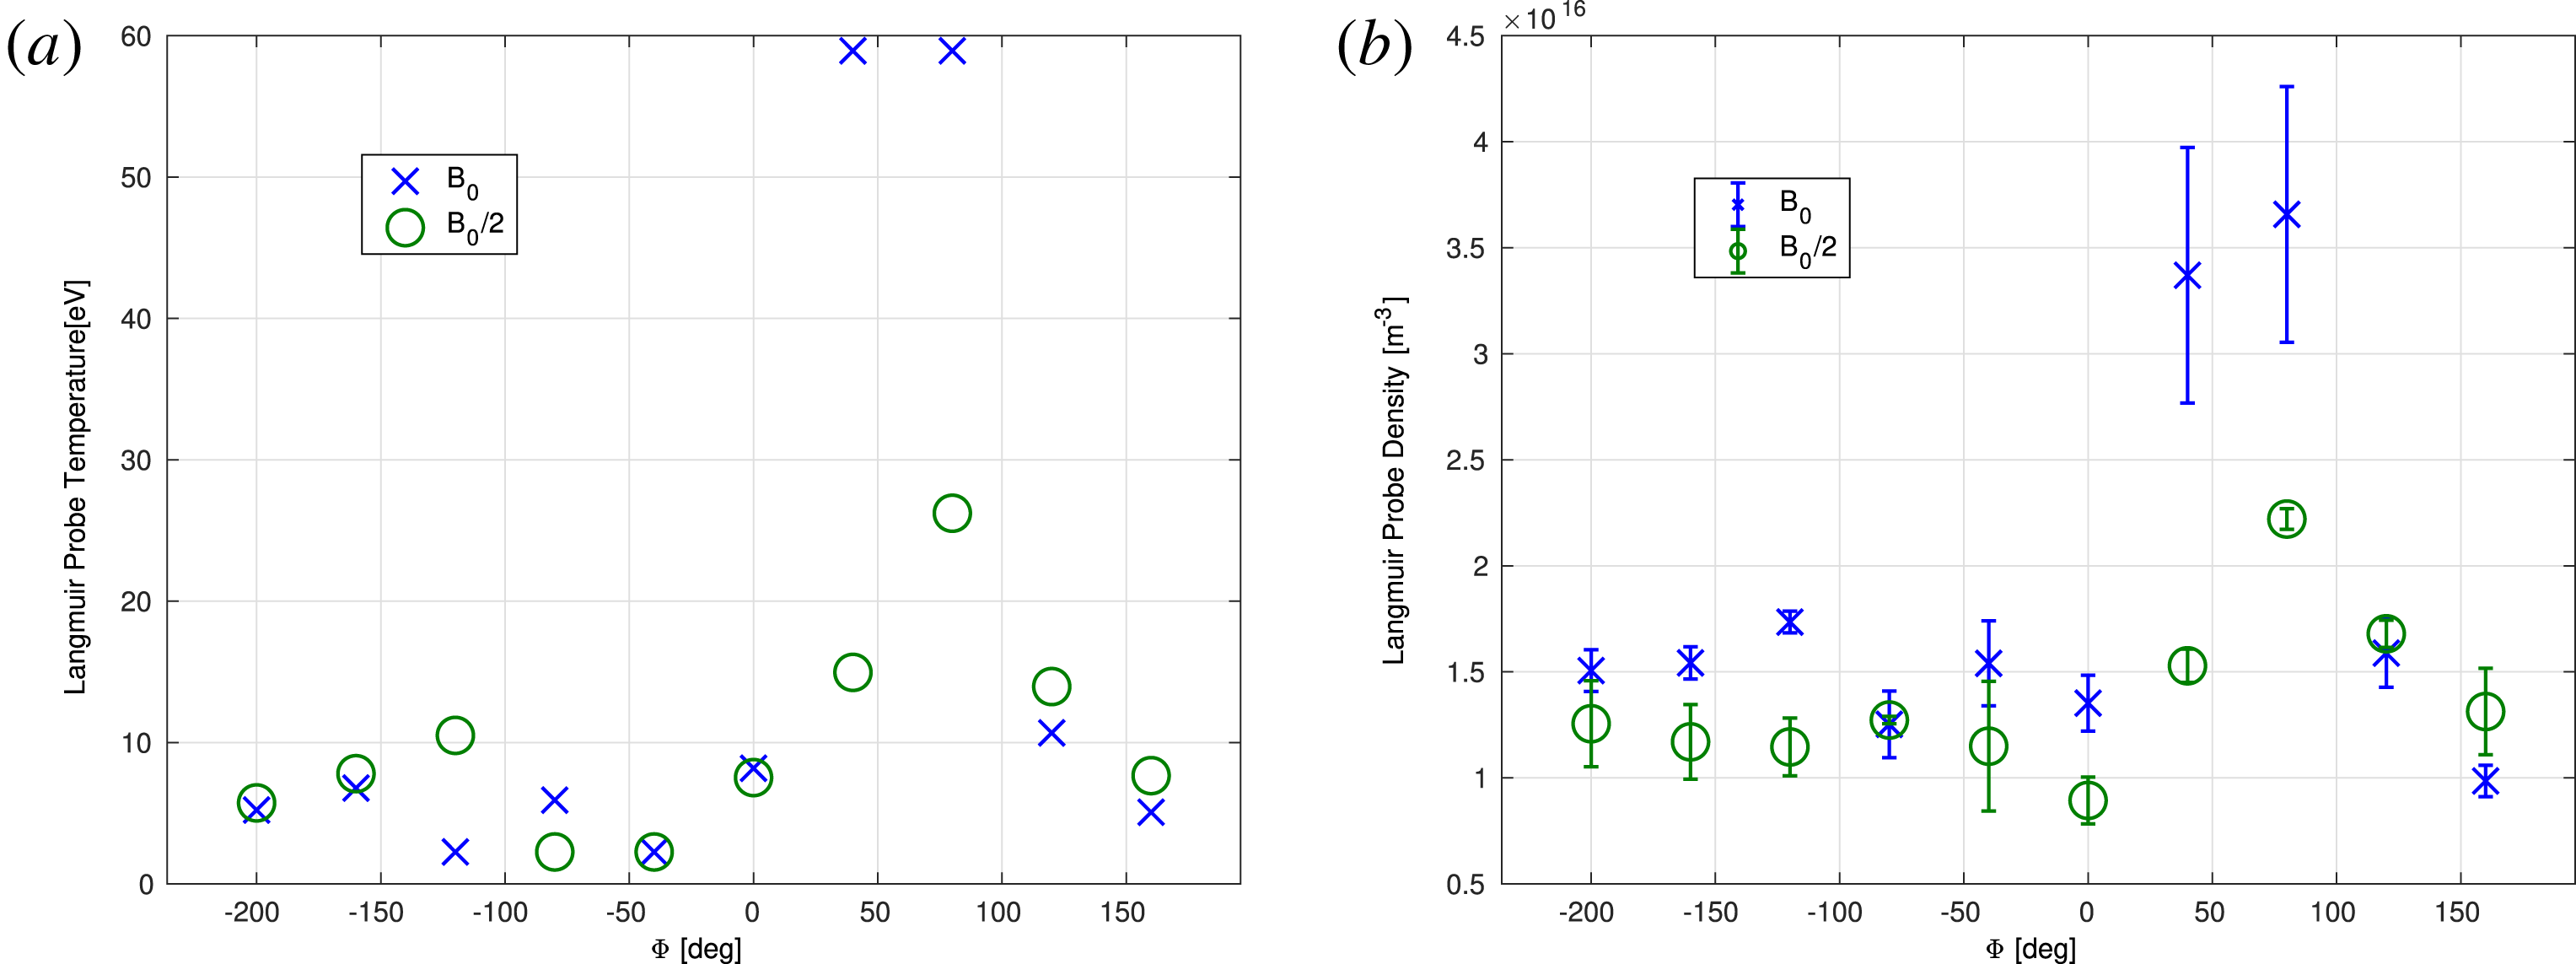
Figure 5. (a) Lower bound of temperature measurements. (b) Estimated density results based on the temperature results where the error bars represent the difference between the two probes. In blue,
![]() $B_{0}$
experiments. In green,
$B_{0}$
experiments. In green,
![]() $B_{0}/2$
experiments.
$B_{0}/2$
experiments.
4 Effect on stability
Evidence of azimuthal symmetry and consequently, plasma stability, is seen by the relative variations between the 6 XUV photodiodes. The response of the photodiodes is proportional to the inverse of the distance to the plasma column squared. They are situated close enough to the plasma such that the ratio of received radiation power at the detector between the close and far end of the plasma cross-section is approximately 10. If the plasma is also rotating, fluctuations will arise which transfer from one detector to the other in proper order (figures 6–8).
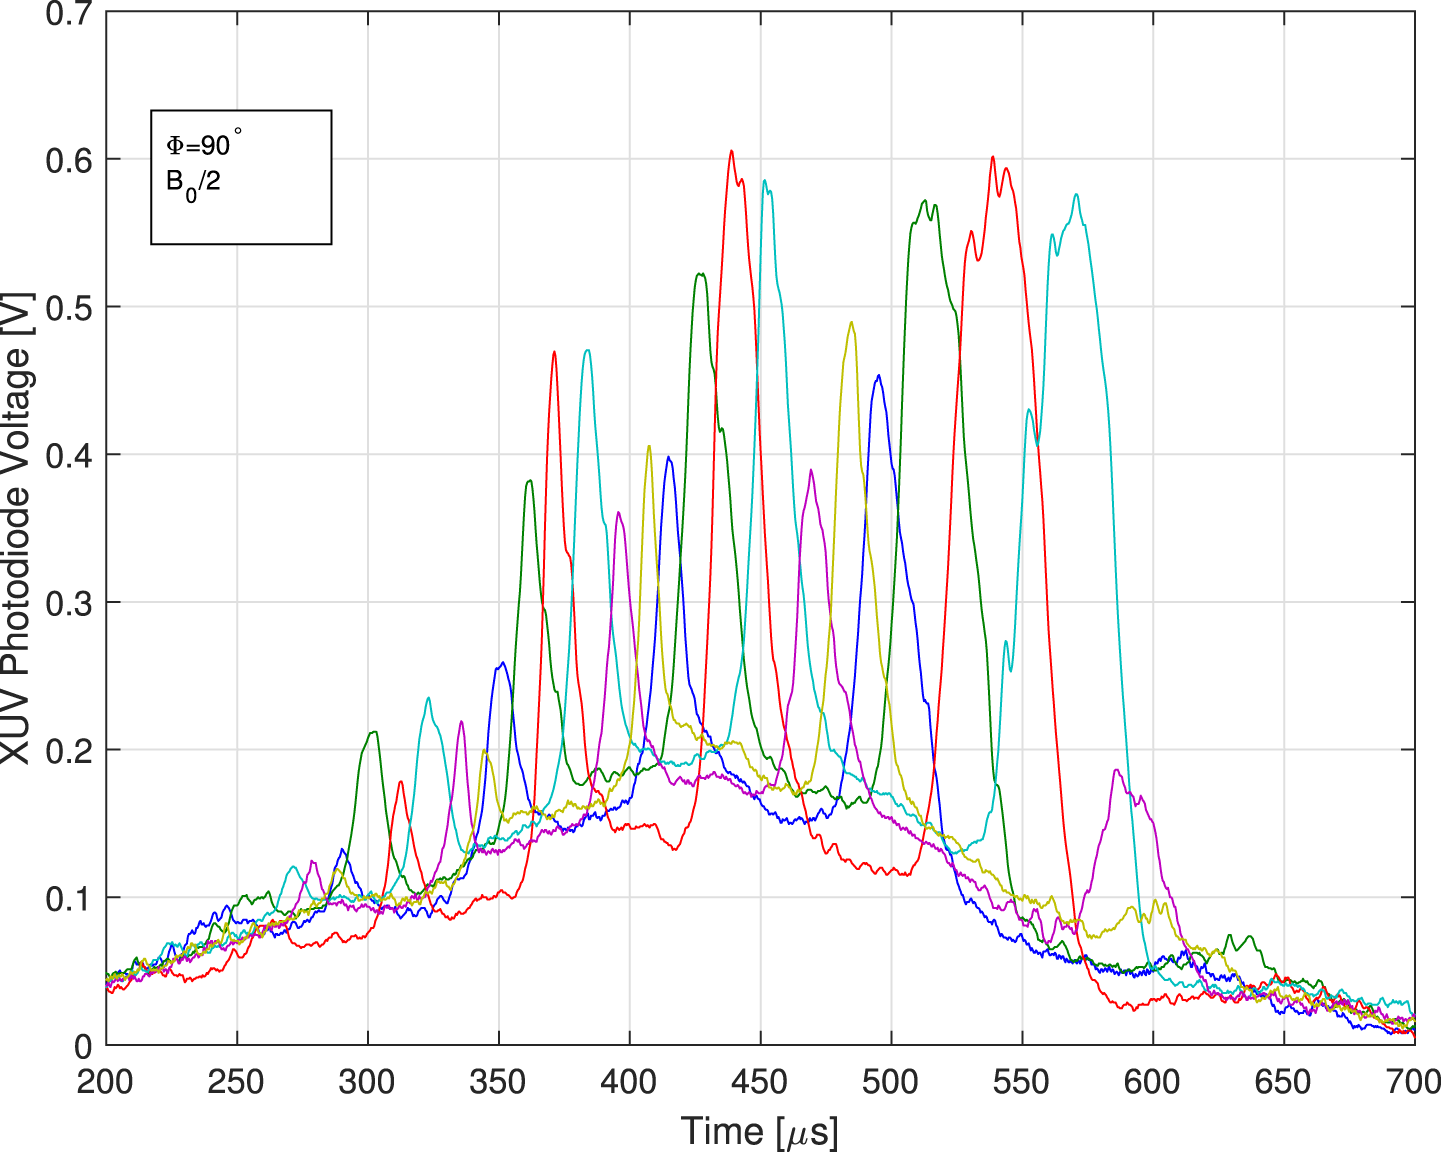
Figure 6. Fluctuations in XUV photodiodes voltages for a typical experiment with
![]() $90^{\circ }$
phase and half-magnetic field. The sequence of fluctuations corresponds to a rotating
$90^{\circ }$
phase and half-magnetic field. The sequence of fluctuations corresponds to a rotating
![]() $m=1$
flute mode.
$m=1$
flute mode.
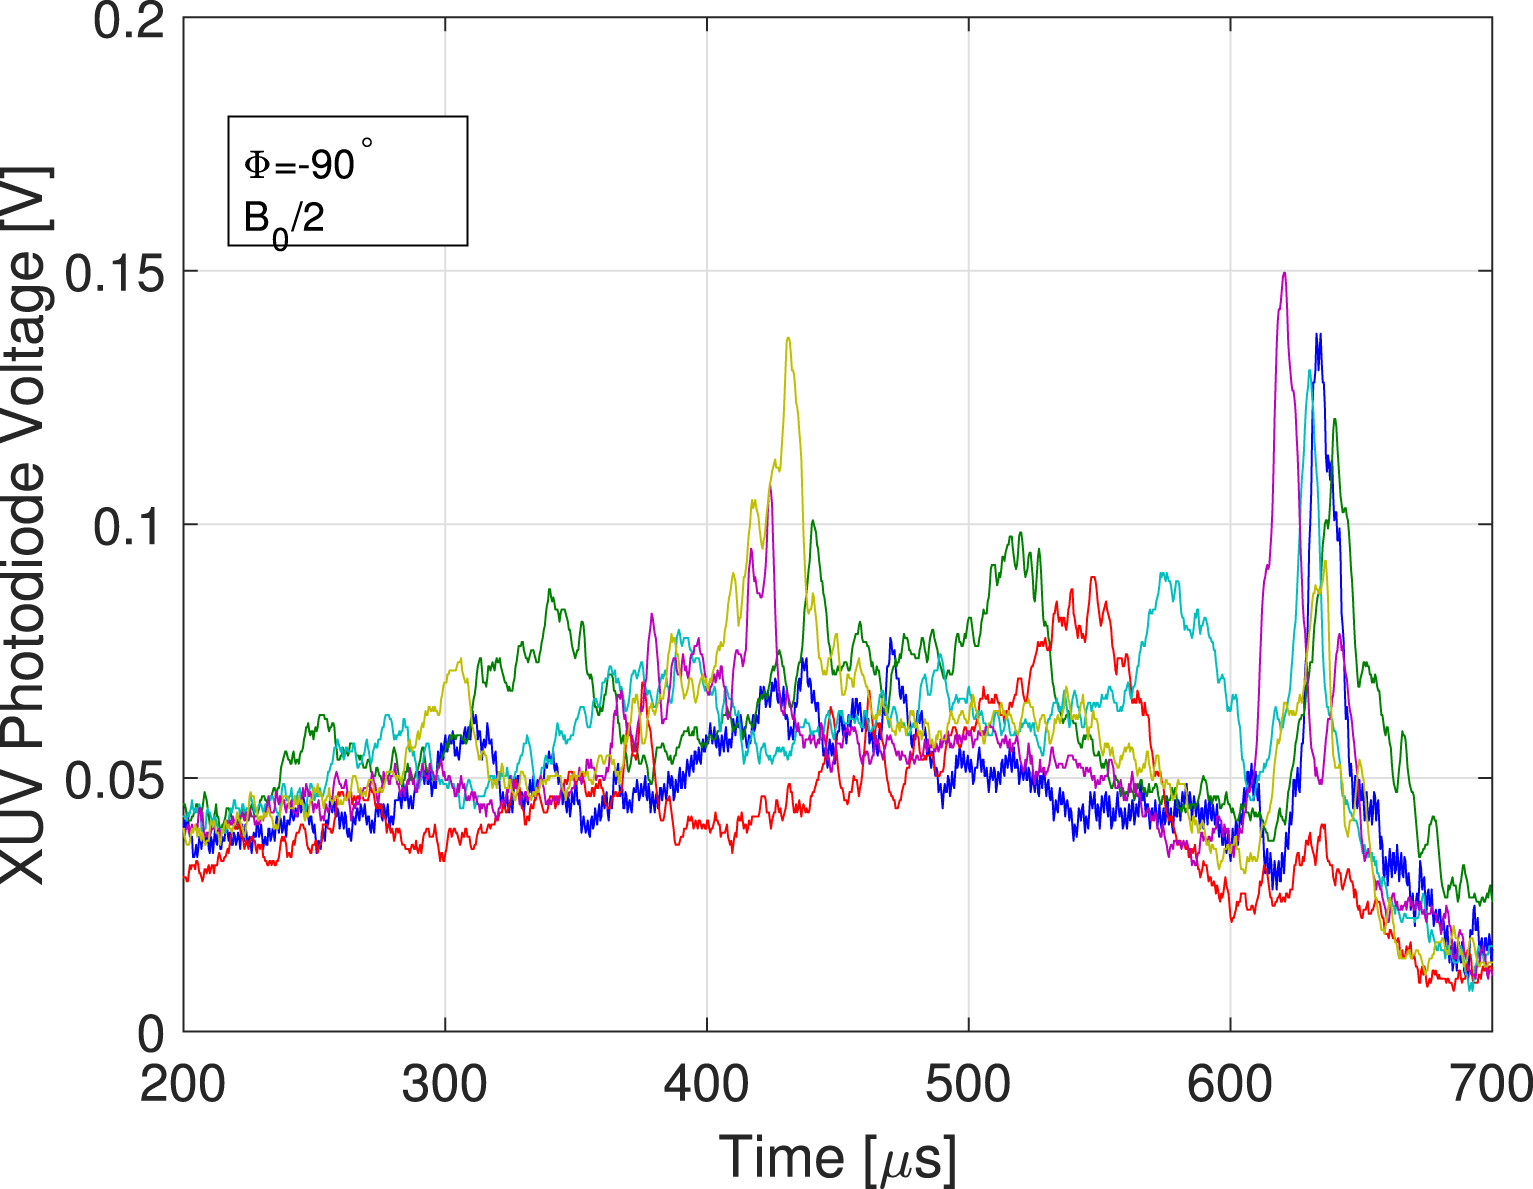
Figure 7. Fluctuations in XUV photodiodes voltages for a typical experiment with
![]() $-90^{\circ }$
phase and half-magnetic field.
$-90^{\circ }$
phase and half-magnetic field.
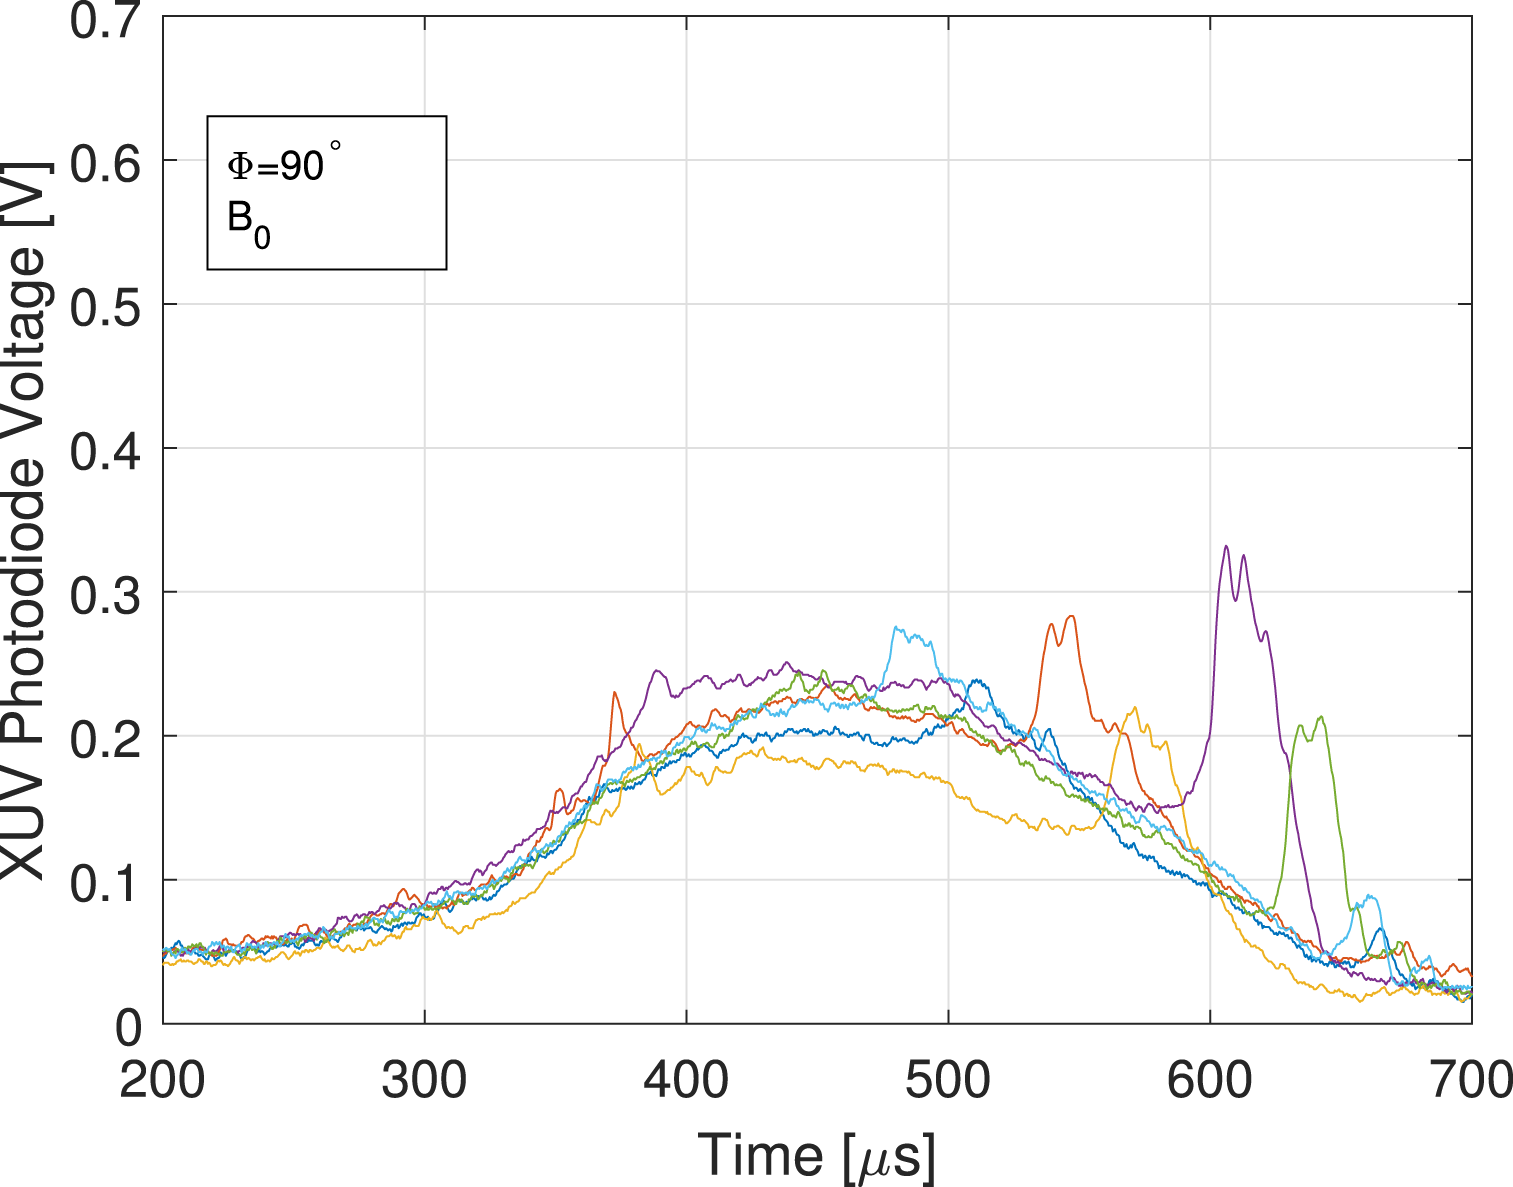
Figure 8. Fluctuations in XUV photodiodes voltages for a typical experiment with
![]() $90^{\circ }$
phase and full magnetic field.
$90^{\circ }$
phase and full magnetic field.
There is a major difference between the nominal and half-magnetic field experiments. The plasma seem to be stabilized in the nominal magnetic field experiments and the fluctuations start later in the experiment. In order to quantify this behaviour, azimuthal mode decomposition was used. The mode power was averaged over times
![]() $350{-}500~\unicode[STIX]{x03BC}\text{s}$
and several experiments (figure 9).
$350{-}500~\unicode[STIX]{x03BC}\text{s}$
and several experiments (figure 9).
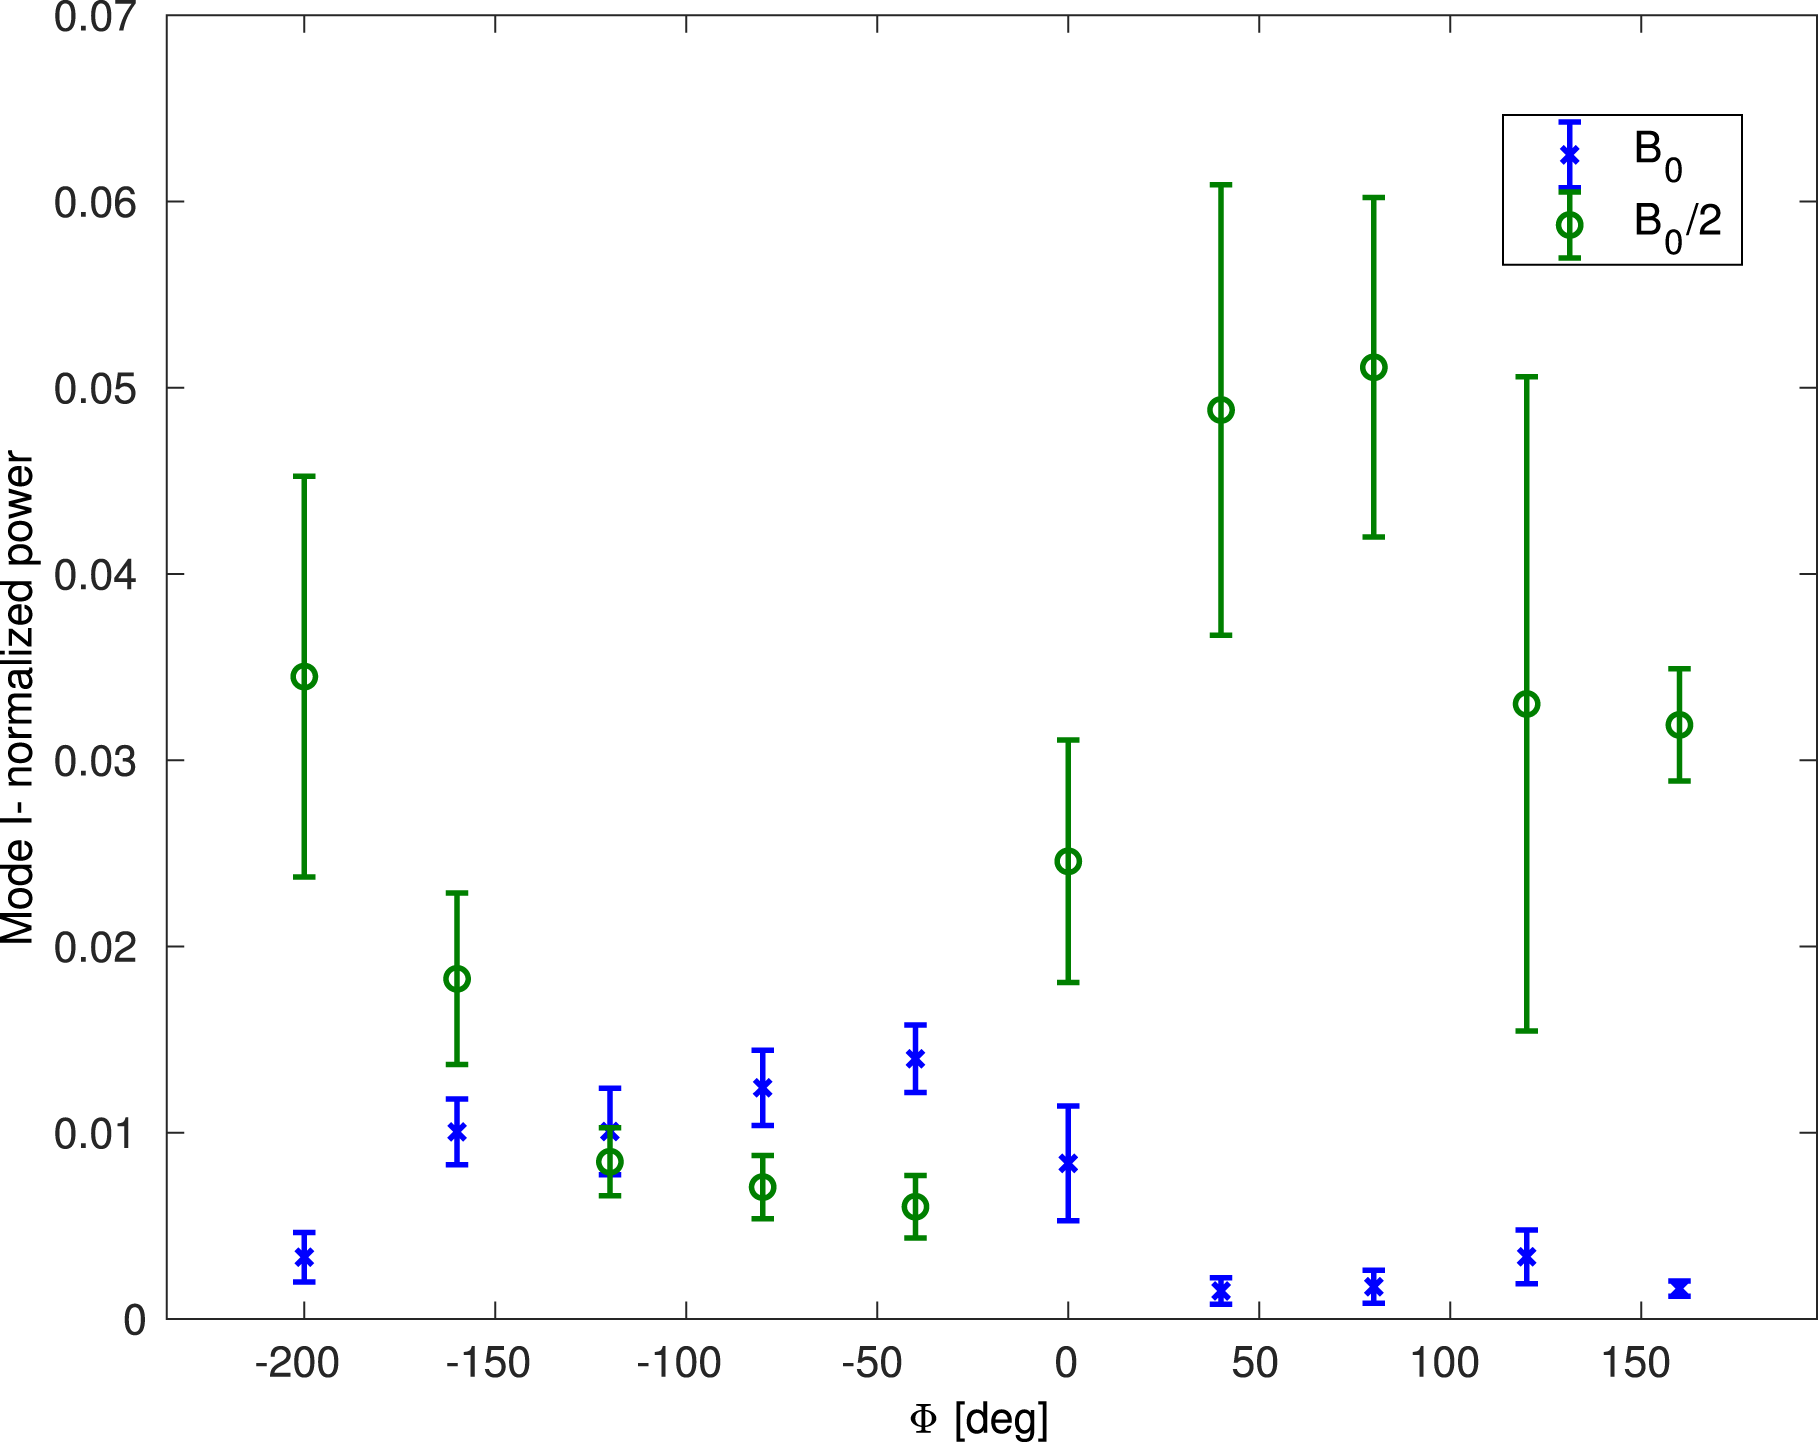
Figure 9. Averaged normalized
![]() $m=1$
mode power. In blue and green are experiments with
$m=1$
mode power. In blue and green are experiments with
![]() $B_{0}$
and
$B_{0}$
and
![]() $B_{0}/2$
trap magnetic field. There is an opposite behaviour between the
$B_{0}/2$
trap magnetic field. There is an opposite behaviour between the
![]() $B_{0}$
and
$B_{0}$
and
![]() $B_{0}/2$
experiments for different RF polarizations.
$B_{0}/2$
experiments for different RF polarizations.
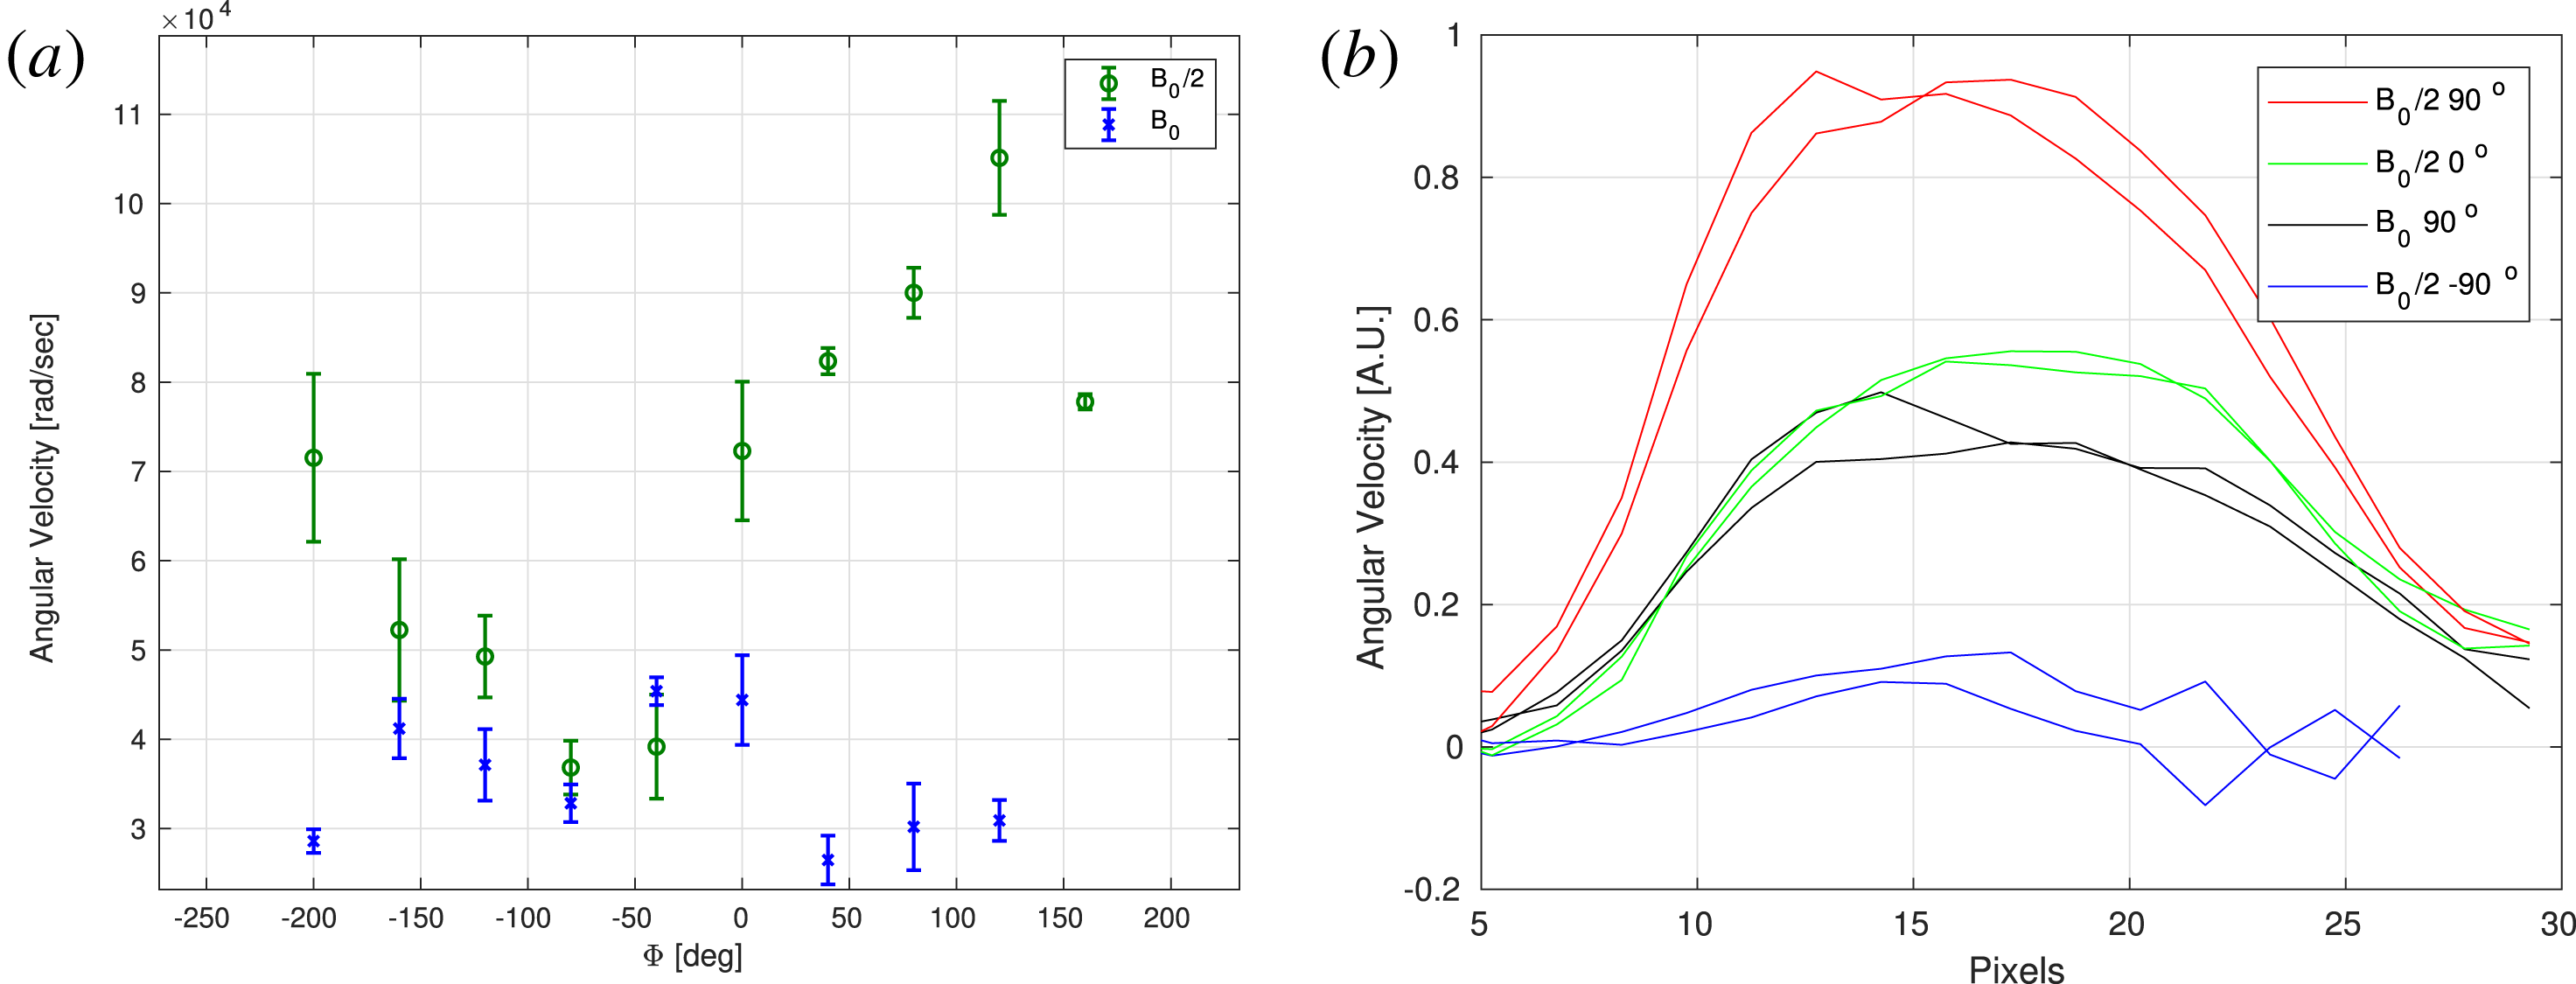
Figure 10. (a) Angular velocity measured by XUV photodiode cross-correlations as a function of phase between the RF antennae. Each point represents an average over 5 experiments while the bar represent one standard deviation. In blue and in red are measurements of the
![]() $B_{0}/2$
and
$B_{0}/2$
and
![]() $B_{0}$
experiments respectively. The results for the nominal magnetic field
$B_{0}$
experiments respectively. The results for the nominal magnetic field
![]() $B_{0}$
are inaccurate due to the fact the plasma is almost stable and there are less fluctuations to follow. (b) Angular velocity radial profile using fast photography.
$B_{0}$
are inaccurate due to the fact the plasma is almost stable and there are less fluctuations to follow. (b) Angular velocity radial profile using fast photography.
5 Plasma rotation and shear
Plasma rotation is measured by looking at peaks in the cross-correlation between nearest neighbour detectors (figure 10). These peaks represent a time difference of the fluctuation moving from one detector to the other (an angle change of
![]() $2\unicode[STIX]{x03C0}/6$
). The time differences were averaged for multiple experiments and the results show that for the half-magnetic field experiment, the highly coupled polarization also increased angular velocity (both in the right-hand direction). For the nominal magnetic field experiments, this technique is inadequate as there were almost no fluctuations during the relevant times.
$2\unicode[STIX]{x03C0}/6$
). The time differences were averaged for multiple experiments and the results show that for the half-magnetic field experiment, the highly coupled polarization also increased angular velocity (both in the right-hand direction). For the nominal magnetic field experiments, this technique is inadequate as there were almost no fluctuations during the relevant times.
Measurement of angular velocity radial profile was done using fast photography (figure 10). A Phantom camera with an exposure time of
![]() $2~\unicode[STIX]{x03BC}\text{s}$
was used. Differences between consecutive frames were calculated in order to resolve velocity profiles (Be’ery et al.
Reference Be’ery, Seemann, Fruchtman, Fisher and Nemirovsky2013). This technique has better spatial resolution and can resolve flow also for the high magnetic field experiment. The resulting profiles show some shear flow in the centre which might be due to plasma injection. There is some negative shear in the outer radius.
$2~\unicode[STIX]{x03BC}\text{s}$
was used. Differences between consecutive frames were calculated in order to resolve velocity profiles (Be’ery et al.
Reference Be’ery, Seemann, Fruchtman, Fisher and Nemirovsky2013). This technique has better spatial resolution and can resolve flow also for the high magnetic field experiment. The resulting profiles show some shear flow in the centre which might be due to plasma injection. There is some negative shear in the outer radius.
6 Discussion
In this experiment we measured effects of rotating magnetic fields as well as linear oscillating fields on the stability of a plasma in a magnetic mirror confinement trap. There is an observed increase in stability due to the external high frequency fields which is dependent on the phase between the antennae. This dependence is probably due to the different plasma coupling to the two circular modes. Low frequency shear Alfvén wave analysis predicts a difference in penetration length between the two parallel modes, but the decay length is approximately several metres long which is much bigger than the system size. Similar regimes and results were shown in Miljak & Chen (Reference Miljak and Chen1998).
There is also a dependence on the trap magnetic field strength which is not understood. The highly coupled polarization (
![]() $+90^{\circ }$
phase) increases fluctuations in the half-magnetic field experiments and decreases them for the nominal magnetic field experiments. The increase in fluctuations for the half-magnetic field experiments is expected due to the high frequency fields increasing the plasma temperature which increases the instability growth rate. The decrease in fluctuations for the nominal magnetic field experiments must be explained by a stabilizing mechanism. This is because the instability growth rate depends on the magnetic curvature which does not change and the temperature which increases in both experimental conditions.
$+90^{\circ }$
phase) increases fluctuations in the half-magnetic field experiments and decreases them for the nominal magnetic field experiments. The increase in fluctuations for the half-magnetic field experiments is expected due to the high frequency fields increasing the plasma temperature which increases the instability growth rate. The decrease in fluctuations for the nominal magnetic field experiments must be explained by a stabilizing mechanism. This is because the instability growth rate depends on the magnetic curvature which does not change and the temperature which increases in both experimental conditions.
The increase in stability might be explained by an increase in the pondermotive force (Yasaka & Itatani Reference Yasaka and Itatani1984). In our experiment the ion cyclotron frequency is approximately 0.85 MHz at the centre of the trap for the nominal magnetic field experiments and is proportional to the magnetic field strength. We can estimate the pondermotive force by the equation:
![]() $F_{pm}=(\text{e}^{2}/4m_{i})(|\unicode[STIX]{x1D735}E^{2}|/(\unicode[STIX]{x1D714}_{ci}^{2}-\unicode[STIX]{x1D714}^{2}))$
. The difference between the nominal and half-magnetic field experiments is approximately 20 %. If we take into account the gradual longitudinal spatial increase in the magnetic field and its overlap with the antenna position, this might increase to a 50 % difference in the pondermotive force between experiments. The amplitude of the pondermotive force is an order of magnitude bigger than the curvature force (
$F_{pm}=(\text{e}^{2}/4m_{i})(|\unicode[STIX]{x1D735}E^{2}|/(\unicode[STIX]{x1D714}_{ci}^{2}-\unicode[STIX]{x1D714}^{2}))$
. The difference between the nominal and half-magnetic field experiments is approximately 20 %. If we take into account the gradual longitudinal spatial increase in the magnetic field and its overlap with the antenna position, this might increase to a 50 % difference in the pondermotive force between experiments. The amplitude of the pondermotive force is an order of magnitude bigger than the curvature force (
![]() $F_{c}=kT/R_{c}$
), for both experiments and suggests that they are both stabilized, contrary to the experimental results. However, this calculation might be susceptible to either an overestimation of the pondermotive force due to an inaccuracy in the estimation of the electric field or to an underestimation of the temperature in the
$F_{c}=kT/R_{c}$
), for both experiments and suggests that they are both stabilized, contrary to the experimental results. However, this calculation might be susceptible to either an overestimation of the pondermotive force due to an inaccuracy in the estimation of the electric field or to an underestimation of the temperature in the
![]() $+90^{\circ }$
phase experiments.
$+90^{\circ }$
phase experiments.
Another parameter which might affect the stability is the increase in angular velocity. It can cause a destabilizing effect by increasing effective gravitational force which drives the instability or cause stabilization through shear. In our experiment we see some negative shear at outer radii. It is useful to compare the instability growth rate to angular velocity as both mechanisms depend on this ratio. The growth rate in our experiment is
![]() $\unicode[STIX]{x1D6FE}_{RT}\approx \sqrt[]{(\unicode[STIX]{x03C0}/r)(2kT/m_{i}R_{c})}\approx 1{-}2\times 10^{5}$
which is the same order of magnitude as the measured angular velocity for the
$\unicode[STIX]{x1D6FE}_{RT}\approx \sqrt[]{(\unicode[STIX]{x03C0}/r)(2kT/m_{i}R_{c})}\approx 1{-}2\times 10^{5}$
which is the same order of magnitude as the measured angular velocity for the
![]() $B_{0}/2$
experiment (
$B_{0}/2$
experiment (
![]() $\unicode[STIX]{x1D714}_{rot}\approx 1\times 10^{5}$
). These mechanisms do not explain why the increase in trap magnetic field also increases stability. An increase in magnetic field results in a decrease in the rotational velocity’s contribution to the instability, but would not resolve the curvature’s contribution. It would also reduce the stabilization effect.
$\unicode[STIX]{x1D714}_{rot}\approx 1\times 10^{5}$
). These mechanisms do not explain why the increase in trap magnetic field also increases stability. An increase in magnetic field results in a decrease in the rotational velocity’s contribution to the instability, but would not resolve the curvature’s contribution. It would also reduce the stabilization effect.
It is also not clear whether the increase in angular velocity is due to a torque force of the RMF or due to heating of the electrons which increase the radial electric field. If we estimate the electric potential using virial theorem (
![]() $kT\approx (1/2)eE_{r}r$
), this drives a rotation motion due to
$kT\approx (1/2)eE_{r}r$
), this drives a rotation motion due to
![]() $E\times B$
motion:
$E\times B$
motion:
![]() $\unicode[STIX]{x1D714}_{rot}=v/r=(1/r)(E_{r}/B)\approx 2(kT/e)(1/Br^{2})$
. This results in
$\unicode[STIX]{x1D714}_{rot}=v/r=(1/r)(E_{r}/B)\approx 2(kT/e)(1/Br^{2})$
. This results in
![]() $\unicode[STIX]{x1D714}_{rot}\approx 6\times 10^{4}$
for the half-magnetic field experiment for an electron temperature of 10 eV. This is in agreement with the experimental results.
$\unicode[STIX]{x1D714}_{rot}\approx 6\times 10^{4}$
for the half-magnetic field experiment for an electron temperature of 10 eV. This is in agreement with the experimental results.


