


Introduction
Niveo-aeolian processes are known to significantly affect terrestrial periglacial environments (McKenna Neuman Reference McKenna Neuman1993). In the McMurdo Dry Valleys of Antarctica, surface snowfall deposits are typically subject to high rates of sublimation due to the polar desert environment as well as melt when ambient temperatures climb above 0°C (Clow et al. Reference Clow, McKay, Simmons and Wharton1988). These processes of sublimation and melt both work to remove snow deposits in Antarctica by converting the snow to vapour and liquid water, respectively. However, we hypothesize that burial of snowpacks by aeolian transport of sand may serve to protect the snow from the ambient atmospheric environment and thereby prolong the lifetime of the snowpack by inhibiting these snow removal processes. Through this work we intend to investigate this hypothesis and quantify any duration of snowpack preservation as a function of snowpack burial depth.
Snowpacks represent a key source of water in the arid Dry Valleys environment and thus play several important roles within the Antarctic system. Snowpacks can serve as sources of water vapour to stabilize ground ice in the Dry Valleys (McKay Reference McKay2009), as a source of liquid water for soil microorganisms (Friedmann Reference Friedmann1982), and in the delivery and mobilization of salts and other soluble compounds in the soil (Campbell & Claridge Reference Campbell and Claridge1969). Snowmelt is also a key source of liquid water for many Antarctic dry valley lakes (Chinn & Cumming Reference Chinn and Cumming1983). The expected rapid response of snowpacks to atmospheric conditions could also make them a good proxy for short-term climate change. However, despite the important role buried snowpacks play in the Antarctic (Dort Reference Dort1967), there is very little knowledge regarding the stability and durability of such snowpacks in the Dry Valleys.
This paper documents the nature and evolution of four distinct buried snowpack deposits within Pearse Valley in the McMurdo Dry Valleys. We examine the physical conditions of the buried snowpacks as these deposits represent a naturally occurring system whereby atmospheric precipitation (snowfall) is buried by windblown sediment and thus protected from direct contact with the arid Antarctic atmosphere. We demonstrate how the processes of deposition and burial can help to preserve the snowpacks in the McMurdo Dry Valleys, and also explore the relevance of similar processes that may be occurring on present-day Mars.
Study site
The McMurdo Dry Valleys, located from 73–78°S and 160–164°E, are situated along the western coast of the Ross Sea in Antarctica and represent the largest ice-free region on the continent. The Dry Valleys span an area of 15 000 km2 with c. 30% of its area free of ice (Vincent Reference Vincent1996). The ice-free regions exist because the Transantarctic Mountains block the flow of the East Antarctic Ice Sheet. The geology of the valleys consists primarily of metamorphic and granitic bedrocks overlain by sandstones with dolerite intrusions.
The Dry Valleys are within a polar desert environment with less than 10 cm (water equivalent) of precipitation per year, measured ablation rates of 10–15 cm yr-1 for glacier ice and 30–35 cm yr-1 for lake ice covers (Hendersen et al. Reference Hendersen, Prebble, Hoare, Popplewell, House and Wilson1965, Clow et al. Reference Clow, McKay, Simmons and Wharton1988), and mean annual air temperatures ranging from -17 to -35°C (Clow et al. Reference Clow, McKay, Simmons and Wharton1988, Doran et al. Reference Doran, McKay, Clow, Dana, Fountain, Nylen and Lyons2002). As precipitation levels are so low, most of the liquid water in these regions emanates as glacial discharge from the surrounding glaciers that feed the streams and lakes present on valley bottoms.
Our work is focused specifically within Pearse Valley, Antarctica. Figure 1 is an ASTER image showing Pearse Valley (c. 500 m elevation) and the geographic location of the study area. Pearse Valley is an extension of Taylor Valley and is located between the Taylor Glacier and the Asgard Range. Pearse Valley is essentially a part of Taylor Valley that is currently bypassed by Taylor Glacier (Hendy Reference Hendy2000). Pearse Valley contains two small enclosed drainage lakes, Lake House (completely frozen) and Lake Joyce (floating ice cover) (Hendy Reference Hendy2000). Due to its geographic location and elevation, air temperatures in Pearse Valley can rise above 0°C during the summer months. Pearse Valley is subject to katabatic winds and/or eddies which frequently blow up-valley (e.g. off the Taylor Glacier and up Pearse Valley towards Lake House, Fig. 1).

Fig. 1 ASTER image showing Pearse Valley and the location of the study site. The inset image shows the location of the gullies, ponds, and field sites 1, 2, 3, and 4.
Wind is the main mechanism that mobilizes and disperses particulates throughout the valleys (Doran et al. Reference Doran, McKay, Clow, Dana, Fountain, Nylen and Lyons2002). The long axis of the valleys typically runs transverse to the major katabatic winds from the Ross Ice Shelf (Parish & Bromwich Reference Parish and Bromwich1987). The valleys are often also subject to strong local glacier drainage winds (Doran et al. Reference Doran, McKay, Clow, Dana, Fountain, Nylen and Lyons2002). The combination of low precipitation coupled with the potential evaporation, low surface albedo, and katabatic winds descending from the Polar Plateau causes the extremely arid conditions of the McMurdo Dry Valleys (Clow et al. Reference Clow, McKay, Simmons and Wharton1988, Doran et al. Reference Doran, McKay, Clow, Dana, Fountain, Nylen and Lyons2002, Nylen et al. Reference Nylen, Fountain and Doran2004). The warm, dry winds that blow up-valley in Pearse Valley may be eddies emanating from the katabatic winds. These winds have a low relative humidity and thus promote evaporation due to this low relative humidity condition coupled with the process of winds stirring the boundary layer.
Methodology
The sections below describe the methodology used to study the Pearse Valley buried snowpack deposits. The deposits were discovered by this team in November 2009 and were subsequently studied in situ as well as by further laboratory analyses of collected sand and snow samples. Multiple techniques were used to study the Pearse Valley deposits including in situ observations, moisture content measurements, particle size measurements, visible to near-infrared spectroscopy, meteorological measurements, and O-H isotope analysis.
Trench observations and sample collection
Trenches were excavated to expose the subsurface layering of sand and snow at each Pearse Valley field location on 23–25 November 2009. Each trench measured c. 1 m long and was excavated by hand using a standard shovel to dig into the sand-covered snowpack deposits. A wall of the trench was cleared to examine the subsurface stratigraphy. Each trench displayed a unique layering sequence composed of sand, snow, ice, and/or ice-cemented ground which is representative of the various formation and depositional processes affecting each area. Visual observations of the layering sequence were recorded and each trench was photographed. The thickness of each distinct layer was measured in situ. Descriptions of the field site as well as Global Positioning System (GPS) co-ordinates were recorded. The same trenches were revisited 1–2 days later to examine changes in the subsurface snowpacks. On this second visit, observations of the initial trench were recorded, and new trenches were excavated within 1 m of the original site in order to examine a pristine trench wall that had not been previously exposed to the atmosphere.
Samples were collected from several layers exposed in the trench walls at each of the four field sites. These samples are listed in Table I. Sediment and snow samples were collected in a combination of polyethylene Whirl-Pak bags, falcon tubes, and plastic bottles. Samples were sealed immediately upon collection in the field to retain any moisture within the sample.
Table I Moisture content for each of the twelve samples collected at the four field sites in Pearse Valley.
Moisture content measurement
The moisture content of each sample was determined by heat-drying the samples to determine the sample moisture content by mass. Sample masses after collection in the field were measured in the laboratory. The containers were then unsealed and heated at low temperature (45°C) for five days to liberate any water contained within the sample. The samples were then reweighed immediately after being removed from the oven. Samples were heated until the mass remained constant over a 24 hour period in the oven, indicating the water had been thoroughly removed from the sample. The moisture content by mass of each sample was then determined based on the pre- and post-heating sample masses.
Particle size measurement
The particle size distribution for each sediment sample has been determined using a standard wet sieve particle measurement protocol. A known mass of sample was placed into a stacked set of sieves (USA Standard Sieve, Humboldt Mfg Co.) using sieve sizes of 4750, 2000, 850, 500, 250, 150, 106, 75, 53, and 38 microns. The sediments were washed through the sieves with water, dried overnight in an oven set at 45°C, and then the remaining sample corresponding to each sieve was measured to determine the mass distribution as a function of particle size.
Visible to near-infrared reflectance spectroscopy
To determine whether or not the multiple sand samples were composed of the same or different mineral components, visible to near-infrared (0.35–2.5 microns) reflectance spectra of the sand samples from the Pearse Valley buried snowpack deposits were obtained in the laboratory using an ASD FieldSpec Pro. Spectra of each sample were obtained after the samples had undergone complete drying for the moisture content measurements as described above.
Meteorological measurements
A meteorological station was deployed by this team in Pearse Valley in November 2009 at 77°43.138′S and 161°35.829′E. Data were collected at 30 minute intervals and stored on a Campbell CR1000 logger. Instrumentation on the Campbell weather station includes a Campbell 207 temperature and humidity probe, Campbell 107 temperature probe, R.M. Young Wind Monitor, and LI200X Pyranometer. The Campbell 207 probe uses a thermistor to measure temperatures from -36°C to +49°C with a relatively small margin of error (< 0.4°C). The relative humidity (RH) accuracy is typically better than 5% over the entire RH range. The 207 probe is mounted 1 m above the ground to measure ambient air temperatures and humidity. The 107 probe consists of a thermistor (the same thermistor as is used in the 207 probe) which has been placed 10 cm below the ground surface to measure the temperature within the dry permafrost. The wind monitor measures both wind speed and direction and can measure wind speeds ranging from 0–60 m s-1 (130 mph). The pyranometer measures incident solar radiation using a silicon photovoltaic detector and operates over a wavelength range of c. 400–700 nm. The pyranometer is mounted on the meteorological station 1 m above the ground surface to measure incoming solar radiation. The meteorological station instrumentation was mounted 1 m above the surface due to the practicalities of mounting the pole and ensuring the robustness of the station to survive in Antarctica for multiple field seasons. The station was fully operational in Pearse Valley on 25 November 2009. The meteorological station continues to collect data which will be downloaded in subsequent field season(s).
Stable O-H isotope analysis
Pearse Valley buried snowpacks and overlying sand were sampled in November 2009 to determine the source of the snow and moisture in the sand. The snow and sand were collected using a stainless steel spatula and transferred in 20 ml and 50 ml polyethylene bottles, respectively. The pore water in the sand was extracted in the laboratory using a glass transfer line. The sample was placed in a glass flask, heated to 150°C and evolved water vapour collected in glass exetainers using liquid nitrogen. The 18O/16O and D/H ratios of water samples (snow and pore water) were determined using a liquid water analyser (Los Gatos Research Liquid Water Analyzer model 908-0008). This instrument uses off-axis integrated cavity output spectroscopy (OA-ICOS) and relies on spatial separation of reflections from highly reflective mirrors installed within the optical cavity. The OA-ICOS liquid water analyser was coupled to a CTC LC-PAL autosampler for simultaneous 18O/16O and D/H ratios measurements of H2O. All measured water samples were calibrated and normalized to internal laboratory water standards that were previously calibrated relative to Vienna Standard Mean Ocean Water (VSMOW) using a conventional isotope ratio mass spectrometer. Consequently, the results are presented using the δ-notation (δ18O and δD), where δ represents the parts per thousand differences for 18O/16O or D/H in a sample with respect to VSMOW. Analytical reproducibility for δ18O and δD is ± 0.3‰ and ± 1‰, respectively. The complete measurement procedure and performance of the liquid water analyser is described in Lis et al. (Reference Lis, Wassenenaar and Hendy2008).
Data
Four distinct sites are studied as representative examples of buried snowpacks in Pearse Valley. Each of these sites has a unique subsurface stratigraphy which allows us to study the effects of varying thicknesses and sequences of snow and ice layers. A summary of the subsurface stratigraphy for each site is shown in Fig. 2 with detailed descriptions in the subsequent sections. These field sites are named as 1) ‘Gully’, 2) ‘Upper Rocks’, 3) ‘Ridge’, and 4) ‘Pond’ (Fig. 1). Sites 1, 2, and 3 (‘Gully’, ‘Upper Rocks’, and ‘Ridge’, respectively) are located at 77°42.430′S, 161°35.795′E at 456 m elevation. Site 4 (‘Pond’) is located at 77°42.518′S, 161°35.949′E at 452 m elevation. The buried snowpacks are studied using a variety of techniques as described in the Methodology section and these data are presented below.

Fig. 2 Schematic summary of subsurface trench stratigraphy. The vertical scales for each of the four sites are not equal in order to more clearly show the different layers of sediment, snow, and ice at each field site.
In situ observations
Site 1: ‘Gully’ snow pit
The ‘Gully’ snow pit site is within the lower reaches of a gully channel (site 1 in Fig. 1). The gully channels are on the lower reaches of the granite cliffs which serve as an accumulation site for snow and ice. The gully experiences intermittent seasonal flow and serves as a conduit for melting snow, ice, and glacial deposits from the upper reaches of the surrounding cliffs during the summer months.
Observations of a trench cross-section were collected on 24 November 2009. Scattered snow deposits were observed on the surface but were relatively scarce in this region. The top (surface) layer of the trench had a thickness of 6.4 cm and was composed of fine sand with a particle size distribution peaking at 250 microns (Fig. 3). There was no obvious layering present within this uppermost sand deposit. The sand was moist on the day of initial observation and the uppermost moist sand layer had a water content of 8.5 wt % (Table I).

Fig. 3 Particle size distributions for buried snowpack sediments, Pearse Valley. Sample numbers correspond to those listed in Table I.
The next layer in the sequence had a thickness of 6.4 cm and was composed of alternating layers of sand and snow. The layers of sand alternated from finely layered (1 mm or less) to slightly thicker layers (several millimetres in thickness). The layers of snow likewise varied in width but typically had thicknesses of the order of several millimetres. The thickest sand deposits were at the top and bottom of this layer with finer sand layers in the middle of the snow deposit.
Next in the sequence was a layer of buried snow with a thickness of 22.9 cm. Individual sand grains were observed randomly interspersed within the snowpack and the sediment content embedded within the snow was 3 wt %. This portion of the snowpack was thus mostly snow but with minor sand impurities (i.e. dirty snow). However, this lower snow layer did exhibit some thin layers (millimetres) of sand deposits as well. These layers contained more concentrated deposits of sand compared with the rest of the snow layer. Sand layers in the uppermost portion of the snow were relatively thin (millimetres or less) while the sand layers become slightly wider (few millimetres thickness) towards the bottom one third of the snowpack layer. The snow itself was composed of larger snow crystals ranging from c. 0.5–1.0 mm in diameter. This entire sequence of snow and sand deposits was resting on a layer of ice-cemented ground which was observable at the bottom of the trench beneath the lowermost layer of snow. No reworking of the ice-cemented ground was observed.
Further excavations within several metres of the initial trench show lateral heterogeneity in the subsurface distribution of the snow deposits and sand layers. Heterogeneity was seen even within this one snow pit along the length of this excavation, particularly as the thickest snow deposit pinched out at the distal end of the trench. The general layering stratigraphy remained relatively constant throughout the trench but the layer thicknesses varied slightly (e.g. within several millimetres). A significant variation within this trench was that the sequence on the right side of the trench rested on ice-cemented ground while the sequence on the left side rested on an ice deposit.
Site 2: ‘Ridge’ snow pit
This site is located along an upper ridge at the side of the gully channel (site 2 in Fig. 1). This site is not located within the gully itself but instead is on the upper ridge flanking the gully channel. The ridge snow pit is down-slope of the dolerite cliffs which extend behind the gullies at this site.
Observations of a trench cross-section were collected on 23 November 2009. Surface snow deposits were not observed at this site on the day of observation. The top (surface) layer of the trench had a thickness of 7.3 cm and was composed of fine sand with a particle size distribution peaking at 250 microns (Fig. 3). There was no obvious layering present within this uppermost sand deposit. The sand was moist on the day of observation. This uppermost moist sand layer had a water content of 5.9 wt % (Table I).
This layer was followed by a layer of snow with a thickness of 4.0 cm. Thin (sub-millimetre) layers of sediment within the snowpack were observed. These thin sediment layers were present throughout the snowpack and showed no obvious preference for any particular location within the deposit. The inter-sand layers of snow also contained individual sand grains interspersed throughout the snow which were observable by eye. The sediment content embedded within the snow was 16 wt %. However, the thickness of the snow layer varied where the snow layer pinched out away from its thickest section at the right corner of the trench.
Below the snow layer was relatively dry sand. The moisture content of the sand was measured as 1.0 wt % and the particle size distribution peaked at 250 microns (Fig. 3). No layering was evident in this layer and the deposit was primarily loose, unconsolidated sand lying beneath the snowpack. Revisiting the ‘Ridge’ field site one day after initial measurements were collected showed that the original snow layer had disappeared and the lower dry sand layer had become moist.
Site 3: ‘Upper Rocks’ snow pit
A trench was excavated further up along the upper ridge at the side of the gully channel (site 3 in Fig. 1). This location is at the boundary between the rocky upper deposits and more fine-grained sediment deposits out-flowing from the gullies down towards the snow covered pond.
Observations of a trench cross-section were collected on 23 November 2009. Small amounts of scattered snow were present on the ground on the day of observation but significant surface snow deposits were lacking. The top layer of the trench was composed of a moist sand layer with a thickness of 1.1 cm. The uppermost moist sand layer had a water content of 19 wt % (Table I). No layering was evident in this uppermost sand deposit.
The top layer was followed by a layer of snow with a thickness of 4.6 cm. The snow was relatively pure and lacked significant banding of sediment layers. Individual sand grains were observed within the snow layer itself, and the soil content embedded within the snow was 2 wt %. The snow itself was composed of larger snow crystals ranging from c. 0.5–1.0 mm in diameter.
The boundary between the snow and overlying sediment was an unconformable contact where individual sand grains had penetrated into the snow. The trench cross-section showed evidence of sand sunken into the snow layer from above, yielding an irregular contact of sand and snow. Beneath the snow layer was ice-cemented ground.
Site 4: ‘Pond’ snow pit
A trench was excavated near the snow covered pond as shown in Fig. 1 (site 4). This location is located c.10 m from the edge of the pond and resides within the broader depositional fan of the gully systems.
Observations of a trench cross-section were collected on 23 November 2009. The ground was partially snow covered at the area of excavation. The top trench layer was composed of sand grains and had a thickness of 4.4 cm. The particle size distribution peaked at 500 microns (Fig. 3). The sand was moist on the date of collection and the uppermost moist sand layer had a water content of 5.7 wt % (Table I). Layering of sand particles was not evident within this deposit.
Some portions of the top layer of moist sand were ice-cemented. This icy layer had a thickness of several millimetres and was only found beneath the areas where snow was still on the surface of the ground. Ice-cemented layers were only found directly beneath snow-covered surfaces.
Next in the sequence was a snow layer with a thickness of 2.0 cm. The snow lacked any significant banding by sediment layers. Sediment interspersed within the snow represented 5 wt % (Table I). The upper sand layer showed significant instances of sand particles intertwined with the snow deposit at the sand-snow boundary. The snow layer pinched out toward the end of the trench, showing some variation in snow thickness ranging from 2 cm to several millimetres.
The snow layer was followed by two layers of finer material (size fraction peaked at 250 microns for both layers, Fig. 3). The first layer directly below the snow was a finer grained sediment with a thickness of 0.8 cm. This layer was ice-cemented and had a water content of 7.4 wt % (Table I). The next layer was also composed of the finer sand but was not ice-cemented. This layer had a thickness of 0.9 cm and a water content of 5.6 wt % (Table I). Below these two layers of finer sand was another layer of the coarser material with a layer thickness of 1.8 cm. This layer was not ice-cemented. The entire sequence rested upon ice-cemented ground found at a depth of 9.9 cm from the surface.
Reflectance spectra
Visible to near-infrared reflectance spectra of each sample from each of the four sites at Pearse Valley are presented in Fig. 4. Each of the samples obtained from each site (including the overlying sand layers as well as sand layers embedded within the snow deposits) are spectrally similar. The spectra all show the same overall shape with absorption bands located at the same wavelengths, requiring only a scaling factor in reflectance to explain the differences.

Fig. 4 Visible reflectance spectra collected of each sample from the four field sites in Pearse Valley. Sample numbers correspond to those listed in Table I.
Meteorological measurements
Temperatures and wind speed and direction were measured at the Pearse Valley meteorological station. Figure 5 shows the air and ground temperature data for several days just following the period of in situ trench observation (the meteorological station was not yet operational on the exact dates of trench observation). Air temperatures during this time did not exceed 0°C. However, ground temperatures did exceed freezing with a peak temperature of 10°C due to solar heating. Ground temperatures above 0°C during this time can allow for melting of near-surface snow and ice to liquid water.
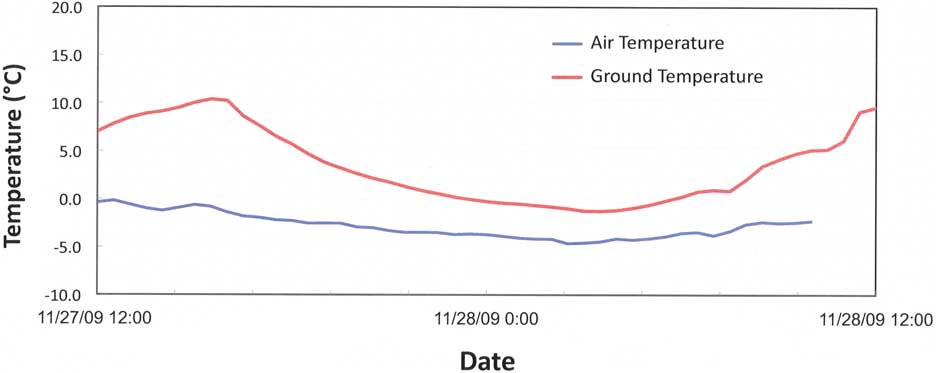
Fig. 5 Air and ground temperature measurements from Pearse Valley.
Wind speed and direction measurements are shown in Fig. 6a & b, respectively. Data collection began on 27 November 2009 and data are shown until mid-October 2010. The strongest measured winds had a speed of nearly 15 m s-1. The meteorological station measures an instantaneous wind speed every 30 minutes and thus stronger winds may have been present but were not recorded due to the sampling frequency of the instrument. Throughout the year wind speeds regularly exceeded 5 m s-1 (Fig. 6a). The most frequent and highest velocity winds most commonly had a wind direction of c. 108–144° (Fig. 6b). Since 0° wind direction is defined as due north, these strong and frequent winds are coming from the direction of the Taylor Glacier. These winds may be eddies emanating from the katabatic winds.

Fig. 6 a. Wind speed measurements from Pearse Valley. b. Wind run measurements from Pearse Valley show the relative distribution of wind strength and frequency as a function of wind direction, and thus is dominated by the strongest winds. The wind run diagram represents wind speed times the amount of time at that speed as a function of wind direction. Graph labels indicate the wind direction where 0° is north. These data demonstrate that the strongest, most frequent winds come down the Taylor Glacier and blow up-valley.
O-H isotope measurements
The isotope measurements can be used to determine the origin of the buried snow and also its subsequent behaviour (i.e. sublimation, melt etc.) throughout the season. The δ18O composition of the Pearse Valley ‘Gully’ site buried snowpack varies between -43.3 and -40.3‰. Conversely, fresh snow collected in November 2009 at the same Pearse Valley site yielded δ18O values between -29.2 and -26.9‰. This amplitude in δ18O values from Pearse Valley is within the range of that measured between 1993 and 2003 from fresh snow, snow pits and shallow ice cores in the McMurdo Dry Valleys (Gooseff et al. Reference Gooseff, Lyons, McKnight, Vaughn, Fountain and Dowling2006). Therefore, the low δ18O values of the buried snowpack suggest that it was deposited in winter and subsequently buried by sand. Together, the Pearse Valley buried snowpack and fresh snow samples plot along a regression slope of 7.2 in a δD-δ18O diagram (δD = 7.2 δ18O - 34.6; r 2 = 0.99; Fig. 7). This slope is similar to the McMurdo Dry Valley meteoric water line (δD = 7.7 δ18O - 8.7; Gooseff et al. Reference Gooseff, Lyons, McKnight, Vaughn, Fountain and Dowling2006).

Fig. 7 a. δ18O-δD diagram of buried snow and pore waters extracted in overlying sand at the ‘Gully’ and ‘Pond’ sites in Pearse Valley. b.d-δD diagram of buried snow and pore waters extracted in overlying sand at the ‘Gully’ and ‘Pond’ sites in Pearse Valley.
The δ18O profile of the buried snowpack shows a steep increase in δ18O at its contact with the overlying sand, from -43.3 to -40.3‰. The middle and lower sections show little variation. By contrast, the deuterium excess (d = δD - 8 δ18O; Dansgaard 1964) depth profile shows a steep decrease at its contact with the overlying sand (d = -4.2), with little variations deeper in the snowpack. The pore water in the overlying sand has an average δ18O value of -35.5 ± 0.3‰, slightly higher than that of the snowpack, and a very low d value (-28.0 ± 1.2‰). In a δD-δ18O diagram, the buried snowpack plots along a regression slope of 4.7 (δD = 4.7 δ18O - 135.7; r 2 = 0.92), and if we examine the slope of the top two snow samples at the contact with the overlying sand, the regression slope decreases to 2.9 (δD = 2.9 δ18O - 206.8). These regression slopes are much lower than the Global Meteoric Water Line (δD = 8 δ18O + 10, Craig Reference Craig1961) but more similar to those obtained in snowbanks and firn ice undergoing sublimation and isotope diffusion (Sommerfeld et al. Reference Sommerfeld, Judy and Friedman1991, Lacelle et al. Reference Lacelle, Davila, Pollard, Andersen, Heldmann, Marinova and McKay2011). The regression slope values indicate that sublimation of the snowpack occurred under relative humidity conditions between 10 and 55%, which is within the range of that measured at the meteorological station. Owing to the high degree of cluster of δ18O and δD values, a reliable regression slope cannot be calculated for the pore water extracted from the overlying sand. However, if we extrapolate the regression slope of the top two snow samples, the line passes through the isotope composition of the pore water (Fig. 8), suggesting that the latter are derived from a sublimating snowpack.

Fig. 8 a. δD-δ18O diagram for fresh snow plus buried snowpack and pore waters in the overlying sand in Pearse Valley. b.d-δD diagram for fresh snow plus buried snowpack and pore waters in the overlying sand in Pearse Valley.
At the ‘Pond’ site, the δ18O values of the pore water in the sand covering the snowpack averages -24.1 ± 0.5‰, much higher than those at the ‘Gully’ site, but similar to summer snow (-28.1 ± 1.1‰). In fact, the δ18O of the pore waters are c. 2–3‰ higher than that of summer snow. This suggests that the pore water is derived from melting snow and refreezing within the sand as freezing under equilibrium conditions is accompanied by a 2.8–3.1‰ enrichment between ice and water (δ18Oi-w = 1.0028, Suzuoki & Kumura Reference Suzuoki and Kumura1973; δ18Oi-w = 1.0031, O'Neil Reference O'Neil1968).
Formation and evolution of buried snowpacks
Based on the data and observations of the buried snowpacks that has been presented, we explore implications for the formation and evolution of these deposits. Specifically, we discuss the prospects for the initial formation of the deposits through the precipitation and subsequent aeolian burial, the effects of varying temperatures to induce post-burial melting and refreeze, as well as the depositional history and its effects on subsurface stratigraphy. We also explore indicators for snowpack longevity derived from both field and laboratory data as well as numerical modelling.
The initial formation of the Pearse Valley buried snowpacks occurred when surface deposits of snow were subsequently covered with windblown sediments. Winds probably serve to redistribute pre-existing material within Pearse Valley as sediments typically are found in the upwind portions of the Valley and were most probably transported there by the observed winds. The observations of the sand layers (previously described) are most consistent with a windblown origin as opposed to another geological process (e.g. debris flows, solifluction etc.) which would leave diagnostic characteristics which are not observed here. Winds blow up-valley in Pearse Valley (Fig. 6) and over the duration of these observations winds regularly exceeded 5 m s-1. These wind observations are consistent with our understanding of katabatic winds which typically show a strong directional consistency (Nylen et al. Reference Nylen, Fountain and Doran2004) and are the primary influence on the surface wind regime (Parish & Bromwich Reference Parish and Bromwich1987, Nylen et al. Reference Nylen, Fountain and Doran2004).
Previous researchers have studied aeolian activity in the McMurdo Dry Valleys to determine threshold wind velocities required for saltation of sand grains. Speirs et al. (Reference Speirs, McGowan and Neal2008) studied meteorological controls on sand transport in the Dry Valleys and found threshold entrainment velocities of 5.3 ± 0.2 m s-1. Wind speeds regularly exceed this value within Pearse Valley (Fig. 6) and thus winds within Pearse Valley are strong enough to sculpt aeolian surface features such as the sand dunes located just west of the field sites. These prevailing winds can mobilize sand which forms the layers above, below, and sometimes within a snowpack deposit. The sediment layers within the snow are created as blowing sand is deposited over the current surface of the snow and then more snow accumulates to bury this sand layer within the snowpack deposit. In addition, the low δ18O values of the ‘Pond’ site buried snowpack further support the notion that the snow is derived from winter snowfall events and was subsequently buried by sand.
Aeolian processes covering the snow with sand probably draw from local source material and the sand source remains constant for each field site. The uppermost layer (and some lower layers) of each trench at the four field sites was composed of the same type of sand (Figs 3 & 4, Table I). The spectra of all the sand samples from the four different sites as shown in Fig. 4 show the same spectral shape, implying that the samples are composed of the same minerals. The particles in each sand sample exhibit very similar particle size distributions as well (Fig. 3). These observations suggest that the uppermost (surface) layer at each site is formed by the same depositional process and is derived from the same source material. Since this sand is the uppermost layer at each site, this sediment was deposited most recently in each case. This area of Pearse Valley contains significant quantities of unconsolidated sand-sized sediment. The sands are primarily local sediment with material derived from the local bedrock and originating from stream systems draining meltwater from retreating glaciers, therefore ample supply material exists to cover the buried snowpacks.
The formation of the buried snowpacks is not dependent on the base materials or substrate where the snow initially accumulates. The base of the trenches at the four field sites varied from dry sand to ice-cemented ground to ice. No strong preference was observed for snow deposition and/or accumulation over one substrate versus another. This observation suggests that the substrate condition at the time of snow deposition is not the critical parameter to enable accumulation and preservation of snow and sand. Instead, the location of snow deposition is probably more closely tied to atmospheric conditions (precipitation events and winds to blow sand and snow). Surface topography is probably also an important parameter as blowing and/or drifting snow will more readily accumulate in topographic irregularities. Indeed, the thickest buried snowpack was observed within the topographic depression of the gully channel. Since snowfall alone is inadequate to account for the observed thicknesses of the snowpacks in Pearse Valley, drifting probably plays a significant role in the formation of the buried snowpacks by accumulating snow preferentially in certain locations such as topographic depressions.
The formation of the buried snowpacks is also not exclusively dependent upon the geomorphic setting of the region. This region of Pearse Valley is dominated by the gully systems which stretch from the upper reaches of the valley cliffs down to the depositional area near the snow covered pond. Buried snow is found both within and outside of the gully systems. The presence of gullies near the field sites is probably not a major driver for buried snowpack formation. The buried snow and depositional histories revealed by the four trenches described here are not intrinsically related to gully formation or evolution, but instead the buried snow is created by independent processes. However, as previously noted, the topography created by gully erosion can help to trap blowing snow and thereby increase snow layer thickness.
Both surface and subsurface snow are subject to temperature fluctuations which can change the phase of the snow and alter the properties of the subsurface layers. For example, temperatures above 0°C can generate a meltwater component that interacts with the various sand layers. At each field site, the uppermost layer of sand was moist on the day of initial observation. In general, this uppermost sand layer contained more water than lower layers (Table I). The moisture in these layers probably originated from surface snowmelt which percolated into this top layer of sand. Therefore there is a meltwater component of this system which primarily affects the uppermost sand layers as surface snow melts on the warmest summer days. It is also possible that sublimation of the underlying snow coupled with the higher temperatures in the upper sand layers can contribute to the moisture content of the sand.
Another example of temperature fluctuations inducing changes in the buried snowpack occurred at the ‘Pond’ field site. Here the uppermost layer of sand had a layer of ice-cemented soil within it only in areas where snow was still on the surface. The formation of this ice-cemented soil layer was probably due to melting of the surface snow which percolated downward and then froze in place to form this icy sand layer. The observations of the icy layer within the sand layer were collected when daytime ground temperatures rose above 0°C which would enable melting. Naturally colder temperatures at night and overcast conditions during the day resulted in temperatures below 0°C. Such sub-freezing temperatures would enable the refreezing of the icy layer. The presence of an overlying layer of insulating snow can also help preserve the ice-cemented layers within the snowpack. The measured δ18O values of the pore water in this sand are c. 2–3‰ higher than that of summer snow overlying the snowpack which is consistent with water derived from melting snow and refreezing within the sand. This observed process of melt and refreeze demonstrates that the subsurface sequence of snow, sand, meltwater, and ice is a dynamic system which can change on a daily timescale. The subsurface layering regime is also highly dependent upon atmospheric and surface conditions which can drive processes occurring at depth.
Also at the ‘Pond’ site, temperature gradients served to mobilize water and cause downward migration of water molecules. The trench at the ‘Pond’ field site showed an ice-cemented sand layer just below the snow layer (Fig. 2). The water required to form this ice-cemented layer probably originated within the snow layer. Vapour diffusion and/or gravity-driven meltwater percolation can cause the mobilization of the water molecules to migrate downward from the snow layer into the sand layer. The water molecules now within the fine-grained sediment layer can refreeze to form the ice-cemented layer just beneath the snowpack. Alternatively, this icy fine-grained layer could have been deposited as a mix of sand and snow.
Additional evidence demonstrating the dynamic nature of these deposits exists with observations of the snow itself. For example, the thickness of the snow layer can vary, such as where the snow layer pinched out away from its thickest section at the corner of the trench at the ‘Ridge’ site. This may suggest that the pinched out snow had already been melting and/or sublimating away and was already gone by the time of our observation. It is also possible that the pinched out snow layers are a geomorphic manifestation of the emplacement of snow through drifting. At the ‘Gully’ and ‘Upper Rocks’ sites, the snow layer was composed of larger snow crystals ranging from c. 0.5–1.0 mm in diameter, suggesting there had been melt and refreeze within the layer and indicative of many temperature variations within the snowpack. Also, at each site the upper sand layer showed significant instances of sand particles interspersed within the snow deposit at the sand-snow boundary, indicating that the sand had melted into the underlying snow layer.
Multiple observations attest to the heterogeneity observed within and among each field site, even for these relatively simple stratigraphic sequences. The total amount of snow deposition and accumulation varied both among and within the different field sites. Regarding the snow layers, each site showed varying thicknesses and layering of buried snow (Fig. 2), and direct observation also indicated the potential for variability in the snow thickness even within one field site. For example, at the ‘Pond’ site the buried snow thickness varied between 2 cm to a few millimetres within the trench. Variations of snow thickness can thus occur on metre length horizontal scales at one site.
Each field site also experienced a slightly different depositional history for the sand as well. Only the ‘Pond’ field site exhibited the finer grained sand layer (Fig. 2), indicating that the ‘Pond’ site experienced a different depositional history. The change in deposition from coarse to fine-grained particles could be the result of a continuous deposition event where coarse material was deposited first (lower layer), followed by deposition of the more fine-grained material (upper layer). The presence of the fine-grained layer could indicate either a change in wind direction, speed, and/or source region which would alter the size of particles transported and deposited.
Based on our observations at these four field sites, the buried snow layers can show significant sediment layering within the snow (e.g. ‘Gully’, ‘Upper Rocks’ sites) or little to no sediment layering (‘Pond’, ‘Ridge’ sites). This observation demonstrates that the depositional regimes varied as the snow layer developed. The sediment layers found in the ‘Gully’ and ‘Upper Rocks’ buried snowpacks probably formed as the sand accumulated on top of the freshly deposited snow. More snow then accumulated on top of this sequence, and the process continued to build up additional sand layers within the snowpack. The general region probably remained relatively snow-free to allow the sand to become mobilized. The snow preferentially accumulated in depressions, and the snow is therefore not present everywhere within the valley. The buried snowpacks that do not exhibit significant sand layers may have formed as one snow depositional event which would preclude the possibility of forming significant sand layers within the snowpack. Alternatively, the snow may have been deposited in a series of discrete events, but the time during snow depositions may have been quiescent and without sand being blown onto the top of the snowbank. All of the buried snowpacks, however, did have small amounts of sand grains intermixed within the snowbank, demonstrating a small degree of local sand being incorporated into the snowpack deposit itself.
The subsurface layering stratigraphy also demonstrated substantial heterogeneity, both laterally and vertically. Within one field site (over distances of several metres) the general sequence of layers typically remained relatively constant although the thickness of the individual layers can vary (Fig. 2). The trenches at each of the four field sites showed distinct stratigraphies in these four distinct settings, even though the sites are relatively closely located within Pearse Valley.
For each of the field sites, the thickness of the buried snow deposits was much greater than the thickness of any surface snow deposits. Surface snow was limited to shallow patchy deposits if present at all during the days of observation in November 2009. The overlying sediment layers covering the buried snow deposits served to protect these snow deposits from subsequent removal by wind, sublimation, and/or melting. At low elevations, surface snow in the Dry Valleys is not stable for long periods of time and is subject to sublimation and melting, typical ablation loss rates in the Dry Valleys range from 10–35 cm yr-1 (Hendersen et al. Reference Hendersen, Prebble, Hoare, Popplewell, House and Wilson1965, Clow et al. Reference Clow, McKay, Simmons and Wharton1988, Gooseff et al. Reference Gooseff, Lyons, McKnight, Vaughn, Fountain and Dowling2006). Covering the snow with the upper sand layer insulates the deposits and allows the snow to remain stable against melting and sublimation for a longer period of time than would be expected for an unprotected snowpack deposit. Therefore the presence of the overlying sediment layers can serve to preserve the buried snowpack deposits within Pearse Valley longer than they would exist if exposed on the surface.
There are several possible scenarios under which the snow may initially be deposited in Pearse Valley. The snow itself may fall during a) an isolated snow event in Pearse Valley, or b) annual (seasonal) snow deposits and drift accumulation, depositing at least as much snow as visible within the snow layer (within one season). In scenario ‘a’ if the buried snowpacks represent deposits from an unusual snow event, then the snowpacks would have to be preserved for several years (depending on the year of deposition) in order to be observable today. The Dry Valleys are known to have unique weather events with isolated weather systems, storms, high winds etc. so such an event could be plausible (Doran et al. Reference Doran, McKay, Clow, Dana, Fountain, Nylen and Lyons2002).
Scenario ‘b’ posits that if the buried snowpacks are formed annually, then they need not be preserved for multiple years to explain our observations. Instead, the snow may be deposited seasonally and our observations are of the snowpacks deposited the previous winter. Precipitation levels are relatively low in Pearse Valley (which is true throughout the Dry Valleys) and the thicker buried snow layers may result from snow drifting and/or accumulation of blowing snow. The snowpack thicknesses in certain areas may thus be higher than suggested by the lower levels of precipitation (snow) over the region.
Once the snow is deposited and buried by windblown sand, its behaviour changes significantly if suddenly exposed to the ambient atmosphere by removal of the protective lag deposit. Throughout this work the lag refers to the accumulation of sediment that overlies the buried snow and/or ice deposit(s). For example, revisiting the ‘Ridge’ field site one day after initial measurements were collected showed that the exposed subsurface snow layer had disappeared. Instead of the distinct layering shown in Fig. 2 of coarse moist soil, snow, and then coarse dry soil underneath the snow layer, the following day the snow layer had disappeared and the dry sand layer had become moist. We suggest that the snow layer melted and the meltwater percolated downward to create the newly moist sand layer at depth which did not exist the previous day. The snow only disappeared at this one field site (the other three field sites retained their buried snowpack deposits) which had the thickest layer of surface sand.
Numerical model of buried snowpack stability
To quantitatively test our hypothesis that buried snowpack deposits can survive longer than unburied snowpacks, we use a numerical model to simulate the behaviour of these deposits. Williams et al. (Reference Williams, Toon, Heldmann, McKay and Mellon2008) recently modelled buried snow and ice deposits on Mars by developing a numerical model that solves heat, radiation, and mass transfer equations. We use this model here for the Antarctic case. In modifying the model for Earth use, the model was changed in several ways. The primary difference is that the Earth model is driven by data averaged from two LTER (Long-Term Ecological Research) stations in Antarctica: the Lake Bonney (64 m a.s.l.) and the Beacon Valley (1176 m a.s.l.) meteorological stations. The spatial averaging of the two stations was done since the Pearse Valley site (500 m a.s.l.) is between lakes Bonney and Beacon in altitude. The dataset used to drive the Earth model includes the air temperature, relative humidity, shortwave (solar) radiation and wind speed (Doran et al. Reference Doran, Dana, Hastings and Wharton1995, http://metacat.lternet.edu:8080/knb/metacat/knb-lter-mcm.7002.7/mcm, http://metacat.lternet.edu:8080/knb/metacat/knb-lter-mcm.7003.5/mcm, accessed January 2010). The LTER data is measured in 15 minute intervals, and drives the model in 15 minute intervals as well. LTER data is used to drive the model since our Pearse Valley meteorological station was deployed in November 2009 and thus data do not exist for the prior months of interest when the snowpacks were forming and evolving.
Another key difference between the Earth and Mars version of the model is that the Earth model computes the turbulent fluxes of both latent and sensible heat in a more detailed manner than the Mars model. In the Earth model, we use the scheme as detailed in Cline (Reference Cline1997) for the sensible and latent heat fluxes. The primary advantage with this approach (which is commonly used elsewhere in Earth research) is that the stability functions are permitted to vary depending on stability conditions in the atmospheric boundary layer. The Mars model, on the other hand, assumes a neutral stability function for computation of the turbulent fluxes.
Figure 9 summarizes the results of the snowpack model as applied to Pearse Valley, Antarctica. A range of snowpack thicknesses (4 cm, 10 cm, and 22 cm) were considered which are representative of the variations in snow thickness observed at the four Pearse Valley buried snowpack sites. The initial dust content of the snow was modelled as 10 ppmw which is used in Williams et al. (Reference Williams, Toon, Heldmann and Mellon2009, Reference Williams, Toon, Heldmann, McKay and Mellon2008) for cleaner snow (recent snowfall). The snow density was set at 550 kg m-3 which corresponds to coarse granular firn. The density value and the snowpack/lag thicknesses were estimated from observations of the Antarctic snowpack. Thermal conductivity values for the lag deposit were estimated from the work of Presley & Christensen (Reference Presley and Christensen1997) and Abu-Hamdeh & Reeder (Reference Abu-Hamdeh and Reeder2000). A thermal conductivity of 0.6 W/m-K (dry soil) and 2.5 W/m-K (ice-cemented soil) and bulk density of 1630 kg m-3 (McKay et al. Reference McKay, Mellon and Friedmann1998) were used for the model runs depicted in Fig. 9.
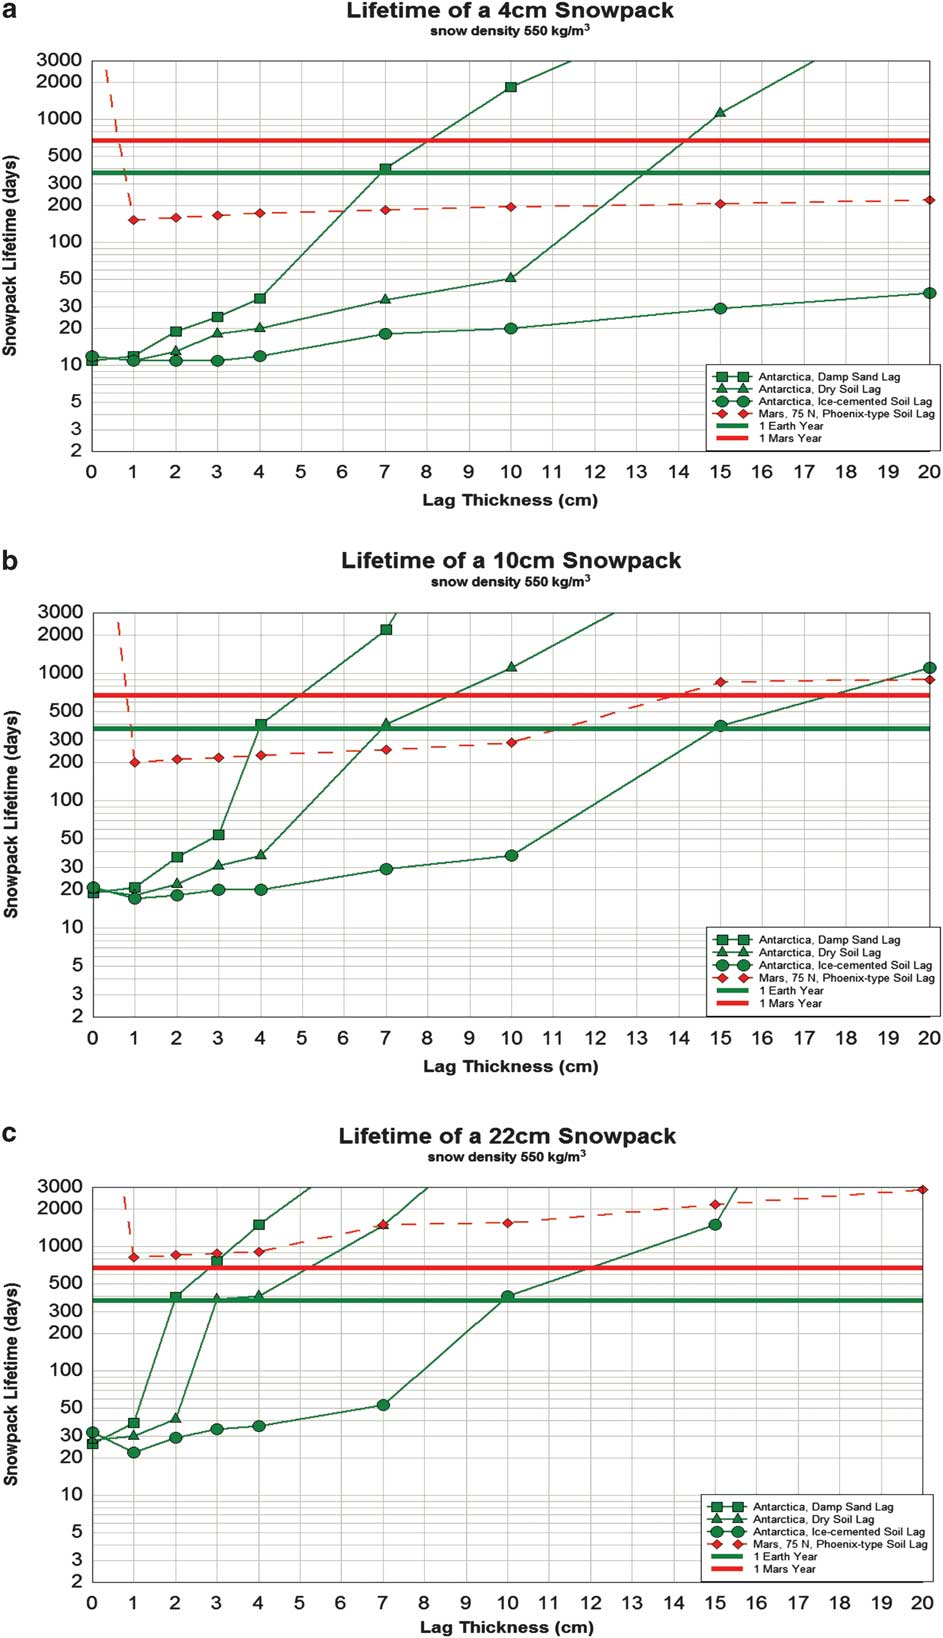
Fig. 9 Model results for buried snowpacks on Earth and Mars showing the lifetimes of buried snowpacks as a function of lag thickness. Initial snowpack thicknesses of a. 4 cm, b. 10 cm, and c. 22 cm are shown. The model runs for Earth were driven by data which started on 25 November 2005 at 00:00 hrs, corresponding to a late spring snow. For Mars the model run began at areocentric longitude Ls = 0°, corresponding to the vernal equinox. Note that the vertical axis is logarithmic and thus although the lifetimes may appear to plateau with increasing lag thickness, the lifetime values are actually still increasing.
In the model runs, the lag thickness was varied between 0 cm (bare snow) to 20 cm. This range of lag deposits is most relevant for the Earth and Mars cases and so thicker lags are not modelled here. The lag was assumed to be completely permeable to water vapour in both the Mars and Earth cases. No vapour refreezing was permitted in the lag pores. Liquid water percolation and refreezing was permitted in the snowpack and soil substrate as outlined in Williams et al. (Reference Williams, Toon, Heldmann and Mellon2009, Reference Williams, Toon, Heldmann, McKay and Mellon2008). The lag albedo was set at 0.23 for Earth. A summary of model parameters is listed in Table II.
Table II List of constants used for modelling the Earth and Mars buried snowpacks.
Figure 9 shows the snowpack lifetime as a function of lag thickness for initial snowpack thicknesses of 4 cm (Fig. 9a), 10 cm (Fig. 9b), and 22 cm (Fig. 9c). The dry soil lag case is considered the nominal case as most of the overlying sediments in the Antarctic dry valleys are desiccated due to the polar desert environment during most months when temperatures are below 0°C. Note that the moist sand observed in November 2009 (Fig. 2) probably resulted from the warm summertime temperatures and melt and vapour phases of the underlying snow. We expect the soils are drier throughout most of the year in the polar desert environment of Antarctica. The damp sand lag and ice-cemented soil lag scenarios are presented as end member cases. Also, the modelled lifetimes are not represented in Fig. 9 as smooth curves because the snow only melts in the warmer spring and summer months and thus is not disappearing at a constant rate throughout the year. We also note that the origin of the observed snow cannot be determined from the modelling alone. For example, the snowpacks observed in Pearse Valley in November 2009 could be fresh snowfall or could be a remnant snowpack from the previous season(s). The numerical model only considers the snow that was present and buried irrespective of its original source and time of deposition.
A completely bare snowpack has a high albedo and the snow lasts slightly longer than dirty snow (if other snow variables such as density, thermal conductivity etc. remain constant). As shown in Fig. 9, the addition of a small lag deposit has a slight lifetime-shortening effect on the snowpack as very thin lags accelerate the melting of the snowpack, resulting in snowpack lifetimes much shorter than one season in duration, independent of snow thickness. As lag thickness increases beyond a thin coating, however, the lifetime of the snowpack increases as well, since the lag protects the snowpack from the atmosphere. The lag protects the snowpack in two important ways. First, the primary control on snowpack lifetime is penetration of sunlight at depth. The existence of a lag reduces (or eliminates entirely) sunlight penetration of the snow column which effectively decreases the amount of energy available for snowpack removal via melt and/or sublimation. Second, the lag also thermally insulates the snow from the (sometimes) warm air temperature, which also serves to prolong the snowpack lifetime. In each case for initial snow thicknesses of 4 cm, 10 cm, and 22 cm, the addition of a thicker lag deposit results in an increased snowpack lifetime. In addition, thicker snowpacks last longer than thinner snowpacks and require a thinner lag for longer snowpack preservation.
For the case of the thin (4 cm) snowpack, a 7 cm lag of damp sand results in snowpack lifetimes of approximately one season (Fig. 9a). The 4.6 cm thick snowpack observed at the ‘Upper Rocks’ site in Pearse Valley was covered with only 1.1 cm of moist sand lag and therefore will probably disappear within one season. A dry soil lag results in an even shorter snowpack lifetime. However, the 4.0 cm thick snowpack at the ‘Ridge’ site was observed covered with 7.3 cm of moist sand lag and thus could persist for longer than one season, although a dry soil lag results in the snowpack disappearing in just over one month. The ‘Upper Rocks’ snowpack can survive for more than a year, however, under different scenarios. For example, thicker lag deposits (> 7 cm thickness) can lengthen the snowpack lifetime considerably. As indicated in Fig. 9, the snowpack lifetimes for lags of dry soil or ice-cemented soil are somewhat less than the damp sand case. The ‘Pond’ site had a snow thickness of only 2 cm with 4.4 cm of moist sand lag. Given that the 4 cm snowpack under similar conditions can only last one season (Fig. 9a), the 2 cm of ‘Pond’ site snow would disappear in less than one season as well.
Figure 9b shows the snowpack lifetimes under varying amounts of lag for a 10 cm thick snowpack which represents the intermediate case between the thickest (22 cm) and thinnest (2 cm) snowpacks observed in Pearse Valley. Considering a 7 cm thick dry soil lag case (where 7 cm is the thickest lag observed and much of the Pearse Valley sand is probably dry throughout most of the year), the 10 cm snowpack represents a hinge point in resultant snowpack lifetimes. At 10 cm initial thickness, a 7 cm lag preserves the snowpack for one year. Thinner lags result in snowpack lifetimes of less than one year whereas thicker lags results in snowpack lifetimes greater than one year.
The thickest snowpack observed in Pearse Valley was 22 cm (‘Gully’ site, Fig. 2) and model results for this case are shown in Fig. 9c. As expected, the thicker initial snowpack results in longer snowpack lifetimes and requires less lag for snowpack preservation. The ‘Gully’ site in Pearse Valley had a snow thickness of 22 cm and requires only a few centimetres of lag to preserve the deposit for longer than one year. Since this site had 6.4 cm of lag, snow should persist at this site for longer than a year.
Implication for martian deposits
The Antarctic dry valleys have long been known to be an ideal analogue for Mars due to the extremely cold and dry desert conditions of both Mars and the Antarctic (Levy et al. Reference Levy, Head and Marchant2009, McKay Reference McKay2009). Both Mars and the high elevation regions of Antarctica are hyperarid, frozen landscapes virtually devoid of running water, and thus the environmental similarities between these two places makes Antarctica one of the most useful Mars analogues on our planet. Here we explore the possibility for buried snowpacks on Mars as analogues to the buried snowpacks observed in the dry valleys of Antarctica.
Mars currently possesses the two key ingredients needed for the formation of buried snowpacks, namely precipitation events to deposit the snow and aeolian saltation of sand to bury the deposits. Regarding the presence of sand, spacecraft observations of Mars have shown the presence of numerous martian dune fields, some of which are still active (Fenton Reference Fenton2006). Sand-sized particles are thus present and mobile on the martian surface today. The largest concentration of sand dunes on Mars occurs in a broad belt that partially surrounds the north polar cap between 75 and 80°N and from 40–280°W (Greeley et al. Reference Greeley, Lancaster, Lee and Thomas1992). The sediment thickness ranges between 0.10 to 0.50 m at the edges to 6.1 m (mean thickness = 1.81 m) with a total sediment volume of 1 200 km2 (Greeley et al. Reference Greeley, Lancaster, Lee and Thomas1992). Studies of dune fields on Mars have demonstrated present-day sand saltation and dune migration (Fenton Reference Fenton2006), demonstrating that sand-sized particles are currently mobile on the martian surface even though the thin martian atmosphere results in a higher entrainment wind speed threshold compared to Earth.
Mars also has present-day precipitation events. Snowfall on Mars was observed by the Mars Phoenix Lander which operated in the northern Arctic region of Mars for five months starting 25 May 2008 (solar longitude between 76.5° and 148°) (Smith et al. Reference Smith, Tamppari and Arvidson2009). Snow cover was not observed by Phoenix as this lander operated during martian springtime, but water ice is known to condense as frost and/or ice on the martian surface at high latitudes during the winter months as observed by the Mars Viking 2 Lander (Svitek & Murray Reference Svitek and Murray1990). Mars thus possesses the two components required to produce buried snowpack deposits: 1) mobile sand, and 2) snow and ice deposits.
Although Mars is known to have deposits of snow and/or ice, the atmospheric temperature and pressure on Mars are so low that surface snow and ice deposits are subject to high rates of evaporation and sublimation (Williams et al. Reference Williams, Toon, Heldmann, McKay and Mellon2008). However, sediment overlying snow and/or ice deposits on Mars will slow the rate of sublimation and therefore increase the lifetime of the snow/ice deposit (Fig. 9). Snow deposition covered by windblown sand can thus serve to stabilize snow deposits on Mars.
Numerical modelling of buried snow on Mars suggests that snowpacks near 33° latitude can be stable if buried by a 10 cm dust lag compared with snowpacks exposed to the ambient martian atmosphere (Williams et al. Reference Williams, Toon, Heldmann, McKay and Mellon2008), though the lag in that case had a different albedo, thermal conductivity, and bulk density than the present polar case. The numerical modelling suggests that the exposed snowpack on Mars disappears in less than two seasons due to both melting and sublimation whereas a snowpack immediately buried by 10 cm of dust can be protected from these loss processes, thereby causing the buried snow deposit to remain stable (Williams et al. Reference Williams, Toon, Heldmann, McKay and Mellon2008).
We have used the Williams et al. (Reference Williams, Toon, Heldmann, McKay and Mellon2008) model to explore the behaviour of a putative buried snowpack deposit at 75°N in the north polar erg on Mars. We consider this site because the north polar erg on Mars is located at a high latitude where mobile sand may be available in a region expected to experience snowfall and ice precipitation. A 4 cm, 10 cm, and 22 cm thick snowpack was modelled with the dust content of the snow set at 10 ppmw. The initial snow density was set at 550 kg m-3, which corresponds to coarse granular firn. The lag thickness was varied between 0 cm (bare snow) and 20 cm of lag. Lag albedo was set at 0.13 for Mars (estimated for the north polar erg). The Mars value of lag thermal conductivity was estimated from Zent et al. (unpublished data).
Model results for Mars are shown in Fig. 9. At this latitude, a bare snowpack is essentially stable. The north polar residual cap of Mars has an edge which can be very close to 75°N (depending on the longitude), so such results are not surprising. For a 4 cm thick snowpack, the addition of a lag of 0–20 cm thickness is insufficient to preserve the snowpack for one Mars year (Fig. 9a), though it is probable that thicker lags would preserve the buried snow. Though not reflected in Fig. 9, if the lag albedo for the Mars case were increased to 0.2, as estimated for the Phoenix Lander location (68.22°N, 234.25°E) by Sizemore et al. (Reference Sizemore, Mellon and Golombek2009), the 4 cm snowpack is preserved for at least one Mars year with a 12 cm lag. A 10 cm thick snowpack at the Phoenix Lander location on Mars could persist for longer than one Mars year with a lag thickness of 11 cm or greater (Fig. 9b). A 22 cm snowpack could persist on Mars for longer than one Mars year irrespective of lag thickness (Fig. 9c).
We identify two plausible models for how buried snow could occur on Mars. Model 1 describes a scenario where buried snow deposits are created annually, whereas model 2 suggests that buried snow may be tied to the cycle of dust storm activity which peaks every few years. Planet wide dust storms occur on Mars typically once every three Mars years (Zurek & Martin Reference Zurek and Martin1993) whereas regional and local dust storms occur seasonally (Cantor et al. Reference Cantor, James, Caplinger and Wolff2001).
In model 1, surface ice deposits, emplaced as frost or snow, are common on Mars at high latitudes. This new snow can then become covered with dust annually due to typical movement of sand particles. In this scenario, the natural accumulation of seasonal sand and dust deposits would be adequate to preserve the snow at least through the winter season.
Model 2 considers that snow on Mars is known to be deposited seasonally within the polar regions. If the thickness of dust cover from typical dust deposition is inadequate to stabilize the snow against sublimation into the martian atmosphere, then buried snow deposits may not be able to persist throughout the course of the year. In this scenario, buried snow could therefore only last in years of global dust storms and higher than normal sand deposition. Only through an unusual dust deposition event (such as a dust storm) would enough sand accumulate to stabilize the snow deposit.
Our modelling results (Fig. 9) suggest that buried snowpacks can survive longer than one Mars year when buried under a relatively thin (12 cm) deposit of sand. Since buried snows can last longer than one Mars year, snow burial events do not have to occur every year that buried snow is observed, instead this snow could be remnant from previous year(s). Therefore even sporadic events of snow deposition and burial can result in snowpacks that remain buried for several Mars years, and special conditions which require global dust storms and/or higher than normal sand deposition rates are not required.
The concept of buried snow as observed in the Mars analogue environment of the Dry Valleys may provide a mechanism of preserving snow and ice deposits on Mars in much the same way as snow deposits are preserved via burial in Pearse Valley. There are several specific cases on Mars where the presence of buried snowpacks may help explain several unresolved observations. For example, buried snowpacks may help explain the Gamma Ray Spectrometer (GRS) observations from the Mars Odyssey spacecraft which indicate that significant amounts of hydrogen (presumably in the form of water ice) exist within the martian subsurface (Boynton et al. Reference Boynton, Feldman, Squyres, Prettyman, Brückner, Evans, Reedy, Starr, Arnold, Drake, Englert, Metzger, Mitrofanov, Trombka, d'Uston, Wänke, Gasnault, Hamara, Janes, Marcialis, Maurice, Mikheeva, Taylor, Tokar and Shinohara2002, Head et al. Reference Head, Mustard, Kreslavsky, Milliken and Marchant2003). Moreover, the water abundance observed in the high latitudes of Mars exceeds the pore space available to accommodate vapour deposited ice in the soil (Boynton et al. Reference Boynton, Feldman, Squyres, Prettyman, Brückner, Evans, Reedy, Starr, Arnold, Drake, Englert, Metzger, Mitrofanov, Trombka, d'Uston, Wänke, Gasnault, Hamara, Janes, Marcialis, Maurice, Mikheeva, Taylor, Tokar and Shinohara2002, Stoker et al. Reference Stoker, Zent, Catling, Douglas, Marshall, Archer, Clark, Kounaves, Lemmon, Quinn, Renno, Smith and Young2010). The deposition of relatively pure snow/ice which is subsequently buried would result in a higher water concentration compared with vapour-deposited pore ice and thus could be a plausible explanation for these GRS observations.
Recent studies by Feldman et al. (Reference Feldman, Bourke, Elphic, Murice, Bandfield, Prettyman, Diez and Lawrence2007) and Putzig et al. (unpublished data) also suggest buried snow and/or ice may exist within the martian north polar erg. Feldman et al. (Reference Feldman, Bourke, Elphic, Murice, Bandfield, Prettyman, Diez and Lawrence2007) showed that for the Olympia Undae region of the erg, neutron counts from the Mars Odyssey Neutron Spectrometer, thermal infrared data from the Mars Global Surveyor Thermal Emission Spectrometer, and HiRISE imagery from the Mars Reconnaissance Orbiter are best explained by a desiccated upper layer of sand which overlays a niveo-aeolian lower layer. Thus the model of snow and/or ice deposits covered by an overlying layer of sand as discussed for the Antarctic case may be applicable to the martian erg case as well.
Buried snowpacks in Pearse Valley, Antarctica may also be useful analogues for the ice recently observed by NASA's Mars Phoenix Lander. Phoenix landed in the martian Arctic at 68.22°N, 234.25°E on 25 May 2008 (Smith et al. Reference Smith, Tamppari and Arvidson2009). A main goal of Phoenix was to study the subsurface ice deposits expected to exist in these regions based on previous orbital observations and modelling efforts (Smith et al. Reference Smith, Tamppari and Arvidson2009). Phoenix used its robotic arm to dig into the subsurface and uncovered a bright layer at 3 cm depth (Mellon et al. Reference Mellon, Arvidson, Sizemore, Searls, Blaney, Cull, Hecht, Heet, Keller, Lemmon, Markiewicz, Ming, Morris, Pike and Zent2009). Surface Stereo Imager (SSI) multispectral imaging of the Dodo-Goldilocks (DG) trench revealed pure ice at the trench bottom (Stoker et al. Reference Stoker, Zent, Catling, Douglas, Marshall, Archer, Clark, Kounaves, Lemmon, Quinn, Renno, Smith and Young2010). Stoker et al. (Reference Stoker, Zent, Catling, Douglas, Marshall, Archer, Clark, Kounaves, Lemmon, Quinn, Renno, Smith and Young2010) suggested that a plausible emplacement mechanism for this ice is buried snow. Snowfall was observed on Mars by the Phoenix Lander's MET LiDAR instrument (Whiteway et al. Reference Whiteway, Komguem and Dickinson2009). Clouds on Mars currently can carry only c. 2 precipitable microns of water, so snow accumulation must either occur under different environmental conditions or windblown drifts can help to accumulate the snow in discrete locations. The DG trench was exposed to the ambient martian atmosphere and the snow/ice allowed to sublimate for 90 days, leaving behind a lag deposit. Optical microscope (OM) images of the sublimated DG trench revealed sub-rounded sand- to silt-sized particles suggestive of wind transport (Stoker et al. Reference Stoker, Zent, Catling, Douglas, Marshall, Archer, Clark, Kounaves, Lemmon, Quinn, Renno, Smith and Young2010). Active aeolian processes were thus present on Mars at the time of ice deposition to incorporate the sand- and silt-sized particles into the deposit.
This light-coloured ice observed by Phoenix may have been deposited and subsequently buried by sand and/or soil. Burial by this overlying deposit would then serve to preserve the snow/ice deposit. Thus the deposition of snow and/or ice in the polar regions of Mars followed by a wind event to deposit sediment on the snow/ice may serve as an important mechanism for preserving water ice deposits in the subsurface on present-day Mars.
Conclusions
Buried snowpacks represent an important, although relatively unstudied, aspect of the hydrological cycle within the extremely arid dry valleys of Antarctica. We have presented the first study using in situ observations, sample analyses, O-H isotope measurements and numerical modelling to further our understanding of the stability and behaviour of buried snowpacks in polar desert environments. These findings are applicable not only to Antarctica but also to the cold desert environment of Mars, with potential application to the martian north polar erg, subsurface ground ice in the northern martian plains, and Mars Phoenix mission landing site.
We find that the initial formation of buried snowpacks on Earth and Mars is consistent with ambient environmental conditions on both planets in terms of precipitation events and aeolian sand migration. Both Pearse Valley, Antarctica, and Mars experience precipitation resulting in snowfall which can subsequently accumulate on the planet's surface and become buried by sand. Measured wind velocities in Pearse Valley exceed the threshold entrainment velocity for sand-sized particles and thus sand can be mobilized through aeolian activity. An ample supply of sand exists within the valley and thus the source material is present to create the observed lag deposits. Mars likewise exhibits present-day sand saltation and thus sand-sized particles are actively being mobilized on the martian surface which can bury pre-existing snowfall deposits. The occurrence of precipitation coupled with aeolian sand mobility on both planets is conducive to the formation of buried snowpack deposits.
Numerical modelling demonstrates that burial of snowpacks by a layer of overlying sediment can prolong the lifetime of the snow deposit on both Earth and Mars. Burial by an overlying layer of sand protects the snow and/or ice from rapid sublimation in the ambient atmosphere and serves to extend the lifetime of the snow and/or ice. Specifically, thicker lag deposits result in longer snowpack lifetimes while thicker snowpack deposits last longer than thinner snowpacks and require thinner lags for preservation. Snow buried in the Antarctic dry valleys can disappear within one year with a 10 cm snow thickness and 7 cm of lag. Thinner buried snowpack deposits thus are probably formed annually whereas snowpacks with greater thicknesses of lag and/or snow can persist for longer than one year. For the Mars case, seasonal snows and subsequent burial are not required to preserve the snow and ice longer than one Mars year.
The numerical modelling results are also supported by isotope analyses of Antarctic samples and in situ observations. The O-H isotopes indicate that the buried Antarctic snow was deposited as snowfall during the winter months. The isotope data also provides evidence that the buried snowpacks are a dynamic system, which undergo processes of melt, refreeze, and sublimation. Supporting evidence for these processes affecting the buried snow is also present with the in situ observations which indicate ice layer formation within several sand layers resulting from melt and subsequent refreeze, sublimation of exposed snow, and moist sand resulting from snowmelt.
Because we have observed snow layers to melt relatively early in the summer season (late November), we suggest that, at least for the thinner snowpacks, the buried snow deposits are probably newly deposited each season. Air temperatures did not rise above 0°C during the data collection period in November 2009 (Fig. 5), but ground temperatures did exceed freezing. Hence, heating of the soil can provide energy for further melting, especially as air temperatures continue to rise in Pearse Valley for the next several months after our November 2009 observations. We expect that the bulk of the remaining buried snowpack deposits will melt and disappear throughout the summer season. The cycle will probably repeat next season with fresh snowpacks accumulating in this region of Pearse Valley. Windblown material most probably accounts for the accumulation of sand overlying the snowpack deposits. The amount of sediment contained within the Pearse Valley snowpack layers was insufficient to account for the observed thicknesses of the overlying sand deposits. Instead, the overlying sand was most probably deposited by the wind after the snowpack was deposited and not via another mechanism such as a sublimation generated lag deposit. This snow will subsequently become buried with local sediment and thus will be preserved in the subsurface as buried snowpacks until summertime temperatures rise enough to melt even the buried snowpacks once again.
Buried snowpacks are therefore important and dynamic components of these cold desert environments. Since both the Antarctic dry valleys and the planet Mars are extremely arid, the preservation of snowpacks via subsequent burial extends the length of time that a water source is available in these extremely arid regions. The buried snowpack remains an evolving system throughout the year, undergoing changes due to melt, refreeze, sublimation, and subsequent deposition and burial events by both sand and snow. Continued studies on the formation and evolution of buried snowpacks in cold desert environments is critical to understanding the behaviour of these water sources in some of the driest locales on Earth and Mars.
Acknowledgements
The authors acknowledge funding and support from both NASA and NSF to enable the Antarctic fieldwork and data analysis (NASA ASTEP grant to CPM, NASA Exobiology grant to DTA, and logistical support for Antarctic fieldwork through NSF and Raytheon Polar Services). We appreciate support from the Crary Lab at McMurdo Station, Antarctica for laboratory and field equipment assistance. Special thanks to Jon Rask of Dynamac Corp at NASA Ames Research Center for use of laboratory facilities to enable the particle size measurements. We thank Janice Bishop and Adrian Brown of the SETI Institute for use of the visible to near-infrared spectrometer and the use of laboratory facilities at SETI. We also thank Joe Levy and an anonymous reviewer for their thoughtful comments which have helped improve the quality of this paper.


