Body temperature (BT) is regularly used by milk producers and veterinarians to monitor physiological and pathological processes, e.g. heat detection or diseases (Hicks et al. Reference Hicks, Hicks, Bucklin, Shearer, Bray, Soto and Carvalho2001; Bewley et al. Reference Bewley, Einstein, Grott and Schutz2008a; Liang et al. Reference Liang, Wood, McQuerry, Ray, Clark and Bewley2013). Continuous BT measurements could be very useful for health monitoring programs in dairy cows, however, it has to be kept in mind that BT is also influenced by various external and internal factors like season, breed, milk yield, parity, time of day, climatic conditions or water and feed intake and even by the measuring method (Bewley et al. Reference Bewley, Einstein, Grott and Schutz2008a; Suthar et al. Reference Suthar, Burfeind, Bonk, Voigtsberger, Keane and Heuwieser2012; Adams et al. Reference Adams, Olea-Popelka and Roman-Muniz2013; Liang et al. Reference Liang, Wood, McQuerry, Ray, Clark and Bewley2013). Several studies investigated the potential and risks of different methods and body locations for BT measurements in dairy cows (Firk et al. Reference Firk, Stamer, Junge and Krieter2002). The various locations included the udder (Firk et al. Reference Firk, Stamer, Junge and Krieter2002), rectum, vagina (Suthar et al. Reference Suthar, Burfeind, Bonk, Voigtsberger, Keane and Heuwieser2012; Lee et al. Reference Lee, Gebremedhin, Parkhurst and Hillman2014), rumen (Bewley et al. Reference Bewley, Einstein, Grott and Schutz2008a; AlZahal et al. Reference AlZahal, AlZahal, Steele, van Schaik, Kyriazakis, Duffield and McBride2011; Adams et al. Reference Adams, Olea-Popelka and Roman-Muniz2013; Liang et al. Reference Liang, Wood, McQuerry, Ray, Clark and Bewley2013), peritoneum (Lefcourt & Adams, Reference Lefcourt and Adams1996) and tympanum (Hahn et al. Reference Hahn, Eigenberg, Nienaber and Littledike1990; Bergen & Kennedy, Reference Bergen and Kennedy2000). Some of the methods are done manually, while others are based on automatic systems. Automatic BT monitoring systems can facilitate the identification of illness, heat stress, general physiological stress and oestrus (Fordham et al. Reference Fordham, Rowlinson and McCarthy1988; Bewley et al. Reference Bewley, Einstein, Grott and Schutz2008a) given that the available implants and boluses enable a continuous temperature recording. In all cases the merit of the data depends on the economic costs (e.g. labour extensive) to record them, the accuracy, and the risks of injury for the animals.
Predictions of the normal core BT of a dairy cow vary between 38·6 to 39·2 °C (Piccione & Refinetti, Reference Piccione and Refinetti2003). Other authors reported that BT ranges from 38·2 to 39·0 °C depending on the measurement methods used (Prendiville et al. Reference Prendiville, Lowe, Earley, Spahr and Kettlewell2002). Estimating the relationship between different methods, Sievers et al. (Reference Sievers, Kristensen, Laue and Wolffram2004) found, for instance, a highly significant correlation between intraruminal and rectal temperature (r = 0·92). Bewley et al. (Reference Bewley, Einstein, Grott and Schutz2008a) estimated lower correlations between reticular and rectal temperature (0·65).
The measurement of rectal temperature is relatively easy and for economic reasons is still the most commony used (Hicks et al. Reference Hicks, Hicks, Bucklin, Shearer, Bray, Soto and Carvalho2001), but the use of rumen/reticulum boluses to monitor BT is a time- and labour-saving alternative and is, therefore, of increasing importance (Adams et al. Reference Adams, Olea-Popelka and Roman-Muniz2013). Only automatic measurements can record changes of temperature within a short period of time which can be used as an indicator of animal health (Dye Reference Dye2007; AlZahal et al. Reference AlZahal, Kebreab, France, Froetschel and McBride2008), animal activity (Gebremedhin et al. Reference Gebremedhin, Lee, Hillman and Brown-Brandl2011), changes in animal physiology such as ovulation (Culmer, Reference Culmer2012) and various types of animal-environment interactions (Hillman et al. Reference Hillman, Lee and Willard2005). However, if such methods are used e.g. for diagnostic reasons, correlations to temperatures measured with other methods and the repeatability of the values has to be known. Equations to adjust reticular temperatures to rectal- and vaginal-based scales may increase the utility of such cattle temperature monitoring systems. To the authors’ knowledge direct comparisons between reticular, rectal and vaginal temperatures that consider different climatic conditions and diurnal variations are not yet available. Therefore, the objective of this study was to compare these methods of BT measuring in dairy cows during a warm and cold period. Based on this the potential, the use and limitations of reticular measurements were estimated.
Material and methods
Study farm and animals
The study was conducted on an experimental dairy farm in the northern part of Lower Saxony, Germany, with an average yearly rainfall of 650 mm. The animals were housed in an outdoor loose-housing barn with cubicles. One side of the barn was equipped with curtains, the other one with space boards. Additionally, two manually controlled axial fans were installed above the feed alley.
The herd consisted of 75 lactating Holstein-Friesian dairy cows with an average production of 11 000 kg milk per lactation period with 3·76% fat and 3·30% protein. From the herd 12 cows, which were in first to fourth lactation, with similar lactation stage at the start of the study (65 ± 19 d in milk (DIM)) were selected. Their average milk yield was 36·4 ± 10·4 kg milk during both study periods. Milking was performed with an automatic milking system with an average number of 2·7 visits per day. Cows were fed a total-mixed ration ad libitum.
Data collection
Data were collected between the 18th and 22nd of June and 8th and 12th of October 2013. Only procedures approved for standard use under normal farm management conditions were used. Reticular temperatures (RET) were recorded using a pH and temperature sensor (smaXtec Animal Care GmBH, Graz, Austria). The bolus weight is 208 g. It has a dimension of 132 × 35 mm and contains a microprocessor, a memory space, an internal antenna and battery. The average operation time of the bolus battery is 300 d. The bolus cannot be removed (smaXtec animal care sales GmbH, Graz, Austria). The boluses were orally given in March 2013. Regarding earlier experiences it can be assumed that the bolus resided in the cow's reticulum (Bewley et al. Reference Bewley, Einstein, Grott and Schutz2008a). RET was recorded every 10 min with an accuracy ± 0·25 °C. Data were transferred once a month using the smaXtec mobile reader into an Excel file. Rectal (RT) and vaginal temperatures (VT) were measured manually by one single person using a standard digital thermometer. Measurements were done at 7.30 a.m., 12.00 p.m. and 17.30 p.m. while animals were restrained.
Barn climatic conditions, namely temperature in °C (T) and relative humidity in % (RH), were recorded at 15 min intervals using 9 Tinytag Data Loggers (Tinytag Plus 2 TGP-4500; Gemini Data Loggers Ltd, West Sussex, UK) with an accuracy of 0·01 °C and 3%, respectively. Data Loggers were placed over the feed alley, resting and waiting areas at heights of 1·2 and 3 m. For one cow data were missing for June and for two cows for the October period.
Statistical analysis
Barn T and RH were averaged over the nine loggers. RH values lower than 25% and higher than 98% were deleted as measurement errors. Based on these averages, the temperature-humidity-index (THI) was calculated using the following formula (NRC, 1971):
Different reference periods for RET were used for comparison with RT, VT and barn T and THI. Those were either the single reticular temperature (RET-SIN) value, which was recorded closest to the RT and VT measurement as well as the mean (RET-MEAN) and median (RET-MED) values for the 2 h preceding the respective RT and VT measurement.
Statistical analysis was conducted using the statistical software package SAS version 9.3 (SAS Institute Inc., Cary N.C., USA). Arithmetic means, standard deviation, minimum and maximum values were estimated using Proc Means. Pearson correlation coefficients (Proc Corr) were calculated for paired comparisons of RT, VT, RET-SIN, RET-MEAN, RET-MED and barn T averaged and separated for both study periods and times of day.
Proc Mixed was used to analyse the effects of month and time of day on RT, VT and RET values with the following statistical model:
where y ijklmn is the nth measurement of RT, VT, RET-SIN, RET-MEAN or RET-MED for method i in month j at time of the day k at day l in month j of cow m, μ is the intercept; Methi, Moj, Tik and D l (Mo)j, (Meth × Mo)ij are the fixed effects for method i (i = RT, VT, RET-SIN, RET-MEAN, RET-MED), month j (June, October), time of day k (1 = 7.30 a.m., 12.00 p.m., 17.30 p.m.), day l in month j (l = 1–5), interaction between method i and month j, and cowm is the repeated effect of cow m (m = 1–12) and e ijklmn is residual error.
Results and discussion
Descriptive statistics
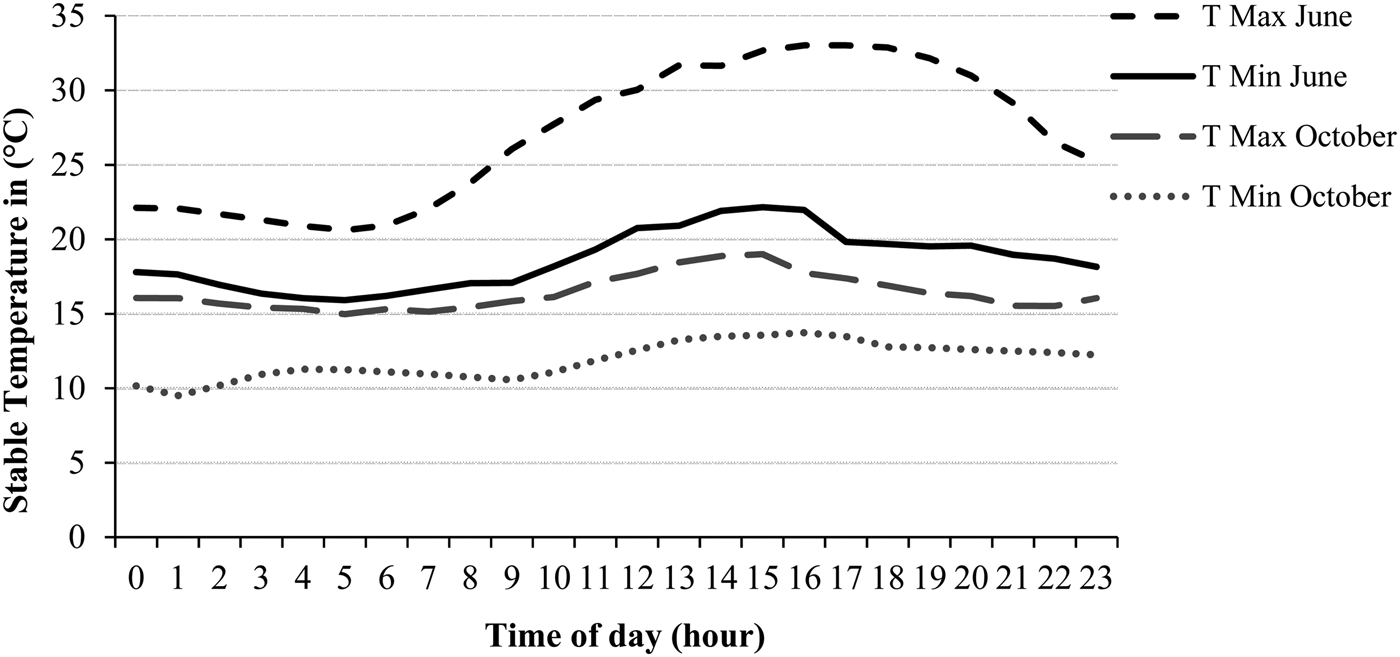
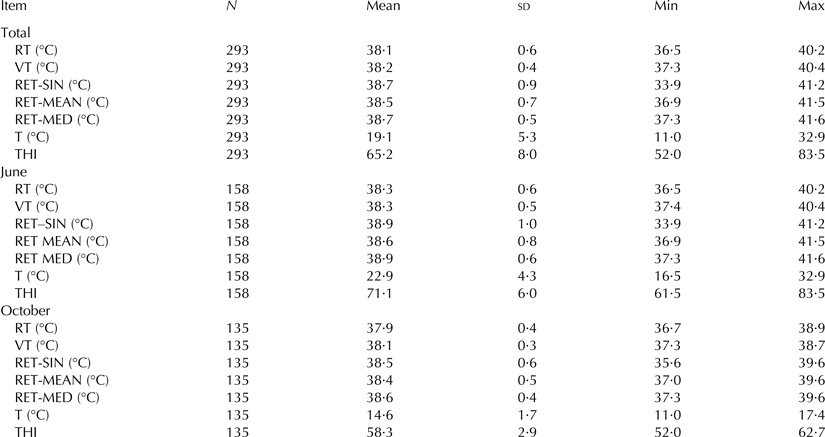
The average barn T and THI were 23·0 ± 4·3 °C and 71·1 ± 6·0 in June and 14·6 ± 1 °C and 58·3 ± 2·9 in October. T ranged between 11·0 and 32·9 °C, THI between 52·0 and 83·5 (Table 1). The ambient conditions did vary in the range, which is normal for a region in middle Europe. Figure 1 shows the course of the hourly minimum (T Min) and maximum (T Max) barn temperatures during the 5-d study periods in June and October.

Fig. 1. Course of the hourly minimum (T Min) and maximum (T Max) barn T during the 5-d study periods in June and October.
Table 1. Descriptive statistics of rectal (RT), vaginal (VT) and reticular (RET, single value (RET-SIN), 2-h-mean value (RET-MEAN), 2-h-median value (RET-MED)) temperatures and barn temperature (T) and THI averaged and separated for the two study periods in June and October

Overall means (±sd) of body temperatures for RT, VT, RET-SIN, RET-MEAN and RET-MED were 38·1 ± 0·6, 38·2 ± 0·4, 38·7 ± 0·9, 38·5 ± 0·7 and 38·7 ± 0·5 °C, respectively (Table 1). The values are in the range of earlier studies for RT (38·8 °C) (Bewley et al. Reference Bewley, Einstein, Grott and Schutz2008a), RET (38·3–38·9 °C) (AlZahal et al. Reference AlZahal, AlZahal, Steele, van Schaik, Kyriazakis, Duffield and McBride2011) and VT (38·4–38·8 °C) (Lee et al. Reference Lee, Gebremedhin, Parkhurst and Hillman2014). Lowest temperature values with a minimum of 33·9 °C occurred for a RET-SIN measurement, while the highest temperature was recorded for a RET-MED value over a 2 h period (41·6 °C). The low RET-SIN values were probably caused by the intake of water and/or food around the time of measurement. Several authors showed that water consumption reduces ruminal temperature for a period of time proportional to the water temperature and amount of water ingested. It takes between 20 min and 2 h for ruminal temperature to recover (e.g. Yamada et al. Reference Yamada, Sutoh and Imura2001). This limits the use of single RET measurements, while on the other hand continuous records lead to stable values.
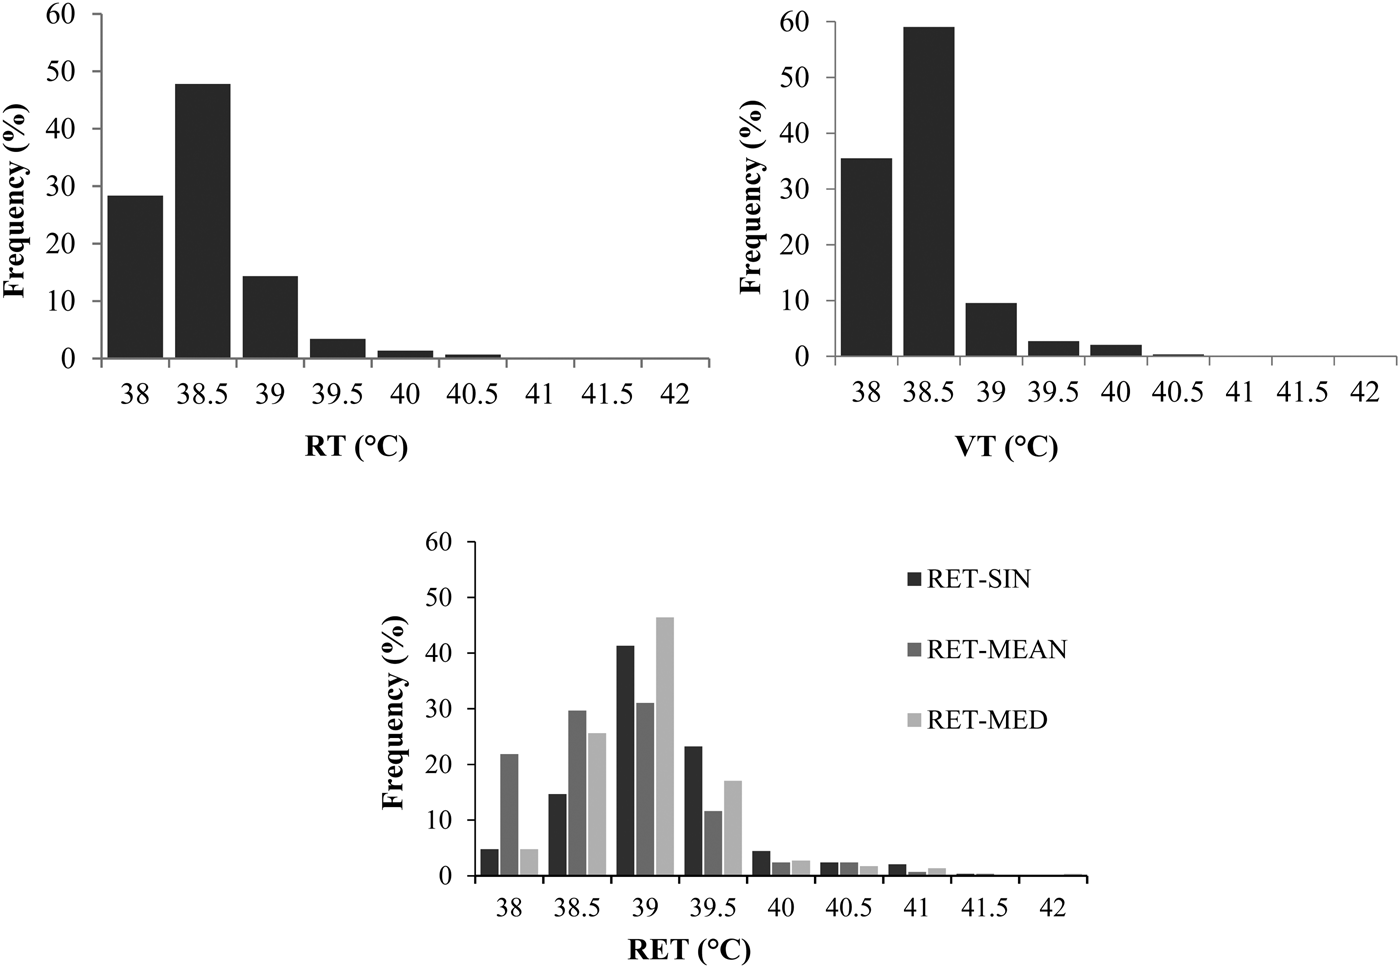
Compared to October, values were 0·2 to 0·3 °C higher in June (Table 1), which has to be kept in mind when BT is interpreted in relation to the physiological status of an animal. Again, this favors a high frequency of measurements. An increase with increasing ambient values was shown (e.g. Suthar et al. Reference Suthar, Burfeind, Bonk, Voigtsberger, Keane and Heuwieser2012). The frequencies of the recorded body temperatures are shown in histograms (Fig. 2).

Fig. 2. Histograms (%) of rectal (RT) (left above), vaginal (VT) (right above), reticular (RET) (left below) reticular single value (RET-SIN), reticular 2-h-mean value (RET-MEAN), reticular 2-h-median value (RET-MED) (right below) temperatures recorded during the trial.
Lowest variation was observed for VT and RET-MED. As previously presented by Bewley et al. (Reference Bewley, Einstein, Grott and Schutz2008a) the most frequently observed temperatures ranged between 38 and 40 °C with a low variation between the measurements. However, it has to be kept in mind that these authors excluded low temperatures caused by water intake from their statistical analysis. Low values, occurred for RET-SIN values in the present study, may be explained by water intake around times of bolus measurements (Bewley et al. Reference Bewley, Grott, Einstein and Schutz2008b). Though independent of water ingestions, RT and VT values were similarly distributed as RET records, but on a lower level. The highest number of records was found around 39 °C, followed by 38 and 40 °C. Bewley et al. (Reference Bewley, Einstein, Grott and Schutz2008a) also found the highest number of records for RT at 39·0 °C. Beside the water intake, the metabolic heat production influences the RET values, which leads to increasing temperatures when compared to VT and RT (Bewley et al. Reference Bewley, Einstein, Grott and Schutz2008a).
Correlations between measuring methods
The overall Pearson correlation coefficient between RT and VT estimated for 293 paired observations was 0·75 (P < 0·001). The correlation values between VT and RET-SIN, RET-MEAN and RET-MED were slightly stronger when compared with RT (P < 0·001) (Table 2).
Table 2. Correlation coefficients for rectal (RT), vaginal (VT) and reticular (RET, single value (RET-SIN), 2-h-mean value (RET-MEAN), 2-h-median value (RET-MED)) temperatures separated for the two study periods in June and October, differentiated by the time of day

*** = P < 0·001, ** = P < 0·01, * = P < 0·05
However, values were much lower when compared with Sievers et al. (Reference Sievers, Kristensen, Laue and Wolffram2004). They showed highly significant correlations between intraruminal and rectal temperatures. The difference may be caused by the fact that their estimation was only based on 36 observations. The values of the present study are rather similar to those found by Bewley et al. (Reference Bewley, Einstein, Grott and Schutz2008a) and Burns et al. (Reference Burns, Wailes and Baker2002). They estimated correlations between RT and RET of 0·65 and 0·50, respectively. With regard to the correlations between RT, VT and RET, it is important to keep in mind that RET measurements can be influenced by water and feed intake, while RT and VT measurements are limited by human error in locating the probe, duration of measurement, presence of air and faeces in case of RT (Bewley et al. Reference Bewley, Einstein, Grott and Schutz2008a) and the handling of an animal before and during measurement procedure. For example Lee et al. (Reference Lee, Gebremedhin, Parkhurst and Hillman2014) have shown that short-finger anchors led to different VT when compared with long-finger anchors. Additionally diurnal and seasonal variation may also have an impact on BT (Piccione & Refinetti, Reference Piccione and Refinetti2003). This may also have influenced the correlation values estimated for BT measurements and month. In this study correlation values were higher in June than in October. This could be explained by the fact that, with an increase of ambient temperature, body temperature increases to a higher level with smaller differences between the RT, VT and RET values. The correlations within the study periods were highest for the evenings in June and for mornings and middays in October. In contrast to October, observations of RET-MED temperatures in June were more closely correlated to RT and VT than measurements of RET-SIN and RET-MEAN. Bewley et al. (Reference Bewley, Einstein, Grott and Schutz2008a) described stronger correlations during spring and fall than for summer and winter periods. These results may again simply indicate that the relationships between the methods are different in relation to environmental conditions. This observation corresponds also to the concept of increasing correlations with deviating BT (Bewley et al. Reference Bewley, Einstein, Grott and Schutz2008a).
Effects of month and time of day on body temperature measurements
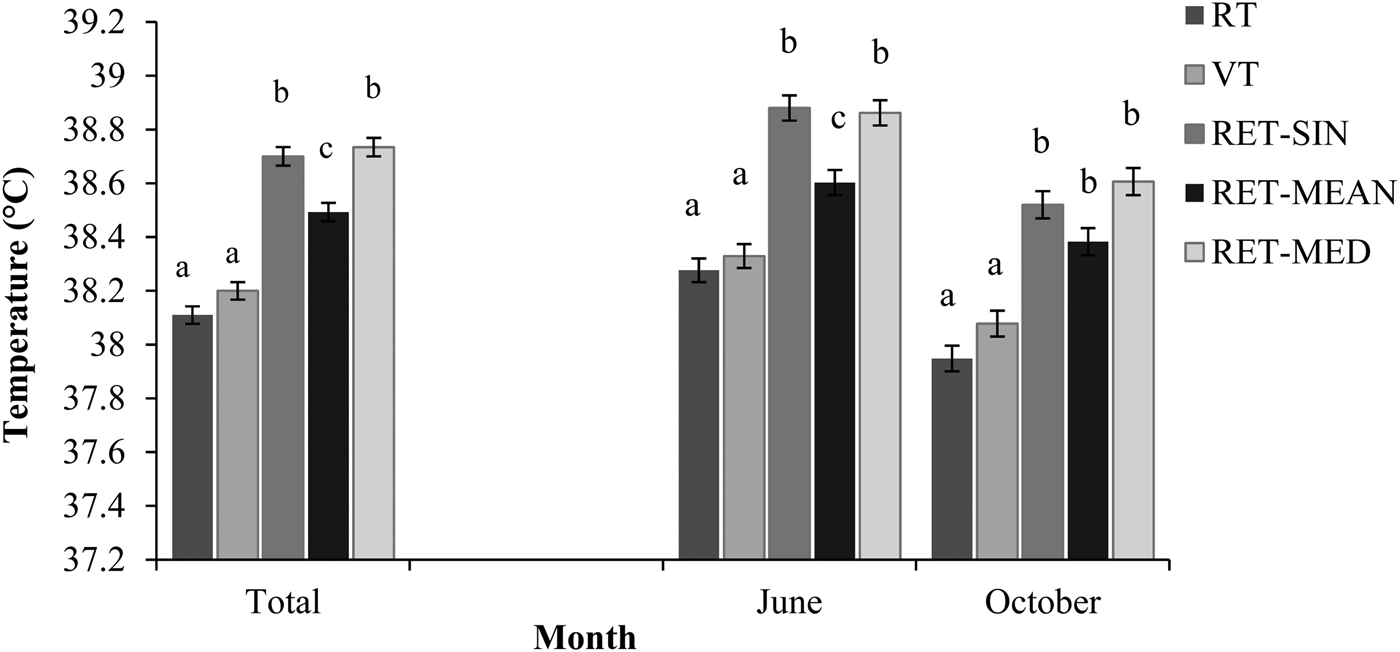
Over both study periods, RT did not differ from VT (P > 0·05; Fig. 3). Alike, RET-SIN and RET-MEAN were not significantly different (P > 0·05) from each other, while RET-MED was significantly lower (P < 0·001). When comparing the two study periods, differences between RT or VT and the three RET-temperature values were higher.

Fig. 3. Least Square Means of rectal (RT), vaginal (VT) and reticular (RET, single value (RET-SIN), 2-h-mean value (RET-MEAN), 2-h-median value (RET-MED) temperatures separated by month and time of day. Different letters show significant differences (P < 0·05) between methods within months.
The slight difference could have been caused by the necessity of restraining animals to collect RT and VT temperatures. This may have caused stress that finally leads to altered temperatures. Therefore, intraruminal measuring methods are probably more reliable because collecting temperatures cause less human intervention, which may provide a more accurate measure of temperature in dairy cattle (Hahn et al. Reference Hahn, Eigenberg, Nienaber and Littledike1990; Prendiville et al. Reference Prendiville, Lowe, Earley, Spahr and Kettlewell2002). Several previous studies (e.g. Sievers et al. Reference Sievers, Kristensen, Laue and Wolffram2004; Bewley et al. Reference Bewley, Einstein, Grott and Schutz2008a) already favoured an intraruminal measuring system towards manual methods. Meanwhile, such rumen or reticular temperatures have been established as effective measures of core BT (Hicks et al. Reference Hicks, Hicks, Bucklin, Shearer, Bray, Soto and Carvalho2001; Prendiville et al. Reference Prendiville, Lowe, Earley, Spahr and Kettlewell2002). Nevertheless, it has to be kept in mind that ruminal or reticular temperatures are generally approximately 0·5 °C greater than core BT resulting from the heat production of ruminal microorganisms (Bitman et al. Reference Bitman, Lefcourt, Wood and Stroud1984; Hicks et al. Reference Hicks, Hicks, Bucklin, Shearer, Bray, Soto and Carvalho2001; Prendiville et al. Reference Prendiville, Lowe, Earley, Spahr and Kettlewell2002). Another study even reported ruminal temperatures to be 0·71 °C (shade) and 0·49 °C (no shade) greater than intraperitoneal temperatures, although no differences were observed when ambient temperatures increased above 25 °C (McVicker et al. Reference McVicker, Leonard and Spiers2001).
Effects of barn climate and measurement time
Correlation coefficients between barn T, RT and VT were greater when compared with correlations of RET-measurements (Table 3). This may also be explained by the earlier mentioned assumption, that RET measurements can also be influenced by water and feed intake. This will lead to lower correlations with respect to environmental temperatures. Lowest correlations between T and RT values occurred in October. Over both study periods, values ranged between r = 0·08 (P > 0·05) and r = 0·24 (P < 0·001), whereas VT was strongest correlated with barn T (r = 0·48; P < 0·001). The increase of the values with the change of external factors (e.g. increasing ambient temperature) was described earlier (Bewley et al. Reference Bewley, Einstein, Grott and Schutz2008a).
Table 3. Correlation coefficients between rectal (RT), vaginal (VT) and reticular (RET, single value (RET-SIN), 2-h-mean value (RET-MEAN), 2-h-median value (RET-MED)) and barn temperature (T) separated for the two study periods in June and October

*** = P < 0·001, ** = P < 0·01, * = P < 0·05
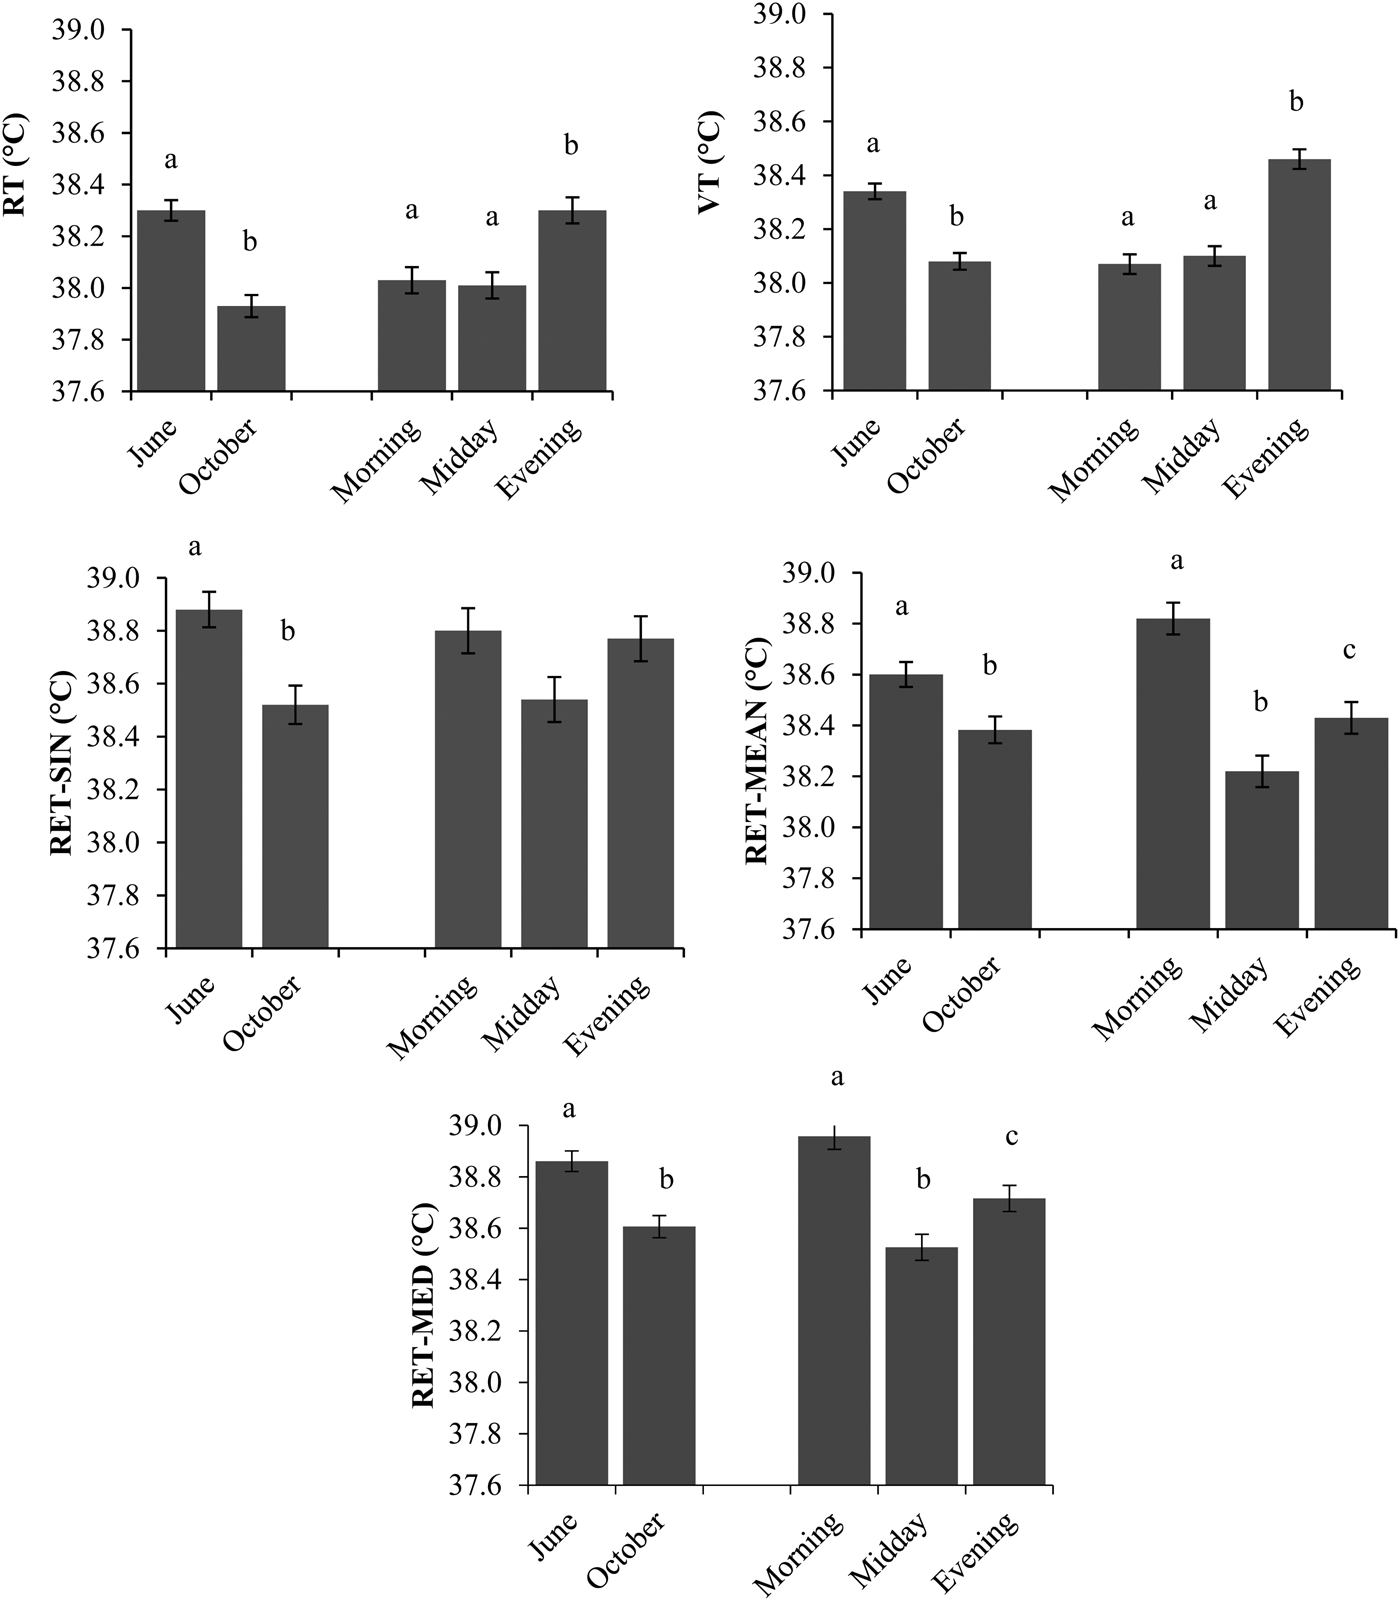
The effect of several measurement times of the day for morning, midday and evening on BT observation methods is given in Fig. 4. Highest RT and VT were observed in the evening (38·3 and 38·5 °C), when compared with morning (38·0 and 38·1 °C) or midday (38·0 and 38·1 °C) measurements (P < 0·001), respectively. In contrast, all RET-temperatures were highest in the morning (38·8–38·9 °C), followed by evening (38·4–38·8 °C) and midday (38·2–38·5 °C) (P < 0·001). In general, highest temperature values occurred for RET-MED, while lowest temperatures were recorded for RT. Diurnal changes in BT were described earlier. They are related to animals activities like water intake, feeding and milking. The changes are also related to the amounts of feed and water intake as well as milk yield (Igono et al. Reference Igono, Steevens, Shanklin and Johnson1985; Piccione & Refinetti, Reference Piccione and Refinetti2003). These factors could not be taken into consideration in this study.

Fig. 4. Least Square Means of rectal (RT), vaginal (VT) and reticular (RET, single value (RET-SIN), 2-h-mean value (RET-MEAN), 2-h-median value (RET-MED) temperatures separated by month and time of day. Different letters show significant differences (P < 0·05) between the months and time of day.
Conclusions
The intention of this study was to estimate the relationship between different methods of BT measurements in lactating cows under various climatic conditions. Mean values of RT were not significantly different, while variation differed. The RT was strongly correlated with VT, demonstrating that both provided a similar estimate of body temperature in dairy cattle. The relationship between RT, VT and RET was lower. The dynamics of the reticulorumen environment, particularly related to feed and water intake, likely influenced this relationship and might limit the suitability of RET in an automated temperature-monitoring system. Besides, data recorded with the methods studied here partly differ in their potential use. While the precision of VT and RT measurements is affected by the competency of the operator using them and other circumstances (e.g. depth and duration of probe insertion and the presence of air or faeces in the rectum (RT) (Lee et al. Reference Lee, Gebremedhin, Parkhurst and Hillman2014), the use of a rumen bolus is relatively independent from these factors. Beyond, the use of boluses is less labour intensive, time consuming and cannot result in injuries (Bewley et al. Reference Bewley, Einstein, Grott and Schutz2008a). However, the impact of water and feed intake is a major limiting factor of measurements from the reticulorumen. The frequently measured values are stable over time and allow a much better use within health monitoring programs, because diurnal variation, and particularly the impact that feed and water intake and milking will have, can be excluded. However, it is important to remember that no method can be considered to be the ideal benchmark for core BT.
It can be concluded, that all methods were subjected to more measurement error and variation than anticipated. Nevertheless, these results are encouraging for the use of newly available technologies for monitoring RET.
The authors thank the staff of the dairy herd at the Agricultural Training Center Echem of the Chamber of Agriculture Lower Saxony for their support during the study.


