


1. Introduction
At the ocean's surface, bursting bubbles produce sea spray aerosols (SSA) which transport water, particulates and organic biofilm matter into the air (Veron Reference Veron2015). The SSA are an important factor in global climate dynamics (Cochran et al. Reference Cochran, Ryder, Grassian and Prather2017) as they can serve as cloud condensation nuclei, spread across land or fall back into the ocean (de Leeuw et al. Reference de Leeuw, Andreas, Anguelova, Fairall, Lewis, O'Dowd, Schulz and Schwartz2011). Several studies at the bubble scale have shown that bubble size is a primary controller of the properties – size, velocity and number – of ejected droplets (Lhuissier & Villermaux Reference Lhuissier and Villermaux2012; Wang et al. Reference Wang2017; Brasz et al. Reference Brasz, Bartlett, Walls, Flynn, Yu and Bird2018; Deike et al. Reference Deike, Ghabache, Liger-Belair, Das, Zaleski, Popinet and Séon2018; Lai, Eggers & Deike Reference Lai, Eggers and Deike2018; Berny et al. Reference Berny, Deike, Séon and Popinet2020), which makes bubble size distributions at the ocean's surface important in characterizing spray production (Veron Reference Veron2015; Deike & Melville Reference Deike and Melville2018; Néel & Deike Reference Néel and Deike2021). As coalescence changes the surface bubble size distribution (Sadhal, Ayyaswamy & Chung Reference Sadhal, Ayyaswamy and Chung1977; Clift, Grace & Weber Reference Clift, Grace and Weber1978; Néel & Deike Reference Néel and Deike2021) and has been hypothesized to ‘reset’ the bubbles’ lifetimes on the surface by injecting liquid from the foot of the bubble into its cap (Lhuissier & Villermaux Reference Lhuissier and Villermaux2012), it is an important aspect to the life of interacting bubbles at a liquid surface.
Bubble coalescence occurs in a wide variety of contexts and can introduce collective effects. Examples include electrolysis, where bubble coalescence affects mass transfer by agitating the surrounding solution (Stover, Tobias & Denn Reference Stover, Tobias and Denn1997), and bubble column reactors, where it can slow reaction rates by reducing the available surface area (Miller Reference Miller1983). The properties of foams can be altered by bubble coalescence (Taki et al. Reference Taki, Tabata, Kihara and Ohshima2006). Varying interface chemistry, typically via surfactant (Yang & Maa Reference Yang and Maa1984), has been shown to dramatically change the rate of coalescence in foams (Samanta & Ghosh Reference Samanta and Ghosh2011) and surface coalescence (Néel & Deike Reference Néel and Deike2021). Bubble coalescence is not always guaranteed and the drainage of the liquid between neighbouring bubbles has been studied by various authors (Chesters Reference Chesters1991; Craig, Ninham & Pashley Reference Craig, Ninham and Pashley1993; Langevin Reference Langevin2015; Zhang et al. Reference Zhang, Thoraval, Thoroddsen and Taborek2015; Berry & Dagastine Reference Berry and Dagastine2017). Bubbles on the free surface typically coalesce after being naturally brought together by the ‘cheerios effect’ (Nicolson Reference Nicolson1948; Vella & Mahadevan Reference Vella and Mahadevan2005; Dalbe et al. Reference Dalbe, Cosic, Berhanu and Kudrolli2011) where a bubble's meniscus creates a force on a neighbouring bubble, which has industrial applications, such as drying paint.
These applications have motivated studies on the small-scale physics governing coalescence. Much of the initial coalescence work focused on liquid drops and describing the expansion of the neck radius,  $r$, which can be controlled by viscous, capillary and inertial effects. These define two time scales: a viscous time scale
  $\tau _{\nu ,l} = \mu _l R/\sigma$ (
 $\mu _l$ is the liquid viscosity,
  $\sigma$ the surface tension and
  $R$ the drop radius) and an inertial–capillary time scale
  $\tau _{i} = (\rho _l R^3/\sigma )^{1/2}$ where
  $\rho _l$ is the liquid drop density (Eggers, Lister & Stone Reference Eggers, Lister and Stone1999; Aarts et al. Reference Aarts, Lekkerkerker, Guo, Wegdam and Bonn2005). The ratio of these two time scales defines the Ohnesorge number,
  $Oh = \mu _{l} / \sqrt {\rho _{l} R \sigma }$. In the Stokes flow limit (with
  $Oh \gg 1$) for spherical drops, the neck growth is logarithmic for
  $r/R < 0.03$ with
  $r/R \sim -t/\tau _{\nu ,l} \ln (t/\tau _{\nu ,l})$ (Eggers et al. Reference Eggers, Lister and Stone1999). This purely viscous regime is preceded by an ‘inertially limited viscous regime’, where the capillary driving force is balanced by both inertia and viscosity:
  $r/R \sim t/\tau _{\nu ,l}$. If
  $Oh \ll 1$, further neck growth is inertial:
  $r/R \sim (t/\tau _{i})^{1/2}$ (Paulsen et al. Reference Paulsen, Burton, Nagel, Appathurai, Harris and Basaran2012), and a unified theory for this transition was identified by Xia, He & Zhang (Reference Xia, He and Zhang2019).
Bubble coalescence similarly starts with an inertially limited viscous regime defined by the parameters of the gas inside the bubbles (Paulsen et al. Reference Paulsen, Carmigniani, Kannan, Burton and Nagel2014):  $r/R \sim t/\tau _{\nu ,g}$ where
  $\tau _{\nu ,g} = \mu _g R/\sigma$, with
  $\mu _g$ being the inside gas viscosity. Note that, for millimetric air bubbles in water, this regime lasts approximately
  $10^{-11}\ \textrm {s}$. Subsequent neck growth is resisted by either the inertia or viscosity of the exterior liquid. Thoroddsen et al. (Reference Thoroddsen, Etoh, Takehara and Ootsuka2005) analysed air bubbles in ethyl alcohol (
 $Oh \ll 1$) and found that for
  $r/R<0.45$, the inertial–capillary scaling from drops accurately described the neck growth:
  $r/R \sim (t/\tau _{i})^{1/2}$. The time scale is still defined by the density of the liquid, which is the exterior fluid for bubbles. To eliminate any possible disturbances, the coalescence of diffusively grown air bubbles in water has been studied by Moreno Soto et al. (Reference Moreno Soto, Maddalena, Fraters, Van Der Meer and Lohse2018), and they suggested a more accurate scaling of the Laplace pressure driving coalescence to better capture the late-time behaviour. In the limit of
  $Oh \gg 1$,
  $r/R \sim (t/\tau _{\nu ,l})^{1/2}$, where the time scale is defined with the viscosity of the exterior liquid (Paulsen et al. Reference Paulsen, Carmigniani, Kannan, Burton and Nagel2014).
Non-spherical drop coalescence has been studied by placing drops in contact with a solid boundary. The neck expansion can be governed by the lubrication regime if the drop's height is much smaller than its width (Ristenpart et al. Reference Ristenpart, McCalla, Roy and Stone2006). When suspended drops are placed in contact with a substrate to create ‘wedges’ of varying angles, the exponent of the neck growth changed for different contact angles (Eddi, Winkels & Snoeijer Reference Eddi, Winkels and Snoeijer2013).
To the best of our knowledge, the coalescence of bubbles on the free surface has not yet been studied. The shape of surface bubbles is characterized by the Bond number, which is the ratio of buoyancy and surface tension:  $Bo = R_0^2 / l_c^2 = R_0^2 \Delta \rho g / \sigma$, where
  $R_0$ is the volume effective radius (defined as the radius of a spherical bubble with the same volume),
  $l_c = \sqrt {\sigma / \Delta \rho g}$ is the capillary length,
  $\Delta \rho$ is the density difference between the gas inside the bubble and exterior liquid and
  $g$ is the gravitational acceleration. As shown in figure 1(a), surface bubbles have a gas–liquid cavity interface and a thin-film cap. We determine the shape of surface bubbles by solving the Young–Laplace equation (Toba Reference Toba1959; Princen Reference Princen1963; Berny et al. Reference Berny, Deike, Séon and Popinet2020). For
  $Bo \ll 1$, bubbles are almost spherical and reside predominantly below the surface of the water (figure 1b), and
  $Bo=1$ bubbles are approximately half above and half below the free surface. As
  $Bo$ increases further (figure 1c), the gas is higher above the free surface and in the limit of
  $Bo \gg 1$ the cap forms a half-sphere.

Figure 1. (a) Sketch of the geometry of air bubbles coalescing at a liquid–gas interface and the quantities measured in this study. Here,  $r$ is the distance that the centre point of the underwater contour travels and
  $h$ is the vertical distance travelled upwards by the centre of the top surface. They are both measured relative to their position at the start of coalescence,
  $t = t_*$. In blue is a circle of radius
  $R_0$, which is the size of a sphere containing the same volume of air. (b,c) The shape of a single static air bubble at a water–air interface as determined by a numerical solution of the Young–Laplace equation. Bubbles with
  $Bo \ll 1$ are nearly spherical and almost completely surrounded by the liquid phase with a very small thin-film cap. For larger Bo, the bubble resides higher relative to the undisturbed free surface and the shape is less spherical. The solid black line is the interface between the air inside the bubble and the surrounding liquid. The solid red line is the thin-film cap between the air inside the bubble and exterior air at atmospheric conditions. The dashed line is the free surface between the exterior air and water.
The paper is organized as follows: § 2 describes the experimental set-up and § 3 presents an analysis of the coalescence dynamics, for both the underwater neck growth and top surface evolution. The bubble shape as a function of the Bond number is discussed and we propose scalings describing the surface evolution. Conclusions are given in § 4.
2. Experimental set-up
We create bubbles, as illustrated in figure 2(a,b), by blowing air through two identical needles passing through opposing sides of a small rectangular dish (10 cm square by 3 cm tall) of de-ionized water with 0.001 mMol of sodium dodecyl sulphate (SDS). At this concentration, the surfactant is not expected to have a large impact on the coalescence dynamics (Yang & Maa Reference Yang and Maa1984), and is approximately the lowest concentration which enables the bubbles to last on the surface long enough for coalescence to occur,  $O(1\ \textrm {s})$, as bubble lifetime in pure water can be quite short
  $O(0.01\text {--}1\ \textrm {s}$) (Zheng, Klemas & Hsu Reference Zheng, Klemas and Hsu1983; Lhuissier & Villermaux Reference Lhuissier and Villermaux2012; Poulain, Villermaux & Bourouiba Reference Poulain, Villermaux and Bourouiba2018). A syringe pump (SyringePump NE-1000) is used to steadily push air at a slow enough rate that subsequent bubbles do not interfere. We use needles (inner radii
  $0.17\text {--}5.1\ \textrm {mm}$) to produce a range of bubble sizes (
 $R_0 \approx 1 \text {--} 3.5\ \textrm {mm}$), which corresponds to
  $Oh \approx 0.004\text {--}0.002$ respectively. Experiments are performed at room temperature under atmospheric conditions.

Figure 2. (a) Two high-speed cameras record time-synced side views: one below the surface of the water and one above. (b) Example of measurements of bubble coalescence for  $Bo = 1.2$. (c) The associated time evolution of the neck
  $r(t)$ (blue) and bridge centre
  $h(t)$ (red). Time is measured relative to the start of coalescence,
  $t_*$.
To test the sensitivity of the dynamics to surfactant concentration,  $c$, in this low concentration regime, coalescence of both large and small Bond numbers at
  $c= 0.002$ mMol of SDS is also studied. We do not investigate a higher concentration of surfactant as above a transition concentration,
  $c\approx 0.006$ mMol, the presence of surfactant starts to prevent coalescence (Oolman & Blanch Reference Oolman and Blanch1986). In this sense, the results presented in this paper concern clean water with very low surfactant contamination, before any effects on coalescence efficiency are visible. The surface tension of the liquid–air interface was measured with the static pendant drop method to be
  $0.072\ \textrm {N}\ \textrm {m}^{-1}$ over the entire range of SDS concentrations (
 $c=0.001$ to
  $c=0.002$ mMol). The difference in surface tension between this measured value and that of pure distilled water is within the error bounds of the measurement. Note, these concentrations are well below the critical micelle concentration of 8.2 mMol.
Two high-speed cameras are used to capture concurrent side views: one recording a top-surface perspective (Phantom V2012: 60 000–100 000 f.p.s.) and the other recording below the surface (Phantom 4K: 6000–8000 f.p.s.) as shown in figure 2. The inclination of each camera is  $8^{\circ }$ (
 ${\pm }2^{\circ }$), and the container's sides are flat and clear for an unperturbed underwater perspective. The cameras are synced such that the views can be compared temporally and spatially (figure 2b,c). The V2012 was also used to provide higher temporal resolution of the underwater dynamics for
  $Bo\leqslant 0.76$. Only events where the bubbles coalesce perpendicular to the cameras are reported. From these videos, contours of a bubble's top and bottom, as well as the vertical position of their centres (
 $h(t)$ and
  $r(t)$ respectively, as shown in figure 2c) are extracted. These side views capture the contours in a vertical plane that goes through the two parent bubble centres. The moment coalescence is first observed defines
  $t=t_*$.
3. Surface coalescence dynamics
3.1. Small bubble coalescence ( $Bo\ll 1$)

Coalescence between two small Bond number bubbles ( $Bo=0.13$) is shown in figure 3. The neck expands axisymmetrically at early times (figure 3a–c) like bubbles coalescing in the bulk. Even after the top of the neck encounters the free surface (figure 3d), the bottom portion appears to continue unhindered – similar to the observation of Moreno Soto et al. (Reference Moreno Soto, Maddalena, Fraters, Van Der Meer and Lohse2018) that the solid surface to which the bubbles were attached had no significant impact on the expansion of the neck on the opposite side. As time continues, the shape becomes more spherical and oscillates near its natural mode frequency (Lamb Reference Lamb1932) until finally recovering a spherical shape (figure 3x). Because the bubbles reside completely underwater, the contact area (of the order of
  $250\ \mathrm {\mu } \textrm {m}$) is far from the surface (relative to the radius
  $R_0$). The free surface between the parent bubbles above the expanding neck is not well approximated by a thin liquid film. The surface quickly becomes dominated by interfering capillary waves and thus the dynamics for
  $h$ cannot be well observed or defined. As will be discussed in § 3.3, the downward growth of the underwater neck for
  $Bo\ll 1$ bubbles matches the results of underwater spherical coalescence.

Figure 3. Time series of  $Bo=0.13$ coalescence (
 $c=0.001$ mMol). Early times of coalescence are highlighted by the axisymmetric neck expansion (a–c). The free surface does not appear to alter the growth of the lower part of the neck (e–m). As time continues, the shape becomes more spherical and oscillates near its natural mode frequency (q–x).
3.2. Large bubble coalescence ($Bo > 1$)

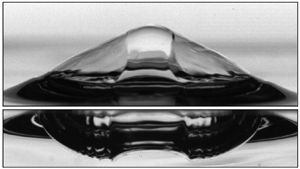
Figure 4 shows the top and bottom perspectives of coalescence for  $Bo = 2.1$ bubbles. The differences between
  $Bo > 1$ and
  $Bo \ll 1$ coalescence are clear from the start with a modified initial geometry. While
  $Bo \ll 1$ bubbles are spherical, the parent bubbles are now highly non-spherical (although still roughly ellipsoidal underwater), and the contact area is a vertical liquid film on the scale of the bubble itself. Liquid from the meniscus between the bubble caps becomes trapped in a ‘bulge’ on the upper surface film. While eventually spreading out over the film, it remains concentrated in the centre throughout the first surface expansion (figure 4a–f). The neck expansion underwater appears qualitatively similar in many regards to the smaller Bond number case; the neck is bounded by capillary waves and follows the shape of the pre-coalescence parent bubbles. The top of the bubble exhibits distinctly different behaviour by starting its motion later than the underwater neck, peaking relatively quickly and finally relaxing to a semi-spherical cap. Unlike the neck underwater, which expands within a clearly defined region, the entire top surface quickly (
 $\Delta t \ll \tau _i$) starts moving (figure 4d). Full growth of the neck underwater takes approximately 0.0125 s while the top surface reaches its peak after roughly 0.005 s.

Figure 4. Bubble coalescence for  $Bo=2.1$ (
 $c=0.001$ mMol). The free surface and the neighbouring parent bubble change the initial geometry. Underwater, the parent bubbles are still roughly ellipsoidal and the neck between them expands in a fashion similar to spherical bubbles coalescing for
  $t/\tau _{i}<1$ (a–f). The top surface shows distinctly different behaviour. While the bottom neck has started to grow in (b), the upper surface only first shows signs of movement in (c) and the entire liquid film is moving only a short time after (
 $\Delta t \ll \tau _i$). The upper surface reaches its maximum (f) very quickly – well before the bottom surface (p). Note that the liquid from the meniscus between the parent bubble caps is trapped in the liquid film of the upper surface and eventually spreads out over the newly formed bubble's cap (h–r), as shown by the light-coloured region at the centre of the newly formed cap.
3.3. Neck growth underwater: $r(t)$

The expansion of the underwater neck perpendicular to the free surface as a function of time is measured for a wide range of Bond numbers and shown in figure 5(a) (each line represents the average of 12–20 trials). The growth of the neck at  $c=0.002$ mMol of SDS is shown by the dotted lines. The neck is measured relative to its position when coalescence starts,
  $t=t_*$. Across all Bo, we observe that
  $r(t)-r(t_*) \propto (t-t_*)^{1/2}$, which is the same functional relationship as the inertial–capillary scaling,
  $r(t)/R_0 \propto (t / \tau _{i})^{1/2}$, for spherical bubbles. Rescaling using the effective bubble radius
  $R_0$ collapses the data sufficiently well for
  $Bo \lessapprox 0.5$, but fails for larger Bond numbers. This can be related to the modified geometry for
  $Bo>0.5$, which changes the capillary pressure driving coalescence.

Figure 5. Underwater neck growth (a)  $r(t)-r(t_*)$ as a function of
  $t-t_*$ for
  $Bo = 0.15$ to
  $2.38$. The solid lines are the smallest surfactant concentration,
  $c=0.001$ mMol SDS, and the dotted lines are
  $c=0.002$ mMol. The inset shows the same data rescaled by the volumetric radius,
  $R_0$, as is done for spherical bubble coalescence. The large spread of the data illustrates that it is not the correct normalization. (b) The in-plane curvature at the bubble's ‘corner’ (its widest part),
  $R_c$, is found by inspection of numerical solutions of the Young–Laplace equation for different sized bubbles, the result of which is shown by the open circles. The corner curvature increases with
  $Bo$ and can be described by
  $R_c = R_0 (1+Bo)^{-1/2}$, shown in dashed lines. The inset shows where
  $R_c$ (blue circle) is measured on the three-dimensional geometry of a
  $Bo=3$ bubble. The black region is the air–liquid interface and the red is the thin-film cap. (c) Re-scaling of the neck data with
  $R_c$ as the characteristic length scale and
  $\tau _i(R_c) = \sqrt {\rho R_c^3 / \sigma }$ as the characteristic time scale. The data collapse to a single curve,
  $[r-r(t_*)]/R_c = C [(t-t_*)/\tau _i(R_c)]^{1/2}$ (indicated in black), with
  $C=1.2$ by best fit to the data. There is no visible difference between the two concentrations of surfactant tested, showing independence of the results in this low concentration limit.
The capillary pressure in the neck driving coalescence is a function of the parent bubble's shape, in particular the curvature at its ‘corner’ (the widest part of its cavity). For  $t/\tau _i < 0.2$, the capillary pressure is defined well by the in-plane curvature alone (Paulsen et al. Reference Paulsen, Carmigniani, Kannan, Burton and Nagel2014; Moreno Soto et al. Reference Moreno Soto, Maddalena, Fraters, Van Der Meer and Lohse2018). The in-plane radius of curvature at the ‘corner’ of the parent bubble,
  $R_c$ as defined in figure 5(b), is estimated by fitting a half-parabola to solutions of the Young–Laplace equation (from the corner half-way to the bottom) which is the shape of a unique static bubble. While differences exist between the pre-coalescence parent bubbles and the analytic shapes – real parent bubbles for
  $Bo>1$ are not axisymmetric as shown in figure 4(a) – they match a proposed function:
  $R_c = R_0 (1 + Bo)^{-1/2}$, which is determined by the definition of
  $Bo = R_0^2/ l_c^2$. In the
  $Bo \ll 1$ limit,
  $R_c = R_0$ as the bubbles are spherical. In the limit of
  $Bo \gg 1$,
  $R_c=l_c$ is the shape of the meniscus at the intersection of the flat film separating the gas volumes and the liquid bath beneath them.
Employing  $R_c$ and the associated
  $\tau _i (R_c)=\sqrt {\rho _l R_c^3 / \sigma }$ as characteristic length and time scales, the inertial–capillary scaling law for spherical coalescence in the bulk is adapted to:
  $[r-r(t_*)]/R_c = C [(t-t_*)/\tau _i(R_c)]^{1/2}$, where
  $C$ is a non-dimensional constant found via best fit to be
  $C=1.2$. This scaling leads to a reasonable collapse of the data (figure 5c). While there is a noticeable spread for
  $t/\tau _i \gtrapprox 0.2$, this is consistent with the observation that estimating the geometry from only the in-plane curvature only partially describes the long-term neck growth of spherical bubbles (Moreno Soto et al. Reference Moreno Soto, Maddalena, Fraters, Van Der Meer and Lohse2018). Increasing the concentration of SDS to
  $c=0.002$ mMol has no significant effect as illustrated in figure 5, which shows the independence of the results with respect to surfactant concentration in this low concentration limit.
3.4. Underwater neck contour evolution
We have shown that the downward expansion of the neck centre can be described by the classic theory for spherical bubble coalescence modified to account for the shape of a bubble at the free surface. We now extend our description to the entire underwater neck contour, which is defined as the segment of the profile which rapidly expands while the rest of the bubble remains relatively stationary (see figure 3a–g). The expansion of the neck contour is considered while  $r\lessapprox R_0$.
The characteristic vertical length scale has been found by our description of the neck midpoint dynamics:  $\tilde {y} = R_c[(t-t_*)/\tau _i(R_c)]^{1/2}$. The horizontal extension is bounded by a capillary wave (figure 3) which can be analysed similarly to Moreno Soto et al. (Reference Moreno Soto, Maddalena, Fraters, Van Der Meer and Lohse2018). The arc length travelled,
  $s$, is observed to follow
  $s/R_c \propto (t/\tau _i)^{1/2}$, which Moreno Soto et al. (Reference Moreno Soto, Maddalena, Fraters, Van Der Meer and Lohse2018) attributed to viscous damping of the higher-order frequencies in the wave packet. As such, the horizontal position of the wave front bounding the neck contour is estimated to the first order as
  $x = R_c[1 - \cos (s/R_c)] \approx R_C[t/(2 \tau _i(R_c)) + O((t/\tau _i(R_c))^2)]$. The horizontal length scale is thus
  $\tilde {x} = R_c[(t-t_*)/\tau _i(R_c)]$. Figure 6 shows the full underwater contour evolution with dimensional measurements and rescaling by the horizontal and vertical lengths
  $x/\tilde {x}$ and
  $y/\tilde {y}$ respectively. We observe an excellent collapse of the data for both small and large Bond numbers to a universal shape.

Figure 6. Underwater neck contour evolution for  $Bo=0.25$ (a–c) and
  $Bo=2.0$ (d–f), showing the images (a,d) just prior to the start of coalescence, with the subsequent growth of the neck overlaid. In all other plots, the black dot at
  $(0,0)$ represents the origin where the neck starts at
  $t=t_*$. (b,e) The physical scale of the neck. (c,f) The same contours rescaled by the appropriate vertical (
 $\tilde {y} = R_c[(t-t_*)/\tau _{i}(R_c)]^{1/2}$) and horizontal (
 $\tilde {x} = R_c[(t-t_*)/\tau _{i}(R_c)]$) length scales. (g) A comparison of the rescaled data for all times at each Bond number (c,f), with the shaded area indicating the standard deviation about the mean. For all
  $Bo$ studied, the entire lower neck contour collapses to a single curve. Results for
  $Bo=0.25$ and
  $Bo=2.0$ are highlighted as they show collapse across roughly an order of magnitude in Bo.
3.5. Top surface bridge evolution
When surface bubble coalescence is viewed from above, the event is considerably different from the underwater perspective. The motion of the upper surface is examined by inspection of the interface in a vertical plane that goes through the parent bubble centres (the meridian profile) and its midpoint is of primary focus. Figure 7(a,b) shows the contours of the top surface for  $Bo=0.67$ and
  $2.0$ from the initial shape to the first peak. After this peak, the centre oscillates in a standing wave fashion about an equilibrium point, as shown in figure 7(c), until interacting travelling capillary waves jumble the surface. Eventually, the bubble settles to its new static shape and the trapped liquid spreads out and drains over the bubble cap. The whole process is shown in figure 4. A cylindrical coordinate system (figure 8a) is used to discuss the upper surface due to its symmetry. The angular coordinate,
  $\phi$, is measured from the vertical such that
  $\phi =0$ for the meridian contours shown in figure 7(a,b). The radial coordinate is
  $r$, and the longitudinal coordinate is
  $z$. The
  $z$ axis is parallel to the line connecting the parent bubble centres, and the origin lies at the centre of the radially expanding upper surface's neck (not necessarily the same point about which the underwater neck expands). The top surface is tracked by a height function
  $r=f(z,\phi ,t)$. The radial extent of the centre is defined relative to the point about which it oscillates as
  $h(t) = f(0,0,t) - r_{eq}$ is directly measured from the images. Due to symmetry, there is assumed to be an angle
  $\phi _c$ for which
  $f(z=0,-\phi _c < \phi < +\phi _c)$ is constant at any particular time until the symmetry is disturbed by the travelling capillary waves. This range of
  $-\phi _c < \phi < +\phi _c$ is the region of the upper surface which is assumed to be unaffected by the meniscus or surrounding liquid and varies with Bond number:
  $\phi _c = 0$ in the limit of
  $Bo \ll 1$ and
  $\phi _c = {\rm \pi}/2$ in the limit of
  $Bo \gg 1$. This assumption has been qualitatively verified, but the parent bubbles block a clear view of the expanding neck to measure
  $\phi _c$ precisely.

Figure 7. Evolution of the top surface and the relevant geometric parameters. The meridian contour sequence for  $Bo=0.67$ (a) and
  $2.0$ (b). The dark blue curve is the start of coalescence, and the light green is the first peak height of the centre (elapsed time between each line is different for (a,b)). There are many similarities in the contour evolution of each, including the trapped liquid mass and curvature reversal at the centre. (c) Evolution of the top surface centre,
  $h(t)$, during coalescence. The characteristic length and time scales of the behaviour both increase with Bond number. The end of the recorded signal is when travelling capillary waves start to dominate the dynamics of
  $h$, creating a disordered signal. As the scale of the bubble cap increases with Bond number, the larger Bond number trials exhibit more oscillations while the midpoint barely reaches its first peak before capillary waves arrive for the smallest Bond number trial (
 $Bo=0.38$). The dotted lines are at
  $c=0.002$ mMol SDS with no visible changes compared to the cases with lower surfactant.

Figure 8. Top surface geometry. (a) The cylindrical coordinate system of the top surface;  $\phi$ is the angular coordinate measured from the vertical (the meridian contours lie on
  $\phi =0$),
  $r$ is the polar coordinate, and
  $z$ is the longitudinal coordinate. (b) Measured features of the top-surface geometry which are relevant to the dynamics. Here,
  $L$ is the horizontal spacing between the cap peaks, and
  $D$ is the width of the liquid trapped in the meniscus between the bubble caps. (c) Cross-section of the trapped liquid mass in the plane containing the
  $z$-axis and
  $\phi =0$. At the moment of coalescence, the bulge is estimated as a triangular toroid, which is what would be obtained by rotating the section highlighted in red
  $-\phi _c < \phi < +\phi$ about the
  $z$-axis.
The dynamics of the midpoint of the top surface,  $h(t)$, could depend on capillary forces, gravity and the amount of liquid from the meniscus that is trapped in the film. The ‘wavelength’ of the standing wave oscillations is observed to be set by the horizontal spacing between bubble caps,
  $L$. The amount of liquid trapped in the meniscus between the bubble caps has a characteristic length scale,
  $D$, as illustrated in figure 8(b,c). The trapped liquid is the intersection of three thin films with a meniscus between them, as shown in figure 8(c), and a three-dimensional perspective can be seen in figure 9(a). The bulge is estimated as a section of a triangular toroid in the
  $z=0$ plane, centred at
  $\phi =0$, and subtending an angle of
  $2\phi _c$ (with an arclength of
  $\mathcal {W}$). The total mass of the liquid bulge is thus
  $m_{b} \sim \rho _l D^2 \mathcal {W}$. When the film separating the parent bubbles retracts, the liquid that had been in the meniscus of the intersection of the three films becomes trapped in the centre of the upper surface as shown in figure 9(a–c). The film thickness everywhere else is
  $O(10\text {--}100\ \mathrm {\mu }\textrm {m}$) and its mass is thus assumed to be negligibly small in comparison.

Figure 9. Retraction of the film separating  $Bo = 2.6$ parent bubbles with
  $c=0.002$ mMol of SDS. The bubbles were angled roughly
  $30^{\circ }$ away from the camera (the left bubble is further away) such that the liquid bulge at very early times of coalescence can be seen. Prior to coalescence, it is the intersection of three thin films, and after the centre film retracts the liquid is trapped. Tracking the exact shape of the trapped liquid is complex, and an initially triangular cross-section is assumed to estimate the amount of liquid in the bulge.
While the bulge eventually spreads out over the entire cap, the transport of the liquid from the bulge in the film is neglected in this analysis as it is observed to stay in a relatively concentrated region near the centre for the time period of interest, as shown in figure 4(a–o). It is only when interacting capillary waves distort the shape of the film, figure 4(p), that the light-coloured region of increased thickness is noticeably changed. The concentration of liquid on an oscillating film into a visible bulge has also been observed on large-amplitude oscillations of soap films (Drenckhan et al. Reference Drenckhan, Dollet, Hutzler and Elias2008), and the rapid motion of the film may slow down the transport of the liquid out of the film centre.
In the classical treatment of small-amplitude oscillations of bubbles, the mass of the film is neglected (Lamb Reference Lamb1932; Kornek et al. Reference Kornek, Müller, Harth, Hahn, Ganesan, Tobiska and Stannarius2010). In the region of the bulge where the thickness is  $O(1\ \textrm {mm})$, however, the inertial stress of the liquid in the bulge is dominant over that of the surrounding gas:
  $(\rho_l \dot{h}^2 D^2 / R_0^2) > (\rho _{g} \dot {h}^2 )$. The viscosity in both the water and air phases can both be neglected (
 $Re_{gas} = {\dot {h} R_0}/{\nu _{gas}} \approx 10^2$ and
  $Re_{liq} = {\dot {h} D}/{\nu _{liq}} \approx 10^3$). As such, a model for the oscillations – after the first peak of expansion – of the film at
  $z=0$ that balances the change in inertia of the bulge with surface tension and gravity forces is proposed. Neglecting the effects of interior and exterior gas and assuming that the only mass in the film is that of the trapped liquid localized to a very small region for the time scales of interest reduces the problem to that of a point mass on an otherwise mass-less thin film oscillating in a vacuum. Because of the neck's symmetry (
 $-\phi _c < \phi < +\phi _c$), a one-dimensional model for the radial neck growth,
  $h(t)$, is proposed.
As the centre of the top surface oscillates about its equilibrium,  $r_{eq}$, the capillary force acting on the bulge is estimated as
  $f_{cap} \sim -{h\sigma \mathcal {W}}/{L}$. This choice of length scales is motivated by observations that during the oscillations, the curvature (
 $\kappa$) change in the plane containing the
  $z$-axis with
  $\phi =0$ is greater than that in the
  $z=0$ plane. The wavelength of the standing wave centred at
  $z=0$ is observed to scale with the distance between the cap peaks,
  $L$, and the change in curvature about
  $h=0$ is thus
  $\kappa \sim h/L^2$. The force of gravity acting on the bulge is estimated as
  $f_{grav} \sim g \rho _l D^2 \mathcal {W}$, where
  $g$ is gravity. Balancing the change in inertia of the bulge with the sum of capillary and gravity forces yields
 \begin{equation} \ddot{h} \sim{-} \frac{\sigma}{\rho_l L D^2} h - g, \end{equation}
which has oscillatory solutions with a characteristic time scale of  $\tau _{I,top} \sim \sqrt {\rho _l D^2 L / \sigma }$. Under the assumptions of our model, which treats the bulge similar to a point mass, gravity does not affect the frequency of oscillation as the only restoring force is surface tension. The effect of gravity in this model is to change the point about which the oscillations occur as the bulge ‘sags’ downward. By neglecting the interior and exterior gas phases, this model is similar to that of an elastic membrane in which surface tension plays the role of elasticity. Because all of the liquid mass is assumed to remain concentrated at
  $z=0$ and the film is symmetric about the
  $z=0$ plane as well as the plane containing the
  $z$-axis and
  $\phi =0$, the model for the motion of the bulge is reduced to that of a suspended mass of liquid oscillating in a single dimension.
Equation (3.1) could have been also derived from the balance equations of fluid membranes (Coutris Reference Coutris1993) by making the same assumptions and averaging over  $-L/2 < z < +L/2$. A complete model of the surface evolution would need to include the other principal curvature and account for the drainage of the trapped liquid through the film (and consequentially the variable thickness of the film) instead of considering it like a point mass. If the effects of the gas inside and outside the bubble are no longer neglected, the relevant system comprises three fluids with two interfaces. In this configuration, gravity can act as a restoring force, so gravity waves could also be considered (Grinfeld Reference Grinfeld2012; Patankar, Farsoiya & Dasgupta Reference Patankar, Farsoiya and Dasgupta2018). However, the ratio of the pressure due to gravity acting on the gas inside the bubble (
 $\rho _g g h$) to capillary pressure (
 $2 \sigma h / L^2$) is
  $O(0.001)$, which indicates that capillarity would be the dominant restoring force in the model.
Measurements of  $L$ are shown in figure 10(a). The filled black circles are at
  $c= 0.001$ mMol of SDS while the empty stars are at
  $c=0.002$ mMol. As the geometry for diminishingly small Bond number (
 $Bo \ll 1$) is that of two spheres,
  $L = 2R_0$ which is displayed by the upper grey dashed line. In the limit of
  $Bo \gg 1$, the top surface centre is the intersection of 3 thin films which each intersect at roughly
  $120^{\circ }$: a Plateau border. With this geometric intuition, the meridian centre is roughly where the cap of a single bubble is
  $120^{\circ }$ from vertical:
  $L = 2^{1/3} R_0$, which is shown by the lower grey dashed line of figure 10(a). Measurements of
  $D$ are shown in figure 10(b) along with a proposed function with a single fitting parameter. For
  $Bo \gg 1$, the meniscus joins the parent bubble caps and the thin-film interface between the air pockets; the characteristic size of the triangular cross-section is
  $D\sim l_c$ because coalescence starts before significant drainage can occur. For
  $Bo \ll 1$ bubbles, the trapped liquid is above the contact point of two spheres (figure 3a) and
  $D \sim O(R_0)$. As such, we introduce the empirical function:
  $D / R_0 = \chi (1+Bo)^{-0.5}$, once again leveraging the definition of
  $Bo = R_0^2 / l_c^2$, where
  $\chi =0.75$ is a non-dimensional constant fit to the data (figure 10b) since the prefactor is not determined by the simple scaling model. Note, a two-parameter function could also have been considered to describe the data.

Figure 10. Measured features and the proposed time and length scales of the problem. The black filled circles correspond to experiments at  $c=0.001$ mMol and the unfilled stars are
  $c=0.002$ mMol. (a) Measurements of the cap peak spacing,
  $L$, as a function of
  $Bo$. The grey dashed lines are the theoretical geometric limits. At
  $Bo \ll 1$, the caps are separated by
  $L=2R_0$ (the upper grey dashed line) since the geometry is nearly that of two spheres in contact. The lower grey dashed line (
 $L=2^{1/3}R_0$) is the
  $Bo \gg 1$ limit in which a Plateau border-like structure is observed with the caps intersecting close to where a single bubble cap is
  $120^{\circ }$ from vertical. (b) Measurements of the trapped liquid width,
  $D$, as a function of
  $Bo$ and the proposed function (dashed line):
  $D/R_0 = \chi (1+Bo)^{-0.5}$, with
  $\chi =0.75$ fit to the data. (c) Comparison of the measured time scale with that of the model,
  $\tau _{I,top} = 0.612\sqrt {\rho _l D^2 L / \sigma }$ with
  $0.612$ fit to the data. (d) Value of
  $\Delta H$, which is the height of the first peak, as a function of Bond number. Note that increasing surfactant over the range studied does not change the dynamics.
The measured time and length scales which collapse the  $h(t)$ oscillations are the time (
 $\tau _{I,top}/2$) and height (
 $\Delta H$) of the first expansion peak and are presented in figures 10(c) and 10(d), respectively. When compared to the proposed time scaling of
  $\sqrt {\rho _l D^2 L / \sigma }$, the estimated time scale matches the trend of the data quite well with a prefactor of
  $0.612$. The measured length scale, which collapses the data,
  $\Delta H$ is shown in figure 10(d).
The rescaled growth of the meridian centre,  $h(t)$, throughout coalescence is shown in figure 11. The data are shown up to the point that travelling capillary waves reach the meridian centre; more oscillations are visible with increasing Bond number as the waves must travel further with increasing bubble size. In fact, the smallest trial with
  $Bo=0.39$ barely reaches the first peak before the capillary waves start to dominate the interface dynamics. The oscillations across all Bond number can be collapsed together by rescaling length and time by
  $\Delta H$ and
  $\tau _{I,top}$, respectively. As the shape of the new bubble is established and the gas inside the parent bubbles come together, the point about which the film oscillates moves upwards due to an effective change in boundary conditions of the top surface film and the new static shape is reached.

Figure 11. Collapse of  $h(t)$ across Bo made dimensionless by the height (
 $\Delta H$) and time (
 $\tau _{I,top}/2$) of the first peak for each signal. As the proposed oscillator model is valid after the first peak (
 $(t-t_*)/\tau _{I_top}>0.5$), this part of the data is highlighted in the plot. The collapse of the data supports the proposed model which balances the change in inertia of the trapped liquid mass with the restoring force of surface tension as the liquid mass oscillates about its equilibrium point, which is determined by the balance of surface tension and gravity. The symmetry of the film reduces the model to a one-dimensional oscillator.
The result of increasing surfactant to  $c=0.002$ mMol is shown in figure 11(a–d), and there is no significant difference in the coalescence dynamics at both large and small Bond numbers.
4. Conclusion
Bubble coalescence at the free surface is important for both its role in sea spray aerosol production and its fundamental relevance as an interfacial process. The regime of very low surfactant concentration ( $c=0.001$ mMol) is studied so that the bubbles last long enough on the surface to coalesce. Increasing the SDS concentration to
  $c=0.002$ mMol has no effect on the dynamics, so that our results are general in the limit of very small contamination. We have shown that in the limit of
  $Bo \ll 1$, coalescence is very similar to that in the bulk. As the Bond number increases, the bubbles deform and new behaviour appears. For the neck growth underwater, a new length scale is presented,
  $R_c$, which captures the relevant bubble geometry. With it, the established inertial–capillary scaling becomes
  $r / R_c \propto (t / \tau _i(R_c) )^{1/2}$ and collapses the data for
  $Bo=0.15$ to
  $2.38$ as
  $R_c \to R_0$ in the small
  $Bo$ limit. Furthermore, we present the formal collapse of the entire underwater neck contour to a single curve that is independent of the Bond number. The bubble's evolution above the free surface is distinctly different. Liquid from the meniscus between the parent bubbles is trapped in the top surface film. A simple oscillatory model which is valid for times at which the trapped liquid does not drain is presented; the change in inertia of the trapped liquid is balanced by capillary and gravity forces. Gravity controls the shape of the initial parent bubbles and the final bubble, but it does not affect the time scale of the oscillation. The proposed model matches the collapsed data well for a range of different Bond numbers. The characteristic time scale of the process is
  $\tau _{I,top} \sim \sqrt {\rho _l D^2 L / \sigma }$, with
  $L$ and
  $D$ determined by the geometry of the upper surface and the amount of liquid trapped in the film.
Supplementary movies
Supplementary movies are available at https://doi.org/10.1017/jfm.2021.173.
Acknowledgements
We thank the anonymous reviewers for their useful comments as well as P.K. Farsoiya and B. Néel for discussion.
Funding
This material is based upon work supported by the National Science Foundation Graduate Research Fellowship Program under grant no. 1656466 to D.B.S. This work was supported by the National Science Foundation (Physical Oceanography) under grant no. 1849762 to L.D., a SEAS innovation grant to L.D., and the Princeton Catalysis Initiative.
Declaration of interests
The authors report no conflict of interest.


