Introduction
Schizophrenia is associated with significant impairments in multiple cognitive and perceptual domains. Among these perceptual domains, increasing evidence suggests that the visual system is an important site of pathology and dysfunction in the disease (Silverstein and Keane, Reference Silverstein and Keane2011b; Yoon et al., Reference Yoon, Sheremata, Rokem and Silver2013; Silverstein, Reference Silverstein, Li and Spaulding2016). Research in schizophrenia has demonstrated a wide variety of perceptual deficits implicating abnormalities at various levels of the visual system, including but not limited to deficits in perceptual organization, motion processing, visuospatial memory, contrast perception, backward masking, and context evaluation functions (Green et al., Reference Green, Nuechterlein and Mintz1994; Chen et al., Reference Chen, Palafox, Nakayama, Levy, Matthysse and Holzman1999b; Coleman et al., Reference Coleman, Cook, Matthysse, Barnard, Lo, Levy, Rubin and Holzman2002; Leiderman and Strejilevich, Reference Leiderman and Strejilevich2004; Dakin et al., Reference Dakin, Carlin and Hemsley2005; Uhlhaas et al., Reference Uhlhaas, Phillips, Schenkel and Silverstein2006b; Silverstein et al., Reference Silverstein, Keane, Barch, Carter, Gold, Kovács, MacDonald, Ragland and Strauss2012; Yang et al., Reference Yang, Tadin, Glasser, Hong, Blake and Park2013).
Tools that evaluate visual functions present unique opportunities to identify abnormalities in specific brain circuitry in schizophrenia, and may ultimately have clinical utility (Silverstein and Keane, Reference Silverstein and Keane2011b; Yoon et al., Reference Yoon, Sheremata, Rokem and Silver2013; Silverstein, Reference Silverstein, Li and Spaulding2016). Although imaging, genetics, and electrophysiology have identified a variety of potential ‘biomarkers’ for psychotic disorders, an important limitation to some of these methods is their practical applicability. Vision science tools provide a great advantage over high-tech methods in practicality. Besides the advantage of requiring less complex equipment for evaluation, impairment of some visual functions has been shown to predict later development of schizophrenia (Klosterkotter et al., Reference Klosterkotter, Hellmich, Steinmeyer and Schultze-Lutter2001; Schubert et al., Reference Schubert, Henriksson and McNeil2005) and to be relatively specific to psychotic disorders (Uhlhaas et al., Reference Uhlhaas, Phillips and Silverstein2005; Chen et al., Reference Chen, Levy, Sheremata and Holzman2006; Koethe et al., Reference Koethe, Kranaster, Hoyer, Gross, Neatby, Schultze-Lutter, Ruhrmann, Klosterkötter, Hellmich and Leweke2009; Sheffield et al., Reference Sheffield, Gold, Strauss, Carter, MacDonald, Ragland, Silverstein and Barch2014). Together these findings suggest both relevance of deficits to psychosis and potential neurobiological markers of illness and/or pathophysiology.
Today, increasing evidence suggests that the term ‘schizophrenia’ is an umbrella term for a heterogeneous group of disorders that have different clinical presentations and biological backgrounds (Tamminga et al., Reference Tamminga, Ivleva, Keshavan, Pearlson, Clementz, Witte, Morris, Bishop, Thaker and Sweeney2013; Brugger and Howes, Reference Brugger and Howes2017). For this reason, demonstrating deficits of different functions in distinct patient samples provides limited information to understand the extent and characteristics of these impairments. Investigating these deficits in the same patient population would provide a better understanding of the extent of involvement in different levels of visual processing stream, the relationship of impairments with each other and with different symptom dimensions.
For a comprehensive understanding of the nature of these visual deficits, another important area of study is their relationship with schizotypal traits in healthy individuals. Visual impairments have been demonstrated in individuals at high clinical risk and first-degree relatives of patients with psychosis (Chen et al., Reference Chen, Nakayama, Levy, Matthysse and Holzman1999a, Reference Chen, Bidwell and Holzman2005; Green et al., Reference Green, Nuechterlein, Breitmeyer and Mintz2006; Silverstein et al., Reference Silverstein, Uhlhaas, Essex, Halpin, Schall and Carr2006; Mittal et al., Reference Mittal, Gupta, Keane and Silverstein2015; Pawełczyk et al., Reference Pawełczyk, Kotlicka-Antczak, Rabe-Jabłońska, Pawełczyk, Ruszpel and Łojek2015). However, there are a limited number of studies on schizotypal traits and their relationships with visual perceptual functions (Uhlhaas et al., Reference Uhlhaas, Silverstein, Phillips and Lovell2004; Bressan and Kramer, Reference Bressan and Kramer2013; Ribolsi et al., Reference Ribolsi, Lisi, Di Lorenzo, Rociola, Niolu and Siracusano2013; Fonseca-Pedrero et al., Reference Fonseca-Pedrero, Badoud, Antico, Caputo, Eliez, Schwartz and Debbané2015).
In this study, we aimed to develop a visual task battery to better characterize features of visual perceptual deficits in patients with psychosis in addition to investigating their relationship with schizotypal traits in healthy individuals. We evaluated five functions in the task battery: velocity discrimination (VD), visuospatial working memory (VSWM), visual context processing, perceptual organization, and backward masking. We chose these domains among visual functions that have been consistently shown to be impaired in schizophrenia (Yoon et al., Reference Yoon, Sheremata, Rokem and Silver2013; Silverstein, Reference Silverstein, Li and Spaulding2016). To be able to identify individuals with deficits at various levels of visual processing, we included tasks that evaluate early-stage visual processing [e.g. perceptual organization (Silverstein et al., Reference Silverstein, Berten, Essex, Kovács, Susmaras and Little2009; Silverstein and Keane, Reference Silverstein and Keane2011a)] and higher cognitive/visual pathways (e.g. VSWM); dorsal [e.g. VD, VSWM (Ungerleider et al., Reference Ungerleider, Courtney and Haxby1998; Kim et al., Reference Kim, Wylie, Pasternak, Butler and Javitt2006)] and ventral processing streams [e.g. perceptual organization (Altmann et al., Reference Altmann, Bülthoff and Kourtzi2003; Uhlhaas et al., Reference Uhlhaas, Phillips, Mitchell and Silverstein2006a)]. Another factor that impacted components of the battery was its practical applicability. For this reason, we did not include evaluations that require specialized equipment. Using this battery, we investigated these visual domains in patients with schizophrenia, schizoaffective disorder, and healthy controls and assessed their relationship with symptom severity in the patient group, and with schizotypal features in the healthy control group.
Methods and materials
Participants
Thirty-two patients (10 with schizophrenia and 22 with schizoaffective disorder) and 40 healthy control subjects, ages 18–60 participated in the study at McLean Hospital, Belmont, MA, USA. Current and past psychiatric diagnoses were assessed using the Structured Clinical Interview for DSM IV-TR (SCID) (First et al., Reference First, Spitzer, Gibbon and Williams2002). Patients met the Diagnostic and Statistical Manual of Mental Disorders-IV-TR (DSM-IV-TR) (American Psychiatric Association, 2000) criteria for schizophrenia and schizoaffective disorder. Healthy control subjects were matched for age, sex, and parental socioeconomic status with patients. Please see online Supplementary Material for inclusion and exclusion criteria. Four patients and nine healthy control subjects were excluded due to low visual acuity (assessed by Snellen Eye Chart), positive urine toxicology screen, or an inability to engage in the experiments indicated by random answers to tasks. Data gathered from 28 patients (six with schizophrenia and 22 with schizoaffective disorder) and 31 healthy controls were analyzed.
The study was approved by the Partners Institutional Review Board. All participants gave written informed consent. Symptom severity was assessed using the Positive and Negative Syndrome Scale (PANSS) (Kay et al., Reference Kay, Fiszbein and Opler1987). Symptoms were grouped into five factors according to the model of van der Gaag et al. (Reference van der Gaag, Hoffman, Remijsen, Hijman, de Haan, van Meijel, van Harten, Valmaggia, de Hert, Cuijpers and Wiersma2006), which includes positive, negative and disorganization symptoms, excitement and emotional distress factors. Schizotypal traits in healthy control subjects were assessed using the Schizotypal Personality Questionnaire (Raine, Reference Raine1991). Parental index of social position (ISP) was calculated using Hollingshead Four Factor Index of Social Position (Hollingshead, Reference Hollingshead1975).
Administration of psychophysical tasks
All experimental stimuli were presented on a CRT monitor (Viewsonic E771 CRT 17″). The participant's head was stabilized using a chin and head rest at a distance of 75 cm from the screen. Five perceptual domains of visual processing were evaluated using psychophysical tasks. Please see online Supplementary Material for additional details of methods used in psychophysical tasks.
Velocity discrimination
VD performance was assessed by a two alternative, forced choice procedure (Chen et al., Reference Chen, Levy, Sheremata and Holzman2006). Participants were asked to indicate the faster of the two gradients (drifting Gabor patches) which were presented sequentially (Fig. 1a). VD threshold of each subject was determined using a two alternative forced choice procedure combined with a standard two-down one-up staircase. We terminated the sessions after eight reversals of staircase directions, instead of 12 reversals as used in the previous studies (Chen et al., Reference Chen, Nakayama, Levy, Matthysse and Holzman1999a; Reference Chen, Levy, Sheremata and Holzman2006). The recommended procedure is to continue testing until at least six reversals are obtained (Levitt, Reference Levitt1971), which is warranted here. Patients with schizophrenia were expected to demonstrate higher discrimination thresholds that indicate impaired VD. This task session lasted about 3–4 min.

Fig. 1. Paradigms and stimuli that are included in the visual task battery. (a) Schematic description of velocity discrimination task. Two drifting gradients were presented sequentially for 308 ms with an inter-stimulus interval of 508 ms. Subjects were asked to indicate the faster of the two gradients (Chen et al., Reference Chen, Levy, Sheremata and Holzman2006). (b) Stimuli used in the Odd One Out Task. Participants were asked to remember the location of odd shapes in sequentially presented stimuli sets, and indicate where the odd shapes appeared, in the correct order of appearance. (c) Illustration of 3D visual stimuli in the context processing task. Identical spheres in different sizes were presented in two different positions (back and front). Participants were asked to match the size of the disk on the right with the size of the sphere on the left (Fang et al., Reference Fang, Boyaci, Kersten and Murray2008). (d1) Examples of stimuli used in the demonstration and catch trials in the jittered orientation visual integration (JOVI) task. (d2) Example of a rightward-pointing closed contour stimulus presented in the practice trial and the actual task session (JOVI task is a part of the CNTRACS battery, stimuli were used with their permission).
Visuospatial working memory
VSWM was evaluated using the ‘Odd One Out’ task as adopted by Ziermans (Reference Ziermans2013) based on a similar task in the Automated Working Memory Assessment (Alloway, Reference Alloway2007). In this task, participants were presented sets of three shapes and asked to remember the location of the odd one out of the three shapes in the correct order of appearance (Fig. 1b). The task started with level 2, in which two sets were presented sequentially. After two correct trials on each level, one more set was presented compared with the previous level. When two trials on the same level were incorrect, the session was terminated. The final score was calculated based on the highest level achieved using the method described by Ziermans (Reference Ziermans2013). This task lasted for 3–5 min, depending on the performance of the participant.
Visual context processing
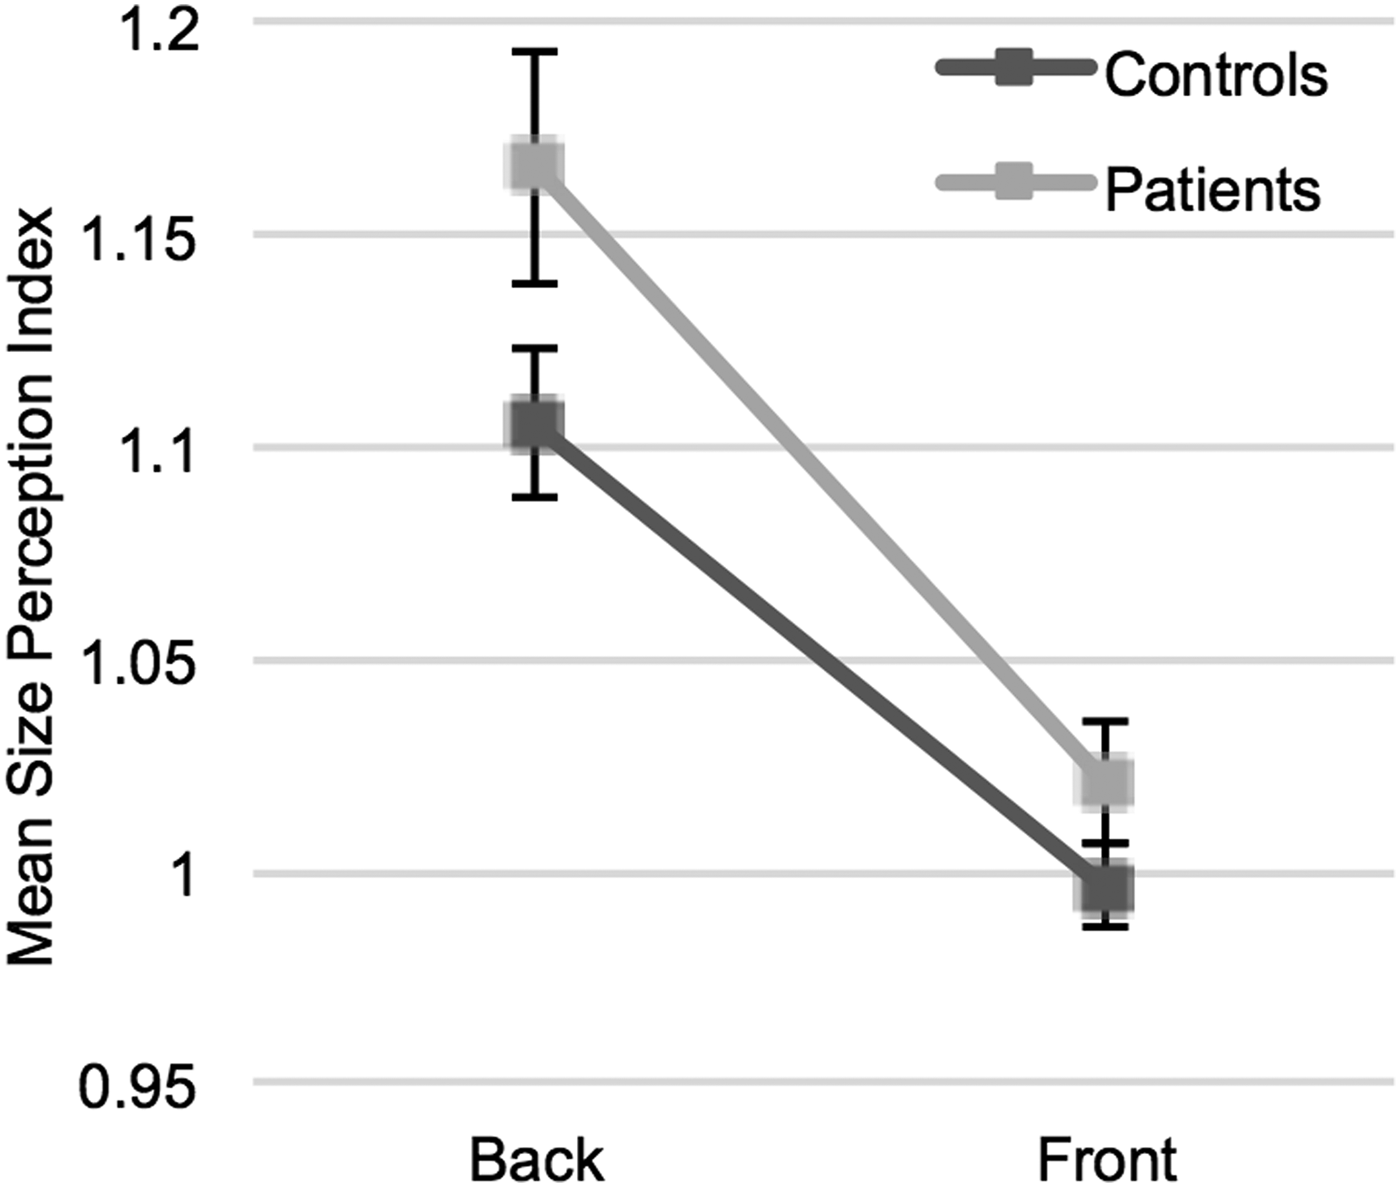
Three-dimensional (3D) contextual information can lead to size illusions. To investigate the perceived image size in a complex environment, a size illusion task has been used (Fang et al., Reference Fang, Boyaci, Kersten and Murray2008). Five different sized spheres were illustrated in a hallway either at a close location (‘front’) or at a far location (‘back’). In each trial, the participant was asked to adjust the size of a 2D disk to match the size of the presented sphere on the other half of the screen (Fig. 1c). As the measure of performance, we computed a size perception index (SPI) defined as perceived size/actual size. Average SPIs for two different contexts (front or back) were calculated for each participant. This task session comprised of 40 trials (20 trials for each context) and lasted for 4–5 min.
Contour integration and backward masking
Contour integration has been assessed using the Jittered Orientation Visual Integration (JOVI) task, developed by the Cognitive Neuroscience Test Reliability and Clinical Applications for Schizophrenia (CNTRACS) Consortium with their permission (Silverstein et al., Reference Silverstein, Keane, Barch, Carter, Gold, Kovács, MacDonald, Ragland and Strauss2012). In this paradigm, the test stimulus is a group of Gabor elements that jointly formed an oblong-shaped contour. In each trial either a leftward- or a rightward-pointing shape was presented in a field of disconnected, randomly oriented Gabor elements, and subjects were asked to indicate the pointing direction of the stimulus (Fig. 1d). The amount of orientational jitter added to the elements that formed the contour was 7°. Silverstein et al. (Reference Silverstein, Keane, Barch, Carter, Gold, Kovács, MacDonald, Ragland and Strauss2012) demonstrated a significant performance difference between healthy participants and patients in the 7° jitter condition. For this reason, instead of using six different jitter conditions as in the original study, we only used the 7° jitter condition. However, we included more trials on this condition compared with the original task. The task was comprised of 56 trials and lasted for 5 min including instructions and practice sessions. The proportion of correct trials was calculated for each subject as an indicator of visual integration performance. In a second session, a backward masking task was implemented using the JOVI paradigm. Please see online Supplementary Material for details.
After each task, there was a 4–5 min break to get feedback about the previous task and provide instructions for the next task. The complete battery lasted for 50–60 min.
Statistical approach
All analyses were carried out using SPSS Version 17 (Chicago, IL, USA). Two-sample t tests and χ2 tests were used to compare demographic characteristics of patient and control groups. Two-sample t tests were used to compare VD, VSWM, and JOVI performances of the two groups. In VD task analyses, one subject's data were excluded due to being an outlier (value more than 1.5 interquartile range). To compare the perceived size difference for two different contexts (back and front positions) in between patient and control groups, a mixed factorial analysis of variance (ANOVA) was performed. A mixed factorial ANOVA was conducted to compare the effect of different interstimulus intervals (ISIs) on backward masking task performances in between patient and control groups. To evaluate the relationship between task performances and clinical features (PANSS scores in the patient group, SPQ scores in healthy participants), exploratory correlation analyses were performed. In linear regression and correlation analyses, observations that have higher Cook's Distance values than 4/n were identified as outliers and excluded, where n is the number of observations.
Results
Demographic variables
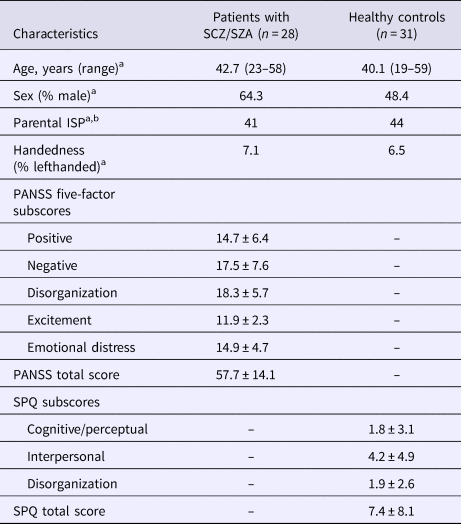
Sociodemographic and clinical characteristics of participants are presented in Table 1. The patient and control groups did not differ in age, sex, mean parental ISP, or handedness.
Table 1. Sociodemographic and clinical characteristics of participants

SCZ, schizophrenia; SZA, schizoaffective disorder; ISP, index of social position; PANSS, Positive and Negative Syndrome Scale; SPQ, Schizotypal Personality Questionnaire.
a p > 0.05.
b ISP score is calculated by using Hollingshead, Four Factor Index of Social Status, 1975.
Comparison of task performances between patient and control groups
Figure 2 indicates task performances in JOVI, VSWM, and VD experiments in patient and control groups. JOVI and VSWM performances were significantly lower in the patient group compared with controls [independent samples t test, for JOVI: t(57) = 4.17, p < 0.001, d = 1.07; for VSWM: t(57) = 3.48, p = 0.001, d = 0.90]. VD thresholds were significantly higher in the patient group than the control group [independent samples t test, t(56) = −2.296, p = 0.025, d = 0.60]. This demonstrates that the minimum velocity difference that was needed to discriminate two different velocities was larger in patients than controls.
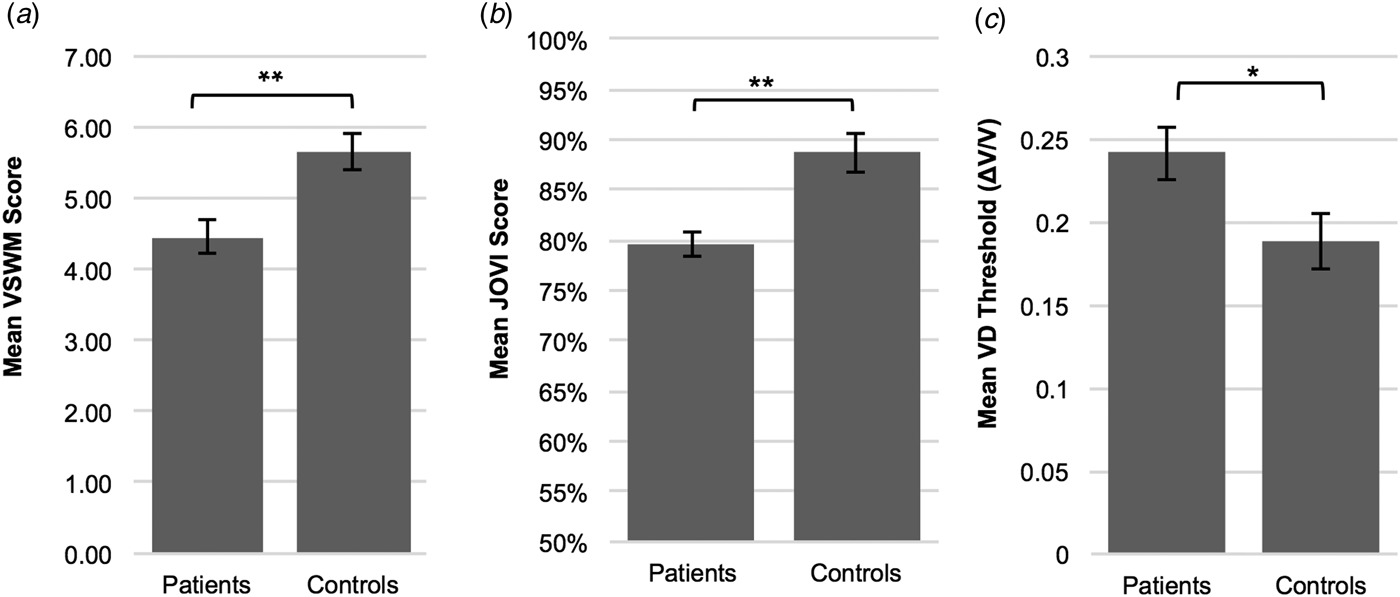
Fig. 2. Mean performance scores on contour integration (jittered orientation visual integration – JOVI), visuo-spatial working memory (VSWM) and velocity discrimination (VD) tasks in patient and control groups. (a) VSWM performance was significantly lower in the patient group (M = 4.46, s.d. = 1.37) compared with controls (M = 5.66, s.d. = 1.28). (b) Patients (M = 79.59, s.d. = 10.10) showed significantly lower JOVI performance than the healthy control group (M = 88.70, s.d. = 6.46). (c) The ordinate is expressed as the Weber fraction (ΔV/V), in which ΔV is the velocity difference and V is the base velocity. The mean VD threshold was significantly higher in the patient group (M = 0.24, s.d. = 0.09) compared with controls (M = 0.19, s.d. = 0.09), which indicates impaired velocity discrimination performance in patients. *p < 0.05, **p ⩽ 0.001. Error bars = 1 s.e.
In the visual context processing experiment, a mixed factorial ANOVA showed that the main effect of context (back or front positions) was significant [F (1,57) = 97.52, p < 0.001]. In both groups, the proportion of the perceived size to actual size was higher when the sphere was located at a further position, compared with the front position. However, the interaction between groups and context was not significant [F (1,57) = 1.96, p = 0.167]. These findings demonstrate that patients and healthy controls showed similar perception alterations when the perspective context changed (Fig. 3).

Fig. 3. Visual context perception task results. Points represent mean size perception indices (SPI) (proportion of the perceived size to actual size) for different contexts (back and front positions) in patients and control groups. In both groups, participants tend to see the sphere larger when illustrated at a far depth (back) than it was at a close depth (front). There was no interaction between groups and the context. Error bars = 1 s.e.
For the backward masking task, a mixed factorial ANOVA was conducted to compare the effect of ISIs on task performances in between two groups. Neither the main effect of ISI, nor the interaction between ISI and groups were significant [respectively, F (4,57) = 2.207, p = 0.081; F (4,57) = 0.749, p = 0.51] (Figure S1).
Correlations of task performances with each other and with clinical characteristics
We performed an exploratory correlation analysis to investigate the relationship between performances in various tasks. The backward masking task was not included in the analysis, due to failure to demonstrate a significant difference in performance with alternating ISIs. In both groups, the VSWM performance was significantly correlated with the VD performance (for patients, p = 0.001; for controls, p = 0.01, Table S1).
Table 2 shows the correlations between clinical characteristics and visual task performances in both groups. In the patient group, VSWM, JOVI, and VD performances were found to be inversely correlated with the negative symptom severity, but not with the other four symptom dimensions in the five-factor PANSS model. In healthy participants, the VSWM performance was negatively correlated with cognitive–perceptual and interpersonal (negative) schizotypal traits. There was a positive correlation between VD thresholds and interpersonal schizotypal traits, which indicates an inverse relationship between the VD performance and negative schizotypal traits.
Table 2. Correlations between visual task performances and clinical scale scores
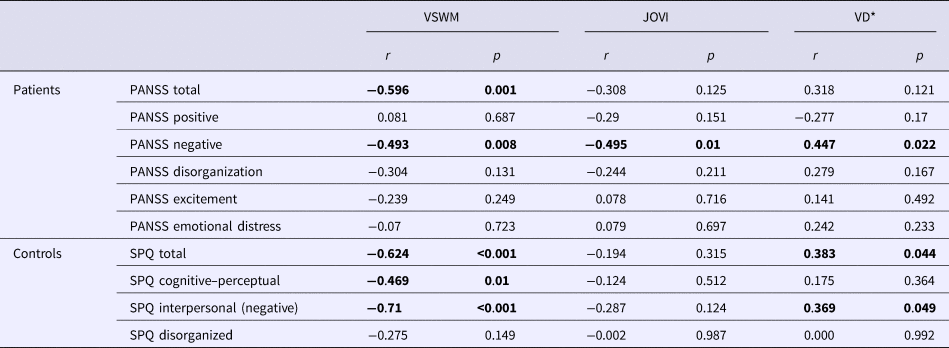
VSWM, visuospatial working memory task performance; JOVI, jittered orientation visual integration task performance; VD, velocity discrimination threshold; PANSS, Positive and Negative Syndrome Scale; SPQ, Schizotypal Personality Questionnaire, r = correlation coefficient. *VD threshold is used as the indicator of VD performance. Higher VD thresholds indicate poorer performance. Therefore, a positive correlation between VD thresholds and negative symptom scores indicates an inverse relationship between the task performance and negative symptoms.
Discussion
In this study, we investigated visual perceptual deficits in patients with schizophrenia and schizoaffective disorder using a practical task battery that evaluates different visual pathways. In line with previous studies, our data demonstrated that patients with schizophrenia and schizoaffective disorder showed significantly lower performance than healthy participants in VSWM, contour integration, and VD tasks (Park et al., Reference Park, Püschel, Sauter, Rentsch and Hell1999; Lee and Park, Reference Lee and Park2005; Chen et al., Reference Chen, Levy, Sheremata and Holzman2006; Uhlhaas et al., Reference Uhlhaas, Phillips, Mitchell and Silverstein2006a; Silverstein et al., Reference Silverstein, Keane, Barch, Carter, Gold, Kovács, MacDonald, Ragland and Strauss2012). Demonstrating these impairments in the same single group of patients provides stronger evidence for abnormalities at multiple levels of the visual processing stream in psychotic disorders. The inter-correlation pattern of these three tasks is in line with their underlying neurophysiologic mechanisms (discussed further below), and provides further evidence that they probed impairments in these mechanisms. Furthermore, we demonstrated that VSWM, JOVI, and VD performances were correlated with negative symptom severity, but not with other symptoms dimensions in patients. Parallel to that, VSWM and VD performances were correlated with negative schizotypal traits in healthy participants.
Visuospatial working memory
Our results on the relationship between VSWM and negative symptoms are largely consistent with studies in the literature (Carter et al., Reference Carter, Robertson, Nordahl, Chaderjian, Kraft and O'Shora-Celaya1996; Park et al., Reference Park, Püschel, Sauter, Rentsch and Hell1999; Pantelis et al., Reference Pantelis, Stuart, Nelson, Robbins and Barnes2001). In our sample, VSWM was correlated with both cognitive–perceptual and interpersonal schizotypal traits in healthy participants. In parallel to our results, VSWM impairments have been reported in relation to perceptual disturbances (Park et al., Reference Park, Holzman and Lenzenweger1995; Tallent and Gooding, Reference Tallent and Gooding1999), as well as social anhedonia in healthy individuals (Park and McTigue, Reference Park and McTigue1997; Tallent and Gooding, Reference Tallent and Gooding1999; Gooding and Tallent, Reference Gooding and Tallent2003). Our findings, extending the evidence in the literature, suggest that VSWM deficits are related to negative symptoms in patients, and also has trait indicator characteristics.
Contour integration
In the JOVI experiment, we only used the 7° jitter condition as opposed to six different conditions (see online Supplementary Material for details) as suggested by Silverstein et al. (Reference Silverstein, Keane, Barch, Carter, Gold, Kovács, MacDonald, Ragland and Strauss2012). This modification allowed us to collect more data on the 7° condition, and shorten the task duration to avoid fatigue. Our results show that this shorter version of the task was able to demonstrate a significant difference between groups.
Impaired perceptual organization has been associated mostly with high levels of disorganization (Uhlhaas et al., Reference Uhlhaas, Phillips and Silverstein2005, Reference Uhlhaas, Phillips, Mitchell and Silverstein2006a; Joseph et al., Reference Joseph, Bae and Silverstein2013), but also with negative symptoms (Kéri et al., Reference Kéri, Kiss, Kelemen, Benedek and Janka2005). In our sample, impaired JOVI performance was correlated with negative symptom severity, but not with the disorganization factor. The discrepancy between these studies might be due to differences in experimental paradigms, patient profiles (e.g. low disorganization scores in our sample) or effects of attentional and motivational deficits. Although we used catch trials to control for attention and motivation (see online Supplementary Material), it is difficult to completely rule out their effects on cognitive tasks.
Velocity discrimination
To reduce the time burden on patients and avoid fatigue, the VD task that we adopted was slightly different than previous studies (Chen et al., Reference Chen, Nakayama, Levy, Matthysse and Holzman1999a, Reference Chen, Levy, Sheremata and Holzman2006). As discussed in detail in online Supplementary Material, although the number of trials was less than previous studies, sufficient data were collected to meet the requirements of standard threshold estimation methods. Our results show that this shorter version of the task was able to demonstrate the VD impairment in the patient group.
In our study, negative symptom severity in patients, and negative schizotypal features in healthy participants were modestly correlated with the VD performance. Chen et al. (Reference Chen, Levy, Sheremata and Holzman2006) reported a modest but significant correlation between BPRS scores and VD thresholds. However, there is scarce evidence on the relationship between VD deficits and negative symptoms. This relationship needs to be further evaluated in future studies. In line with our results on the association between schizotypal features and task performance, VD deficits were demonstrated in first-degree relatives of patients with schizophrenia (Chen et al., Reference Chen, Nakayama, Levy, Matthysse and Holzman1999a). These findings suggest that VD might be an indicator of predisposition to schizophrenia.
A potentially confounding factor with the VD task is the sequential presentation of stimuli. To discriminate the velocities, working memory resources need to be engaged, which might be an explanation for the correlation between scores on VD and VSWM tasks. However, the strong relationship between these tasks is consistent with the suggested neurophysiologic mechanisms underlying these measures. Both VSWM and VD are processed in the dorsal stream (the ‘where’ pathway), which evaluates motion and location information (Ungerleider and Haxby, Reference Ungerleider and Haxby1994; Ungerleider et al., Reference Ungerleider, Courtney and Haxby1998; Kim et al., Reference Kim, Wylie, Pasternak, Butler and Javitt2006). This contrasts with our measure of perceptual organization, which is thought to be processed within the ventral visual stream (the ‘what’ pathway), which is involved in stimulus identification (Altmann et al., Reference Altmann, Bülthoff and Kourtzi2003; Uhlhaas et al., Reference Uhlhaas, Phillips, Mitchell and Silverstein2006a; McMains and Kastner, Reference McMains and Kastner2010). Additionally, contour integration is thought to be primarily processed early in the visual system (e.g. V1–V4), although recent evidence suggests the involvement of higher level processes (Kourtzi et al., Reference Kourtzi, Tolias, Altmann, Augath and Logothetis2003; Silverstein et al., Reference Silverstein, Berten, Essex, Kovács, Susmaras and Little2009, Reference Silverstein, Harms, Carter, Gold, Keane, MacDonald, Daniel Ragland and Barch2015). These tasks, when used together, would capture the variance both in early and higher visual/cognitive processes, along with the variance in ventral and dorsal pathways. Although detailed knowledge of physiology and functional anatomy is available for the visual system, it is important to note that the structural and functional relationship is not yet fully understood. These suggestions are made in the light of current knowledge.
Visual context processing
In this paradigm, the performance of patients with psychosis was relatively preserved: participants from both patient and control groups tended to perceive the sphere as larger when illustrated at a further (v. closer) position in a hallway, with no difference between groups. In previous studies, abnormalities in context-dependent size perception have been reported in patients with schizophrenia who have high disorganization symptom scores (Uhlhaas et al., Reference Uhlhaas, Phillips, Schenkel and Silverstein2006b; Horton and Silverstein, Reference Horton and Silverstein2011). One reason for this discrepancy may be differences in patient profiles. In the present study, patients had relatively low disorganization scores as mentioned above. However, it should be noted that deficits in context-dependent suppression in schizophrenia have also been demonstrated in studies that use general patient samples (patients with and without disorganization) (Dakin et al., Reference Dakin, Carlin and Hemsley2005; Tadin et al., Reference Tadin, Kim, Doop, Gibson, Lappin, Blake and Park2006; Kantrowitz et al., Reference Kantrowitz, Butler, Schecter, Silipo and Javitt2009). Another reason might be differences in experimental paradigms. Our paradigm evaluated the processing of context information that depended on visual perspective, which has not been assessed in patients with schizophrenia previously.
Backward masking
The paradigm that was implemented using the JOVI task failed to demonstrate the expected effect of ISI manipulation on task performance. One possible explanation would be the learning effect caused by the JOVI task. Due to the learning effect, a brief critical stimulus duration and ISI might have been adequate for post-presentation decision making. Another reason might be the narrow range of ISIs that we chose. Repeating this experiment using a larger ISI range in participants who are naive to JOVI task would enable us to better understand the characteristics of perceptual responses to this task.
Limitations
This study also has certain limitations. One limitation is the adoption of brief versions of VD and JOVI tasks in the study. Using original versions would yield better reliability and stability of performance measures. However, it would not be practical for our purpose of establishing a task battery and would result in fatigue or impaired sustained attention, which also affect the reliability of the assessments. As discussed earlier, we believe that a sufficient number of trials were administered to yield reliable measures of individual differences in both tasks.
Our sample included a preponderance of patients with schizoaffective disorder, which limits the generalizability of our results to other psychotic disorders. However, the visual functions evaluated in the task battery have been investigated in previous studies and demonstrated to be deficient in patients with schizophrenia in parallel to our results (Yoon et al., Reference Yoon, Sheremata, Rokem and Silver2013; Silverstein, Reference Silverstein, Li and Spaulding2016). It has also been shown that schizophrenia and schizoaffective disorder do not demonstrate major distinctions in cognitive deficits (Owoso et al., Reference Owoso, Carter, Gold, MacDonald, Ragland, Silverstein, Strauss and Barch2013). Another limitation is the modest sample size, which limits the reliability of cross-sectional assessments. Additionally, the overall symptom severity in our patient group was relatively low, which could have limited our ability to detect relationships with clinical symptom measures. We should also note that PANSS has some limitations in assessing negative symptoms as it does not include some important aspects of negative symptoms such as anhedonia and avolition (Garcia-Portilla et al., Reference Garcia-Portilla, Garcia-Alvarez, Saiz, Al-Halabi, Bobes-Bascaran, Bascaran, Muñiz and Bobes2015). The generalized deficit confound is another limitation to this study. However, impairments in these three functions are well-established findings in schizophrenia as mentioned above. The inter-correlation pattern of these tasks is preserved in the patient group, and consistent with the suggested neurophysiological mechanisms. Although these would suggest toward more specific deficits, it is difficult to rule out a generalized deficit. Finally, patients participated in the study were using psychotropic medications, as in most studies on psychotic disorders. The effects of psychotropic medications on visual functions assessed in this study are unknown. However, it has been demonstrated that antipsychotic medications change retinal neurotransmitter functions (Bartel et al., Reference Bartel, Blom, Robinson, Van Der Meyden, De Sommers and Becker1990; Perossini and Fornaro, Reference Perossini and Fornaro1990), which would affect early visual functions. Retinal functions have also been shown to be affected by demographic variables such as age and gender (Iuvone et al., Reference Iuvone, Tigges, Fernandes and Tigges1989; Hutchinson et al., Reference Hutchinson, Walker and Davidson2014). Therefore, it is important to note that these factors may have impacted our results.
Although this study tested five different visual functions that were repeatedly shown to be altered in patients with psychosis, visual perceptual changes in psychosis are not limited to these five areas. Other visual functions such as contrast perception, orientation tuning, orientation-specific surround suppression, illusion perception, multisensory integration (Silverstein and Keane, Reference Silverstein and Keane2011b; Yoon et al., Reference Yoon, Sheremata, Rokem and Silver2013; Silverstein, Reference Silverstein, Li and Spaulding2016) should be included in future studies.
Potential clinical implications and future directions
Our results suggest that the evaluation of visual functions using a computerized task battery provides important information about deficits in different neurologic pathways which are correlated with the severity of the disease and schizotypal features in healthy individuals. This supports the accumulated evidence suggesting that some visual perceptual deficits show a continuity on the psychosis spectrum (Chen et al., Reference Chen, Nakayama, Levy, Matthysse and Holzman1999a, Reference Chen, Bidwell and Holzman2005; Kent et al., Reference Kent, Weinstein, Passarelli, Chen and Siever2011; Cappe et al., Reference Cappe, Herzog, Herzig, Brand and Mohr2012; Park and Gooding, Reference Park and Gooding2014; Silverstein, Reference Silverstein, Li and Spaulding2016). The major limitation to many techniques that assess neurobiological aspects of psychotic disorders (such as MRI, EEG, electrophysiologic studies) is their applicability in different clinical settings due to requiring high tech and expensive equipment. Visual assessments are of importance as practical tools that provide quantifiable assessments of some of the neurobiological deficits in psychotic disorders at low cost. However, there are many questions that need to be answered to utilize visual assessments as clinical tools. Some questions that remain open include:
(1) Which visual impairments are most specific to psychotic disorders? What are the shared neurodevelopmental processes and environmental factors that underlie these dysfunctions?
(2) Are visual impairments solely an outcome of shared neurodevelopmental deficits, or do they play a causal role in the development of psychotic symptoms?
(3) To what extent do they interfere with real-world functioning and in which domains?
(4) Do they have value in predicting outcomes related to vulnerability to psychosis, the risk of conversion, prognosis and response to treatment?
(5) Do different biological subtypes of psychosis show differences in visual perceptual functions? Can visual perceptual impairments be used to identify different biological subtypes of the disease?
(6) Can these deficits be treated? What are the effects of visual perceptual training interventions in patients with psychotic disorders and individuals at high risk?
To answer these questions, the relationship between clinical presentations, visual functions, and structural changes should be thoroughly investigated by combining behavioral, imaging, and electrophysiology methods (Butler et al., Reference Butler, Martinez, Foxe, Kim, Zemon, Silipo, Mahoney, Shpaner, Jalbrzikowski and Javitt2007, Reference Butler, Abeles, Silverstein, Dias, Weiskopf, Calderone and Sehatpour2013; Martinez et al., Reference Martinez, Hillyard, Dias, Hagler, Butler, Guilfoyle, Jalbrzikowski, Silipo and Javitt2008; Silverstein et al., Reference Silverstein, Berten, Essex, Kovács, Susmaras and Little2009; Anderson et al., Reference Anderson, Tibber, Schwarzkopf, Shergill, Fernandez-Egea, Rees and Dakin2017).
Conclusion
In summary, results of this study suggest that contour integration, VD, and VSWM tasks are promising candidates as assessment tools for impairments in different neural pathways, and that can be easily applied in almost all clinical settings in less than fifteen minutes. Our results also demonstrated that performances of these tasks are associated with the negative symptom dimension. We believe that future studies testing more comprehensive batteries evaluating visual functions are needed to investigate their discriminative power over DSM diagnoses, their roles in developing neurobiology-based classifications, and their potential as predictive measures or early diagnostic tools in high-risk populations for psychotic disorders.
Supplementary material
The supplementary material for this article can be found at https://doi.org/10.1017/S0033291718002477
Acknowledgements
The authors thank Olivia Schellenberg, Barbara Storch, Melissa Huang, Lushna Mehra, and Jaisal Merchant for their help in recruitment; they and Dr Delaney-Busch were, in part, funded by a grant from the Sidney Baer Foundation supporting the Tufts Undergraduate Clinical Program. The authors thank the CNTRACS Consortium for their permission to use JOVI task stimuli; a copyrighted instrument of Deanna M Barch, Cameron S Carter, James Gold, Angus W. MacDonald III, J. Daniel Ragland, and Steven Silverstein. This work was conducted with support from Harvard Catalyst | The Harvard Clinical and Translational Science Center (National Center for Research Resources and the National Center for Advancing Translational Sciences, National Institutes of Health Award UL1 TR001102). The authors dedicate this paper to the memory of Dr Yue Chen, a pioneer of vision science in psychiatry, who passed away in September 2017.
Funding
This work was supported by the Scientific and Technological Research Council of Turkey (HBT, 2214A; ZP, 2211E) and the National Institute of Mental Health (NIMH) (DO, Grant No. K24MH104449). KEL was supported by Grant No. R21MH110699 and GK was supported by Grant No. R01MH071635 from the NIMH. MB was supported by the National Science Foundation (Grant No. SMA-1513806).
Conflict of interest
None