


The evolution of resistance to herbicides in weeds has become a major problem in agricultural systems that has caused major crop and economic losses to farmers and poses a serious threat to global food security (Pimentel et al. Reference Pimentel, Zuniga and Morrison2005). To date, more than 480 cases of herbicide resistance across a broad range of sites of action have been documented in 252 species worldwide (Heap Reference Heap2017). Resistance evolves in weed populations in response to repeated use of herbicides, which creates a strong selection pressure for the adaptive trait (Délye et al. Reference Délye, Jasieniuk and Le Corre2013; Jasieniuk et al. Reference Jasieniuk, Brule-Babel and Morrison1996; Neve et al. Reference Neve, Vila-Aiub and Roux2009; Powles and Yu Reference Powles and Yu2010). Genetic variation in herbicide susceptibility allows initially rare resistant or less susceptible individuals to survive herbicide treatment and pass selectively advantageous traits to the next generation (Délye et al. Reference Délye, Jasieniuk and Le Corre2013). Over time, the resistance trait increases in frequency in the population and has the potential to spread to other populations through pollen or seed movement (Busi et al. Reference Busi, Yu, Barrett-Lennard and Powles2008).
The annual ryegrasses Italian ryegrass and rigid ryegrass (Lolium perenne ssp. rigidum) are economically significant arable weeds worldwide that have evolved resistance to many herbicides (Heap Reference Heap2017; Preston et al. Reference Preston, Wakelin, Dolman, Bostamam and Boutsalis2009). The propensity of ryegrasses to evolve herbicide resistance has been attributed to high genetic variation within populations resulting from large population sizes and obligate outcrossing (Balfourier et al. Reference Balfourier, Charmet and Ravel1998; Busi and Powles Reference Busi and Powles2009). Because of these characteristics, multiple different alleles conferring resistance to one or more herbicides may exist within a population and among populations in an agricultural region (Karn and Jasieniuk Reference Karn and Jasieniuk2017; Neve and Powles Reference Neve and Powles2005). Thus, it is important to examine resistance in many individuals per population and in multiple populations across an agricultural landscape in species with such heterogeneity.
Worldwide, populations of annual ryegrasses have been confirmed resistant to herbicides with 13 different sites of action, including glyphosate, acetolactate synthase inhibitors, and acetyl-CoA carboxylase inhibitors (Délye et al. Reference Délye, Boucansaud, Pernin and Le Corre2009; Gaines et al. Reference Gaines, Lorentz, Figge, Hermann, Maiwald, Ott, Han, Busi, Yu, Powles and Beffa2014; Heap Reference Heap2017). Recently, resistance to glufosinate was identified in Italian ryegrass from Oregon (Avila-Garcia and Mallory-Smith Reference Avila-Garcia and Mallory-Smith2011; Avila-Garcia et al. Reference Avila-Garcia, Sanchez-Olguin, Hulting and Mallory-Smith2012). This was the first case of glufosinate-resistant ryegrass in the world. Resistance to glufosinate has since been reported in Italian ryegrass populations from New Zealand (Ghanizadeh et al. Reference Ghanizadeh, Harrington and James2015) and Japan (Kurata et al. Reference Kurata, Ichihara, Ishida, Shimono and Tominaga2017).
In California, resistance to glyphosate in annual ryegrass was first identified in 1998 (Simarmata et al. Reference Simarmata, Kaufmann and Penner2003), and has since become widespread in perennial cropping systems of the Central Valley (Jasieniuk et al. Reference Jasieniuk, Ahmad, Sherwood, Firestone, Perez-Jones, Lanini, Mallory-Smith and Stednick2008). In 2013, an Italian ryegrass population suspected of containing individuals resistant to both glyphosate and glufosinate was identified in a vineyard in northwest California, west of the Central Valley, after 2 yr of failed control with glyphosate followed by failed control with glufosinate.
The overall goal of this study was to examine variation in population response and resistance to glyphosate and glufosinate in Italian ryegrass from northwest California. To accomplish this goal, we cloned (i.e., vegetatively multiplied) plants from multiple populations and treated separate clones of a genotype with glufosinate, glyphosate, or water to assess the frequency of plants surviving each herbicide and to determine whether resistance to the two herbicides may be conferred by a common underlying mechanism (cross-resistance) or by distinct mechanisms (multiple resistance). The efficacy of glyphosate and glufosinate at three different screening times was compared, and population-scale dose–response experiments were conducted, to determine the level of resistance to glyphosate and glufosinate in a subset of the populations sampled.
Materials and Methods
Population Sampling
Italian ryegrass populations from orchards and vineyards in Sonoma and Lake Counties in northwest California were sampled for seed in 2013 (Table 1). Sampling sites were selected while driving through the area and identifying orchards and vineyards containing ryegrass at a stage at which plants had both green leaves and mature seed. For comparison, a single population (Population 1) from Butte County was sampled from the area where glyphosate resistance was previously characterized (Jasieniuk et al. Reference Jasieniuk, Ahmad, Sherwood, Firestone, Perez-Jones, Lanini, Mallory-Smith and Stednick2008), confirmed as containing resistant plants, and used as a glyphosate-resistant reference population. Mature panicles were collected from 30 to 40 randomly selected individuals in each population. Seeds of each individual were stored separately in paper envelopes at 20 C for 3 mo to overcome dormancy before testing for resistance (Karn and Jasieniuk Reference Karn and Jasieniuk2017). Because an entirely herbicide-susceptible ryegrass population could not be identified in the area, the susceptible reference (Population S) consisted of seeds from a previously characterized susceptible population that was sampled from a northern California wheat field in 2005 (Jasieniuk et al. Reference Jasieniuk, Ahmad, Sherwood, Firestone, Perez-Jones, Lanini, Mallory-Smith and Stednick2008).
Table 1 Italian ryegrass populations sampled in California and the numbers of plants tested for resistance at each screening time.
a Population 1 is used as a glyphosate-resistant reference population.
Population Resistance Screening
Eight seeds from each of the 30 to 40 plants sampled in each population in 2013 were germinated on moistened filter paper in petri dishes at 20 C and a 12-h photoperiod with light intensity of 160 µmol m−2s−1. Germinated seedlings were transplanted into 8 by 8 cm square pots (2 seedlings pot−1) filled with University of California soil mix (1 part sand, 1 part compost, 1 part peat, 1.8 kg/m3 dolomite), grown in a greenhouse set to 25/15 ± 3 C day/night temperature with ambient light conditions, and watered and fertilized as needed. Locations of pots were randomized in the greenhouse at the time of transplanting and following herbicide treatment to account for random effects that may result from environmental differences among locations inside the greenhouse. Average daily humidity varied from 25/67% to 35/75% day/night relative humidity. At the tillering stage, individual plants were divided into three genetically identical clones, each consisting of one tiller with 2.5 cm of root and 2.5 cm of shoot, following the method described by Boutsalis (Reference Boutsalis2001). Clones were grown in the greenhouse, at the conditions described above, to the 2- to 3-leaf stage at 7.6- to 12.7-cm tall. Then, each clone of a genotype was treated with one of three treatments: (1) water, which served as a control, (2) glyphosate (Roundup PowerMax®, Monsanto, St Louis, MO) at 1,678 g ae ha−1, or (3) glufosinate (Rely® 280, Bayer CropScience, Research Triangle Park, NC) at 2,242 g ai ha−1 plus ammonium sulfate at 3,362.55 g ha−1, so that each genotype could be tested for resistance to each herbicide. The labeled (1X) field rates for annual ryegrass control by glyphosate and glufosinate are 867 g ae ha−1 and 1,147 g ai ha−1, respectively. The actual treated rates correspond to 1.94X and 1.95X the labeled rates for glyphosate and glufosinate, respectively. All treatments were applied with an enclosed cabinet track sprayer equipped with a TeeJet® 8002E nozzle (Spraying Systems, Wheaton, IL) delivering 200 L ha−1. Two or three susceptible plants from the susceptible reference Population S were included during each herbicide application to verify that the herbicide treatment was effective. All treatments were applied between the hours of 10:00 AM and 2:00 PM to minimize time of day effects. Plants from each population were tested for resistance at three different time periods: (1) November to December in 2013, (2) March to April in 2014, and (3) February to March in 2015. Between 55 and 212 individuals from each population were tested for herbicide response at each screening time (Table 1) in a randomized block design. The number of plants tested at each screening time depended on the number of seedlings available at each time period. At 3 wk after herbicide treatment, plants were scored as alive or dead.
Population Dose Response
Population dose–response experiments were conducted in September 2014 and January 2016 using a subset of populations (Populations 8, 11, and 13 in Table 1). These populations were selected because they represented a range of frequencies of plants surviving herbicide treatment from very low (Population 8) to high (Population 13) in the population resistance screening, as well as representing the geographical range across Sonoma and Lake counties. The susceptible reference population (Population S) was also included in each dose–response experiment. Seeds from each population were germinated on moistened filter paper in petri dishes at 20 C with a 12-h photoperiod. Germinated seedlings were transplanted into pots as previously described and grown in the greenhouses. The September 2014 experimental conditions ranged from 26/17 to 30/17 C with 25/75% to 38/75% relative humidity and natural light conditions of an approximately 12-h photoperiod. The January 2016 experiment was performed at 22/12 C with 55/89% relative humidity, with natural light conditions of an approximately 10-h photoperiod. In both experiments, 2- to 3-leaf seedlings that were between 7.6- and 12.7-cm tall were treated with a range of 10 doses of glyphosate from 0 to 13,872 g ha−1, corresponding to 0X to 16X the labeled field rate of 867 g ae ha−1, or with a range of 10 doses of glufosinate from 0 to 18,352 g ha−1, corresponding to 0X to 16X the labeled field rate of 1,147 g ha−1. All applications were made using the track sprayer and methods described earlier with commercial formulations, such that the applications consisted of varying concentrations of the active ingredient and other components in the same amount of spray volume, except for the highest rate of glufosinate, which was applied at a higher spray volume of 400 L ha−1 because of its high viscosity. Each experiment was conducted using a randomized block design, with each block consisting of 30 or 32 replicate plants of each population at each rate.
At 3 wk after treatment, all plants were assessed for survival, cut at the soil surface, dried in an oven at 60 C for 7 d, and then measured for dry weight. Following the removal of aboveground biomass, pots were kept in the greenhouse for an additional 7 d, and plants were visually scored for regrowth. Any plant that had green tissue extending above the cut surface was scored as having regrowth. Preliminary studies showed that nearly all plants that regrew did so within 7 d (unpublished data), whereas plants that had not shown regrowth by 7 d did not regrow and caused pest problems in the greenhouse. All dose–response data (plant biomass, survival, and regrowth) were analyzed using the ‘drc’ (dose–response curve) package in R v. 3.1.3 (R Core Team 2013) by fitting log-logistic regression models to the data, as described by Knezevic et al. (Reference Knezevic, Streibig and Ritz2007). A four-parameter model for continuous data was fit to dry biomass, and a two-parameter model for binomial data was fit to plant survival and plant regrowth. The herbicide dose required to kill 50% of the population (LD50) was estimated from plant survival data, and the dose required to reduce average plant aboveground biomass by 50% (GR50) was estimated from plant biomass data. The dose required to prevent regrowth of 50% of the population (RD50) was estimated from regrowth data. Two resistance indices (R/S ratios) were calculated. R/S1 was defined as the estimated LD50 or GR50 of a population divided by the estimate corresponding to the susceptible reference population. R/S2 was defined as the estimated LD50, GR50, and RD50 of a population divided by the estimate corresponding to the population with the lowest estimate for that parameter.
Results and Discussion
Populations Sampled
Fourteen Italian ryegrass populations were sampled for seeds in 2013 (Table 1). Population 1 was sampled from a Central Valley orchard in the area where glyphosate resistance was previously characterized (Jasieniuk et al. Reference Jasieniuk, Ahmad, Sherwood, Firestone, Perez-Jones, Lanini, Mallory-Smith and Stednick2008) and served as the glyphosate-resistant reference population in the study. Nine populations (Populations 2 through 4 and 6 through 11) were sampled from Sonoma County vineyards in the region where growers reported plants becoming increasingly difficult to control with both glyphosate and glufosinate. Four populations (Populations 12 through 15) were sampled from a vineyard and three pear (Pyrus communis L.) orchards in Lake County where populations were reported as becoming increasingly difficult to control with glyphosate. Glufosinate was not registered for use in pears in California at the time of the study, but the proximity to nearby vineyards could have resulted in the spread of resistance genes via pollen and/or seed dispersal to these populations.
Population Variation in Herbicide Response
All susceptible reference plants were killed by both glyphosate and glufosinate at all three screening times. In contrast, all populations sampled in 2013 had some survivors following herbicide treatment during at least one screening time period. However, the frequencies of plants surviving treatment with glyphosate and glufosinate varied both across screening times and geographical locations (Figure 1). The percentage of plants that survived treatment with glyphosate at 1,678 g ae ha−1 ranged from 9.7% to 89.0% among populations in the November to December 2013 screening period, 3.0% to 90.7% in March to April 2014, and 10.5% to 92.0% in February to March 2015 (Figure 1A). The glyphosate-resistant reference population (Population 1) had a consistently high frequency (>70%) of glyphosate-resistant individuals at all screening times. The Sonoma County populations 2 through 11 displayed a gradient of plant survival from a low percentage of surviving individuals in the southern end to moderate survival in the northern end of the county (Table 1; Figure 1A). In contrast, Lake County populations 12 to 14 near Kelseyville, where glyphosate resistance was first suspected in the county, had uniformly high (>55%) frequencies of surviving plants. Population 15 from outside the Kelseyville area had a low frequency (<27%) of survivors.
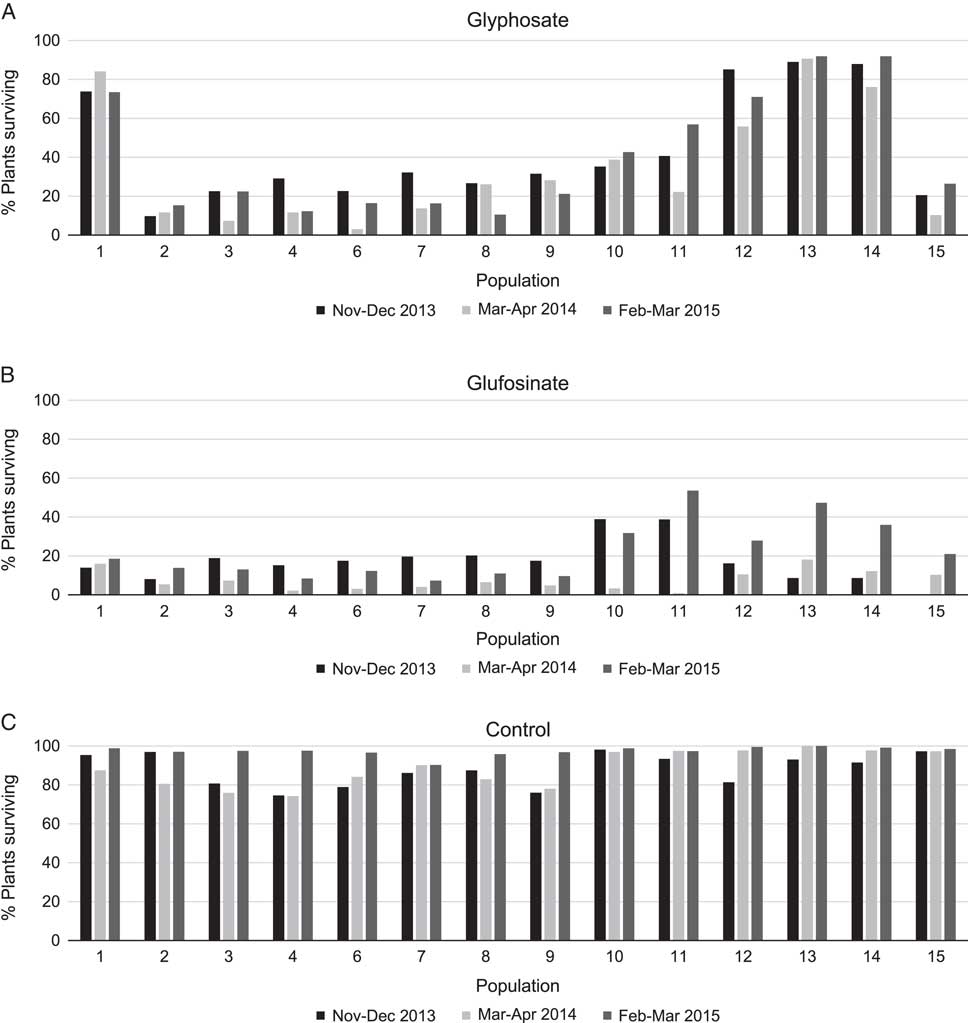
Figure 1 Percentage of plants surviving 3 wk after treatment with glyphosate at a rate of 1,678 g ae ha−1 (A), glufosinate at a rate of 2,242 g ai ha−1 (B), or water control (C) for three screening times. Locations of populations and numbers of plants tested at each screening time are listed in Table 1.
The differences in plant survival within a population from one screening time to another were much more pronounced in response to treatment with glufosinate compared with glyphosate. Plant survival following glufosinate treatment at 2,242 g ai ha−1 varied among populations and screening times, ranging from 0.0% to 38.9% in November to December 2013, 0.0% to 18.0% in March to April 2014, and 7.3% to 53.5% in February to March 2015 (Figure 1B). The percentage of plants from Sonoma County Population 11 that survived glufosinate treatment was high (53.5%) in February to March 2015 but very low (0.8%) in March to April 2014 (Figure 1B). Population 10, also from Sonoma County, similarly exhibited a large difference in plant survival between screening periods from a high of 32.9% in November to December 2013 to a low of 3.2% in March to April 2014. Despite the large differences in plant survival among screening times in these populations, the large number of individuals surviving glufosinate at some time periods is perhaps a consequence of the recent implementation of resistance management practices that use glufosinate to control glyphosate-resistant weeds, resulting in increased glufosinate use across the region. Many populations (Populations 1 through 9 and Population 15) had a low percentage of plants (<20%) surviving glufosinate at all screening times (Figure 1B). Because glufosinate is not as easily translocated through the plant as glyphosate (Steckel et al. Reference Steckel, Hart and Wax1997), low percentages of survivors in these populations may not necessarily indicate evolved glufosinate resistance. However, the higher frequency of survivors observed in Populations 10 through 14 suggests that resistance to glufosinate is evolving in those populations.
Variability in weed response to glyphosate and glufosinate treatment has been observed in previous studies (Ge et al. Reference Ge, d’Avignon, Ackerman, Duncan, Spaur and Sammons2011; Pline et al. Reference Pline, Wu and Hatzios1999; Sellers et al. Reference Sellers, Smeda and Li2003; Waltz et al. Reference Waltz, Martin, Roeth and Lindquist2004 ). For instance, temporal variation in the efficacy of glyphosate in controlling hairy fleabane [Conyza bonariensis (L.) Cronq.] and horseweed [Conyza canadensis (L.) Cronq.] has been observed and suggested to be related to seasonal changes in temperature, light intensity, and/or day length (Ge et al. Reference Ge, d’Avignon, Ackerman, Duncan, Spaur and Sammons2011; Moretti et al. Reference Moretti, Hanson, Hembree and Shrestha2013). In this study, temperature was controlled in the experimental greenhouses to the extent possible. However, studies in more highly environmentally controlled plant growth facilities are needed to confidently rule out the role of temperature in plant response to the herbicides. Light conditions may also have affected the response of Italian ryegrass plants to herbicide treatment, because plants were grown under natural light in the greenhouse. Differences in light intensity, light quality, and/or day length among screening times may have led to differences in plant photosynthetic rates, which can alter the efficacy of herbicide treatments, as was observed in velvetleaf (Abutilon theophrasti Medik.) response to glufosinate (Sellers et al. Reference Sellers, Smeda and Li2003). In a study of wild radish (Raphanus raphanistrum L.), glufosinate efficacy was not influenced by light intensity under low temperatures, but was enhanced under low light at high temperatures (Kumaratilake and Preston Reference Kumaratilake and Preston2005), indicating that the impact of light may be confounded by other environmental variables. High humidity at the time of herbicide treatment has also been shown to increase the efficacy of both glyphosate and glufosinate (Coetzer et al. Reference Coetzer, Al-Khatib and Loughlin2001; Ramsay et al. Reference Ramsay, Stephenson and Hall2002; Sharma and Singh Reference Sharma and Singh2001). However, this is unlikely to be a major factor in this study, because humidity was similar in March to April 2014 and February to March 2015 (75/35% relative humidity), while herbicide response varied widely (Figure 1). The large numbers of clones from each population tested at each screening time (Table 1) suggest that the variation in plant survival observed among screening times was likely not due to stochastic effects resulting from small sample sizes of this genetically diverse outcrossing species.
It has been hypothesized that a single non–target site based mechanism may affect translocation of both glyphosate and glufosinate and confer resistance in Italian ryegrass populations from Oregon (Avila-Garcia and Mallory-Smith Reference Avila-Garcia and Mallory-Smith2011). This does not appear to be the case in the California populations of Italian ryegrass examined in this study. Treatment of clones of individual plants (i.e., distinct genotypes) with glyphosate and glufosinate revealed that some individuals in a population were only resistant to glyphosate or glufosinate, while others were resistant to both herbicides (Table 2). For example, based on the responses of clones of individual plants from Population 10, 15% of the individuals were resistant to glyphosate but not resistant to glufosinate, 18% were resistant to glufosinate but not glyphosate, while 21% were resistant to both glyphosate and glufosinate and 46% were susceptible to both herbicides (Table 2). A similar pattern was observed for Population 11. The presence of all four possible phenotypic classes, which was revealed by cloning individual genotypes, indicates multiple resistance rather than cross-resistance and suggests that the mechanism conferring resistance to glyphosate differs from the mechanism conferring resistance to glufosinate in these populations. However, it is also possible that more than one mechanism may be responsible for resistance to either herbicide in different populations or that some other general mechanism (e.g., general stress response, increased metabolism, reduced herbicide uptake) may impact resistance to both herbicides.
Table 2 Percentage of cloned plants from Populations 10 and 11 that survived treatment with herbicide in the November to December 2013 population screening.
Population-Average Level of Resistance
The dose–response assays for glyphosate and glufosinate were conducted in September 2014 and January 2016. At each screening time, there was no difference between blocks or difference in homogeneity of variance between herbicide doses for each population; data from the two blocks were therefore combined for analysis. For glyphosate and glufosinate, aboveground biomass, plant survival, and regrowth of individuals in all populations decreased with increasing herbicide dose (Figures 2 and 3). For glyphosate, populations clearly differed in plant response among the three variables and across screening time periods (Figure 2). Plants from Population 13 were less affected by herbicide application than plants from the susceptible standard population (Population S) and the two other populations (Populations 8 and 11) tested and required a higher rate of glyphosate for substantial reductions in biomass, survival, and regrowth. For glufosinate, the differences in dose response among populations for all three variables were far less pronounced (Figure 3). The proportion of plants surviving treatment with glufosinate was higher for Population 13 than the remaining populations at both screening times, and the proportion of plants with regrowth was higher in this population in 2014, but differences were small. Plant response in terms of the remaining variables did not differ much among populations. The results point to a low frequency of resistance and early stage of evolution of resistance to glufosinate.
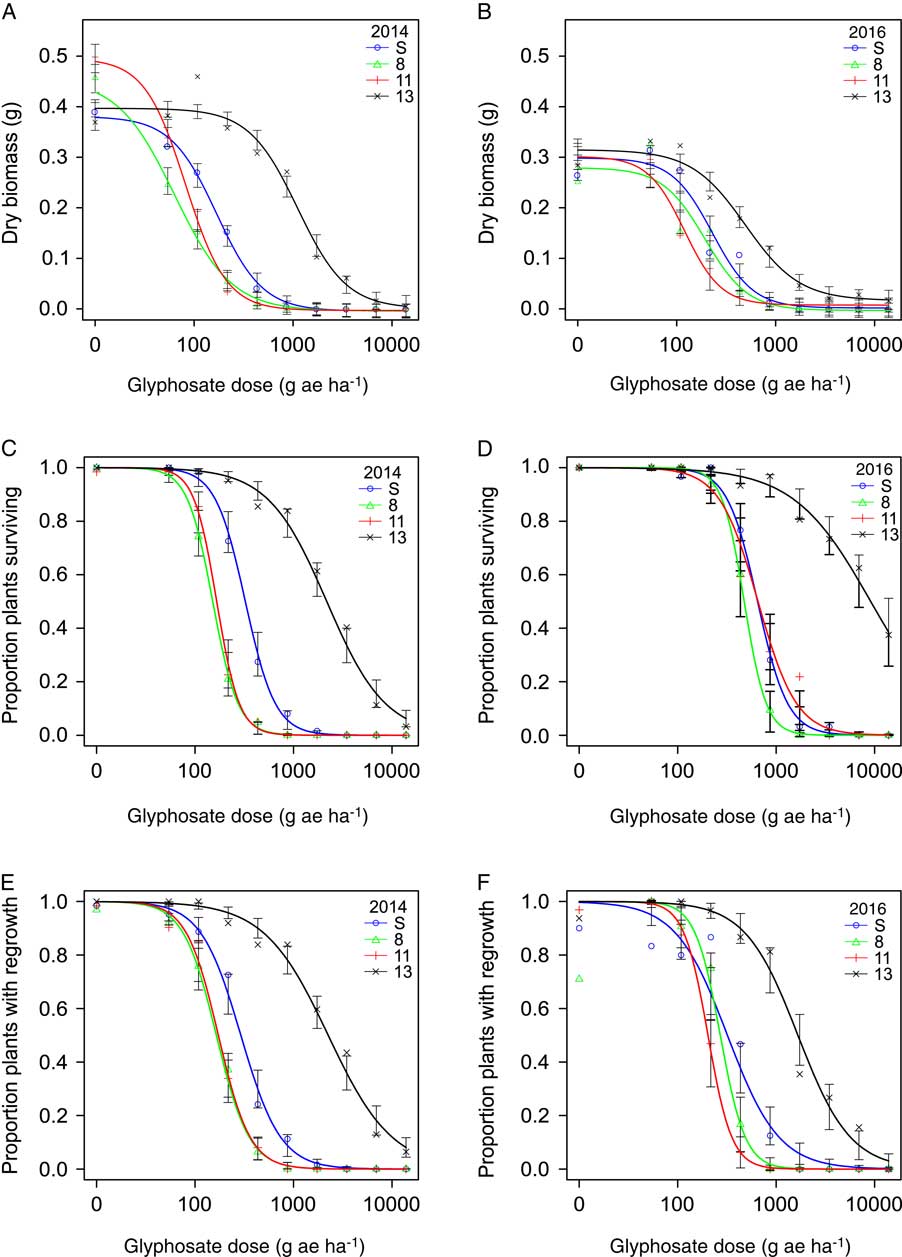
Figure 2 Nonlinear regression of plant response 3 wk after treatment with glyphosate measured in dry biomass in 2014 (A) and 2016 (B), plant survival in 2014 (C) and 2016 (D), and regrowth 1 wk after biomass harvest in 2014 (E) and 2016 (F) of the susceptible reference (Population S) and Populations 8, 11, and 13. Symbols represent the mean measurement for a population at each rate (n = 30 or 32). Bars indicate the SE for the parameter estimate at each rate. Regression parameters are shown in Table 3.
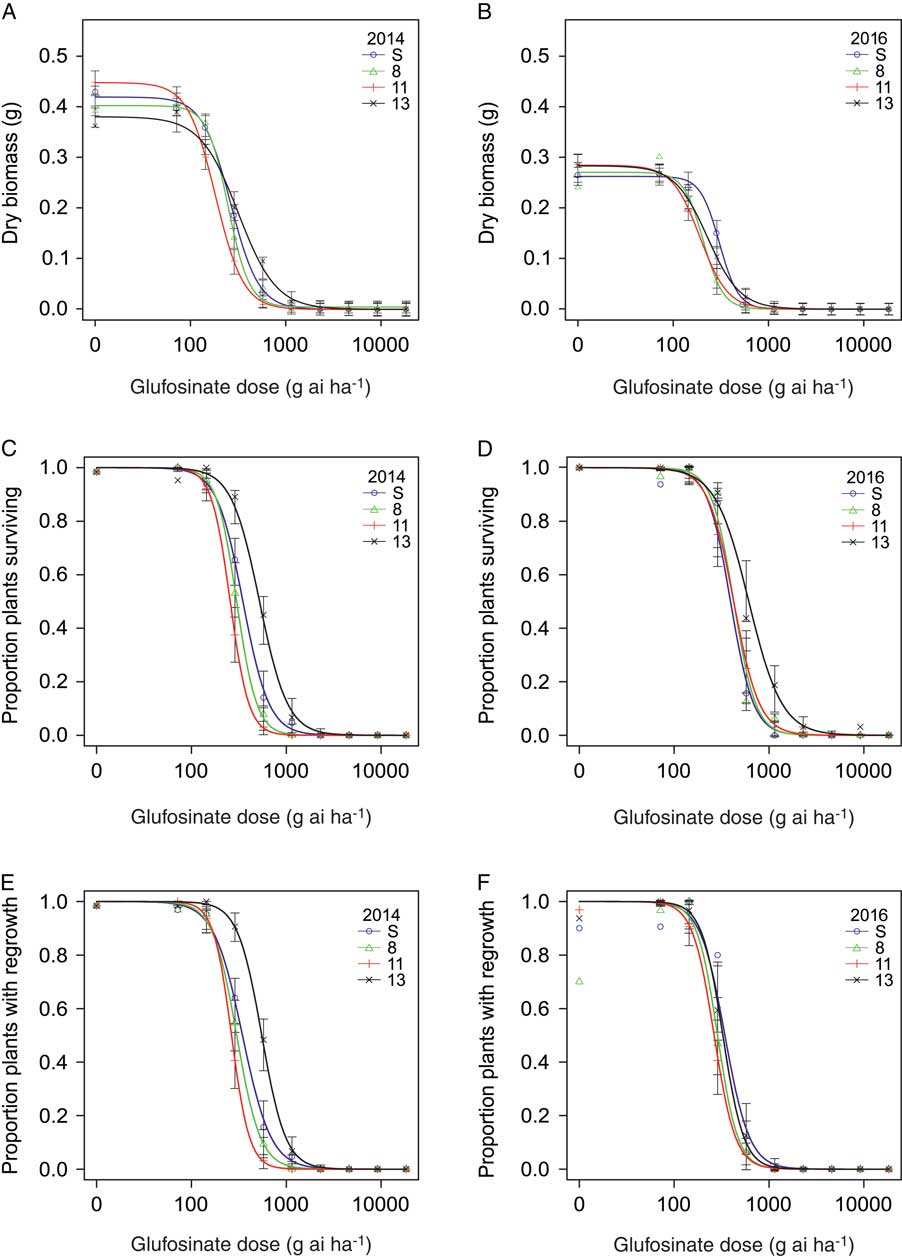
Figure 3 Nonlinear regression of plant response 3 wk after treatment with glufosinate measured in dry biomass in 2014 (A) and 2016 (B), plant survival in 2014 (C) and 2016 (D), and regrowth 1 wk after biomass harvest in 2014 (E) and 2016 (F) of the susceptible reference (Population S) and Populations 8, 11, and 13. Symbols represent the mean measurement for a population at each rate (n = 30 or 32). Bars indicate the SE for the parameter estimate at each rate. Regression parameters are shown in Table 4.
Selectivity indices (R/S ratios) calculated from the dose–response assays indicate low to moderate levels of resistance. Two selectivity indices were calculated for each plant response variable, because some tested populations showed lower GR50, LD50, or RD50 values than the susceptible standard (Population S). R/S1 was calculated using the susceptible standard; R/S2 was calculated using the most susceptible population for each response variable. For glyphosate, Population 13 exhibited a significantly higher level of resistance than the other populations tested (Table 3). R/S1 values ranged from 2.2 to 14.1, while R/S2 values ranged from 4.1 to 19.2, depending on the year and the variable measured. With the exception of the GR50 estimates based on biomass measurements in 2016, all estimates of LD50, GR50, and RD50 for Population 13 were substantially higher than the label rate of 867 g ae ha−1 (Table 3), indicating resistance at a level relevant to growers. However, contrary to the response observed for Population 11 in the population resistance screening, the population dose–response assay showed that Population 11 was not resistant to glyphosate at either screening time (Table 3). Population 11 was more variable in its response to glyphosate among screening times than Population 13 in the population resistance screening study (Figure 1), which may also have contributed to the differences observed between the populations in the dose–response assay. The levels of glyphosate resistance detected in Italian ryegrass populations from northwest California are comparable with glyphosate-resistant populations from other areas. R/S values ranged from 2.4 to 15.3 for populations shown to have target-site resistance in the Central Valley of California (Jasieniuk et al. Reference Jasieniuk, Ahmad, Sherwood, Firestone, Perez-Jones, Lanini, Mallory-Smith and Stednick2008). On the basis of GR50 values, an Italian ryegrass population from Oregon with non–target site based resistance was 5-fold more resistant to glyphosate than a known susceptible population (Perez-Jones et al. Reference Perez-Jones, Park, Polge, Colquhoun and Mallory-Smith2007). Italian ryegrass populations with EPSPS gene amplification from Arkansas had R/S values, based on GR50 estimates, ranging from 7- to 13-fold more resistant than susceptible populations (Salas et al. Reference Salas, Dayan, Pan, Watson, Dickson, Scott and Burgos2012). Outside the United States, glyphosate-resistant rigid ryegrass populations from Italy with a vacuolar sequestration mechanism of resistance had LD50 values ranging from 1,700 to 2,200 g ae ha−1, while Italian ryegrass populations from Brazil and Chile with the same mechanism of resistance had LD50 values of 2,700 and 1,300 g ae ha−1, respectively (Ge et al. Reference Ge, d’Avignon, Ackerman, Collavo, Sattin, Ostrander, Hall and Sammons2012). In Australia, estimates of R/S ratios for four rigid ryegrass populations with altered translocation of glyphosate ranged from 4 to 11 on the basis of LD50 values (Powles et al. Reference Powles, Lorraine-Colwill, Dellow and Preston1998; Wakelin et al. Reference Wakelin, Lorraine-Colwill and Preston2004).
Table 3 Parameter estimates and associated model statistics for log-logistic dose–response curves of plant biomass, survival, and regrowth following treatment with glyphosate.Footnote a
a For the parameters estimated, C is the lower limit of plant response, D is the upper limit of plant response, and b is the slope of the regression equation around the LD50, GR50, or RD50 values. R/S1 is a population’s LD50, GR50, or RD50 divided by the value of the same parameter estimated for the reference susceptible population (Population S). R/S2 is a population’s LD50, GR50, or RD50 divided by the value of the same parameter estimated for the most susceptible population tested. Values in parentheses are ± 1 SE. Different lowercase letters indicate statistically different parameter values among populations, as determined by a Fisher’s LSD test.
The dose–response experiments conducted to assess the level of glufosinate resistance in populations from northwest California were inconclusive (Table 4; Figure 3A–F). In the 2014 experiment, Population 13 had higher survival and biomass than the susceptible reference Population S (Table 4; Figure 3). Despite a 2-fold increase in LD50 compared with the most susceptible population, the LD50 of Population 13 (552.0 g ha−1) was still below the labeled rate for control of pre-tiller grasses in tree, vine, and berry crops of 1,147 g ha−1. On a population level, this is not a strong indicator of resistance, although 7% of individuals (5 plants) did survive the label rate. Based on GR50 values, the R/S ratios are slightly lower than those previously reported for populations of Italian ryegrass. R/S ratios ranged from 1.9 to 3.2 among Italian ryegrass populations from Oregon with non–target site based resistance to glufosinate (Avila-Garcia and Mallory-Smith Reference Avila-Garcia and Mallory-Smith2011), whereas the R/S ratio was 2.8 for a population with target site–based resistance (Avila-Garcia et al. Reference Avila-Garcia, Sanchez-Olguin, Hulting and Mallory-Smith2012). In goosegrass [Eleusine indica (L.) Gaertn.], the only other weed species to be identified with glufosinate resistance to date, a population in Malaysia resistant to glufosinate had an R/S ratio of 3.4 to 3.6 based on GR50 values (Seng et al. Reference Seng, Lun, San and Sahid2010). In the populations of Italian ryegrass studied here, glufosinate resistance appears to be in an early stage of evolution. Thus, the alleles conferring increased plant survival to glufosinate may currently be rare and segregating in populations of this obligate outcrossing species , and population-level estimates of resistance using dose–response experiments will not indicate resistance. However, continued use of glufosinate on Italian ryegrass populations in vineyards and orchards will likely increase the frequency of resistant or less sensitive individuals. Population-scale dose–response assays are limited in their ability to identify resistance in populations at the early stages of resistance evolution, especially in highly diverse outcrossing weeds like ryegrass.
Table 4 Parameter estimates and associated model statistics for log-logistic dose–response curves of plant biomass, survival, and regrowth following treatment with glufosinate.Footnote a
a For the parameters estimated, C is the lower limit of plant response, D is the upper limit of plant response, and b is the slope of the regression equation around the LD50, GR50, or RD50 values. R/S1 is a population’s LD50, GR50, or RD50 divided by the value of the same parameter estimated for the reference susceptible population. R/S2 is a population’s LD50, GR50, or RD50 divided by the value of the same parameter estimated for the most susceptible population tested. Values in parentheses are ± 1 SE. Different lowercase letters indicate statistically different parameter values among populations as determined by a Fisher LSD test.
Overall, our results indicate that resistance to glyphosate is present in Italian ryegrass populations in northwest California and that resistance to glufosinate appears to be evolving. The response of Italian ryegrass populations to these herbicides is variable, especially in the case of glufosinate. The greater variability in response to glufosinate than to glyphosate in Italian ryegrass may relate to differences in the physiology of how each herbicide acts within the plant and the specific mechanisms that allow plants to survive treatments of each herbicide. Very few cases of glufosinate resistance have been identified in weeds to date, and the physiological and genetic mechanisms that underlie resistance are currently poorly understood (Avila-Garcia and Mallory-Smith Reference Avila-Garcia and Mallory-Smith2011; Avila-Garcia et al. Reference Avila-Garcia, Sanchez-Olguin, Hulting and Mallory-Smith2012; Jalaludin et al. Reference Jalaludin, Ngim, Baki and Zazali2010, Reference Jalaludin, Yu and Powles2015, Reference Jalaludin, Yu, Zoellner, Beffa and Powles2017; Seng et al. Reference Seng, Lun, San and Sahid2010). Based on our results, populations with multiple resistance to glyphosate and glufosinate are at an early stage of evolution, as the frequency of plants surviving glufosinate treatment at the labeled rate is low in populations, but frequencies are likely to increase with continued herbicide applications if no resistance management strategies are implemented.
The evolution of populations with multiple resistance to glyphosate and glufosinate is problematic from a management perspective. Glyphosate and glufosinate are both important nonselective herbicides for vineyard and orchard systems, and the evolution of resistance limits the available options for chemical weed control. Since the introduction of glyphosate-tolerant annual crops in 1995, the number of weeds evolving resistance to glyphosate has increased dramatically (Powles Reference Powles2008). Similarly, glufosinate-resistant weeds may become more abundant in glufosinate-tolerant crops as these crops become more prevalent in agricultural systems. The variability in response of plants to glufosinate may be especially problematic, as the increase in survival may not appear uniformly over time, thus making resistance monitoring difficult. Development of alternative weed management strategies incorporating herbicides with different sites of action and nonchemical methods for control of weeds is necessary for the management of multiply resistant Italian ryegrass in both perennial and annual cropping systems.
Acknowledgments
We are grateful to Marcelo Moretti, Courtney Nichols, Katy Mulligan, Carlos Marochio, Vince Harjono, Aaron Kwong, Oliver Chen, and Domonique Lewis for assistance with field collections and greenhouse work. We thank John Roncoroni for bringing the study system to our attention and for help in locating sampling sites. We thank Brad Hanson for herbicide screening advice and for helpful comments on the paper. This work was funded by Bayer CropScience AG and USDA-NIFA-AFRI Award No. 2015-67013-22949.


