


Introduction
Species are fundamental units in biology. Accurate assessment of species-level diversity is essential to systematic research, and also for conservation risk-assessment of threatened species before they become extinct. De Queiroz (Reference De Queiroz2007) argues that the only necessary property of a species is to be a separately evolving metapopulation lineage, although he indicated different criteria to support the existence of a species (e.g. morpho-species and phylogentic species). In lichen-forming fungi, phenotypic criteria have traditionally been used to define species (e.g. different reproductive modes). However, this definition of species may be misleading when diagnostic characters are subject to phenotypic plasticity or mask the presence of distinct species within the same morphological form.
In the last decade, the use of molecular data has revolutionized the delimitation of species in the Parmeliaceae and of lichenized fungi in general (Grube & Kroken Reference Grube and Kroken2000; Taylor et al. Reference Taylor, Jacobson, Kroken, Kasuga, Geiser, Hibbett and Fisher2000; Kroken & Taylor Reference Kroken and Taylor2001; Molina et al. Reference Molina, Crespo, Blanco, Lumbsch and Hawksworth2004; Divakar et al. Reference Divakar and Upreti2005a, Reference Divakar, Figueras, Hladun and Crespo2010a; Argüello et al. Reference Argüello, Del-Prado, Cubas and Crespo2007; Crespo & Pérez-Ortega Reference Crespo and Pérez-Ortega2009; Elix et al. Reference Elix, Corush and Lumbsch2009; Wedin et al. Reference Wedin, Westberg, Crewe, Tehler and Purvis2009; Crespo & Lumbsch Reference Crespo and Lumbsch2010). These studies have demonstrated that morphology-based species concepts often underestimate diversity in lichen-forming fungi, hiding distinct phylogenetic lineages under a single species name. In some species complexes, re-examination of morphology has revealed previously overlooked morphological and/or chemical characters that support the recognition of these species-level lineages (Molina et al. Reference Molina, Crespo, Blanco, Lumbsch and Hawksworth2004; Divakar et al. Reference Divakar and Upreti2005a, Reference Divakar, Figueras, Hladun and Crespo2010a; Argüello et al. Reference Argüello, Del-Prado, Cubas and Crespo2007). However, in other complexes, no morphological features have been identified characterizing the phylogenetically distinct lineages (e.g. the case of Parmelia saxatilis, P. sulcata and Parmotrema reticulatum; Molina et al. Reference Molina, Crespo, Blanco, Lumbsch and Hawksworth2004, Reference Molina, Del-Prado, Divakar, Sánchez-Mata and Crespo2011; Divakar et al. Reference Divakar and Upreti2005b). These lineages have been recognized as cryptic species. Cryptic species appear to be common in the Parmeliaceae, with up to 80 cryptic lineages counted recently in the phylogenetic revision of parmelioid lichens by Divakar et al. (Reference Divakar, Cubas, Blanco, Del-Prado, Núñez-Zapata, Roca-Valiente, Lumbsch and Crespo2010b).
The Parmotrema reticulatum – P. pseudoreticulatum complex includes several species that remain taxonomically controversial. Parmotrema reticulatum was described by Taylor (Reference Taylor and Mackay1836; sub Parmelia reticulata) from Kerry, Ireland. The species is characterized by a foliose thallus, a minutely reticulate-maculate and sorediate upper surface, a black lower surface, simple to branched rhizines and the presence of atranorin and salazinic acid (Elix Reference Elix1994b; Divakar & Upreti Reference Divakar and Upreti2005). It grows in a wide range of ecological environments, more frequently as an epiphyte, and normally reproduces asexually from sorediate diaspores. It is widely distributed and is one of the most common taxa in tropical and subtropical regions. Parmotrema clavuliferum was segregated from P. reticulatum (as Parmelia clavulifera Räsänen; Räsänen Reference Räsänen1944) based on the capitate soralia on short laciniae and a black mottled white lower surface, especially below the sorediate lobules; it occurs sympatrically with P. reticulatum.
Another species, Parmotrema pseudoreticulatum also differs from P. reticulatum with respect to subtle morphological characters such as leathery thallus, marginal labriform soralia, lower surface with a bare, dark brown marginal rim and sparse marginal cilia (Tavares Reference Tavares1945). It grows mainly on Quercus and Olea tree trunks in oceanic coastal regions of Portugal, Morocco and Spain (Tavares Reference Tavares1945; Hale & DePriest Reference Hale and DePriest1999). The species is considered as a synonym of P. reticulatum by several authors (Krog & Swinscow Reference Krog and Swinscow1981; Clauzade & Roux Reference Clauzade and Roux1986; Llimona & Hladun Reference Llimona and Hladun2001) but this synonymy is not universally accepted (Hale & Fletcher Reference Hale and Fletcher1990; Hale & DePriest Reference Hale and DePriest1999).
Parmotrema clavuliferum is accepted as an independent species by some authors (Kurokawa Reference Kurokawa1991, Reference Kurokawa2003; Moon et al. Reference Moon, Kurokawa, Kashiwadani and K.2000, Reference Moon, Kurokawa and Kashiwadani2001), while others have considered it a synonym under P. reticulatum, providing evidence of intermediate forms (Hale & Fletcher Reference Hale and Fletcher1990; Hale & DePriest Reference Hale and DePriest1999; Elix Reference Elix1994a; Divakar & Upreti Reference Divakar and Upreti2005). Divakar et al. (Reference Divakar and Upreti2005b) studied the P. reticulatum complex using a molecular phylogenetic approach. Their results supported the synonymy of P. clavuliferum within P. reticulatum but resurrected P. pseudoreticulatum, extending its distribution to South Africa. This study also detected diverse well-supported clades within P. reticulatum s. lat., suggesting the presence of undetected lineages.
The current concept of P. reticulatum includes a wide range of morphological variability, including marginal to submarginal soralia on main lobes, capitate soralia on short lacinae, a sparsely to densely reticulate-maculate upper surface, sparsely to densely ciliate margins, and a lower surface with white mottled to black marginal zones.
The use of genetic distances using short standardized gene regions (DNA barcodes) has provided complementary or alternative support for species identification, which is especially useful when distinct morphological characters are scarce or subtle, and also for detecting overlooked taxa as cryptic species (Hebert et al. Reference Hebert, Cywinska, Ball and deWaard2003a, Reference Hebert, Penton, Burns, Janzen and Hallwachs2004a, Reference Hebert, deWaard and Landry2010; Zemlak et al. Reference Zemlak, Ward, Connell, Holmes and Hebert2009; Del-Prado et al. Reference Del-Prado, Cubas, Lumbsch, Divakar, Blanco, Amo de Paz, Molina and Crespo2010; Liu et al. Reference Liu, Moller, Gao, Zhang and Li2011; Kelly et al. Reference Kelly, Hollingsworth, Coppins, Ellis, Harrold, Tosh and Yahr2011). The utility of a single gene sequence for identifying species depends on the extent of separation between intraspecific variation and interspecific divergence (the barcoding gap: Meyer & Paulay Reference Meyer and Paulay2005). Del-Prado et al. (Reference Crespo, Kauff, Divakar, Del-Prado, Pérez-Ortega, Amo de Paz, Ferencova, Blanco, Roca-Valiente and Núñez-Zapata2010) tested the use of nuclear ITS sequences for identification of species using a quantitative method based on the measurement of genetic distances to investigate the gap between intra- and interspecific variation in parmelioid lichens. As a result, a threshold between intra- and interspecific divergence was established, demonstrating that the genetic distances of the ITS sequences are a useful additional tool for establishing species boundaries in parmelioid lichens. Additionally, the ITS locus has recently been recommended as the barcoding marker for fungal groups (Fungal Barcoding meeting, Amsterdam 2011).
In this study we explore species boundaries and cryptic lineages in the P. reticulatum complex to identify potential ‘candidate species’, applying molecular phylogeny and estimation of genetic distances (using the nuclear ITS region) approaches. To achieve this objective we studied specimens from almost the entire distribution of the species. This comprehensive sampling allows us to investigate the monophyly of taxa and relationships between different specimens. Morphological and chemical features of each clade in the P. reticulatum complex are also assessed.
Material and Methods
Taxon sampling
Sequence data of the nuITS gene were analyzed in twelve specimens of Parmotrema pseudoreticulatum and sixty-six of P. reticulatum, collected from distant geographic regions throughout the species distributions. Samples of other Parmotrema species in the molecular phylogenetic analysis included: one individual of P. austrosinense and P. perforatum; two of P. cetratum, P. crinitum and P. hypoleucinum; and four of P. perlatum and P. tinctorum. Flavoparmelia caperata was selected as the outgroup, (Divakar et al. Reference Divakar and Upreti2005b; Crespo et al. Reference Crespo and Lumbsch2010). Data from 36 individuals were generated for this study and 60 sequences downloaded from GenBank. Detailed collection information and GenBank accession numbers are presented in Table 1.
Table 1. Specimens used in the study, with location, herbarium and GenBank accession numbers. Specimens from which new sequences were generated are indicated in bold

* specimens on which chemicals analyses were performed.
† specimens included in the calculation of genetic distances.
DNA extraction, PCR and sequencing
Total DNA was extracted from freshly collected materials, using the DNeasy Plant Mini Kit (Qiagen) following the instructions of the manufacturer, with the slight modifications described in Crespo et al. (Reference Crespo, Blanco and Hawksworth2001). Fungal nuclear ITS rDNA was amplified using the following primers: ITS1F (Gardes & Bruns Reference Gardes and Bruns1993), ITS4A (Larena et al. Reference Larena, Salazar, González, Julián and Rubio1999), ITS1-LM (Myllys et al. Reference Myllys, Lohtander, Källersjö and Tehler1999), and ITS2-KL (Lohtander et al. Reference Lohtander, Myllys, Sundin, Källersjö and Tehler1998). Amplifications were performed in a 25 µl volume containing 2·5 µl 10 × DNA buffer containing 2 mM MgCl2 (Biotools), 0·5 µl dNTPs (10 mM of each base), 1·25 µl of each primer (10 µM), 0·625 µl DNA polymerase (1 U µl−1), 13·875 µl distilled water and 5 µl of DNA template.
The amplifications for nu ITS rDNA were carried out in an automatic thermocycler (Techne Progene, Jepson Bolton & Co. Ltd., Waltford, Herts, UK) using the following parameters: initial denaturation at 94°C for 5 min followed by 35 cycles at 94°C for 1 min, 54 and 56°C for 1 min (ITS1F/ITS4A – ITS1LM/ITS2KL respectively), and 72°C for 1·5 min; and a final extension at 72°C for 10 min. Amplification products were visualized on 1% agarose gels stained with SYBR® Safe DNA (Life Technologies Corporations, USA) gel stain (10 000× concentrated in DMSO) and subsequently purified using the enzyme exoSAP-IT (GE Healthcare, UK) according to the manufacturer's instructions.
Fragments were sequenced using Big Dye Terminator reaction kit (ABI PRISM, Applied Biosystems). Cycle sequencing reactions were performed with the same sets of primers used for PCR amplifications, as described previously (Del-Prado et al. Reference Crespo, Kauff, Divakar, Del-Prado, Pérez-Ortega, Amo de Paz, Ferencova, Blanco, Roca-Valiente and Núñez-Zapata2010). Sequence fragments obtained were assembled with SeqMan 4.03 (DNAStar) and manually edited.
Sequence alignment and phylogenetic analysis
The dataset was aligned using SATé (Liu et al. Reference Liu, Raghavan, Nelesen, Linder and Warnow2009) v. 1.2.1 with the following settings: MAFFT as aligner; Muscle as merger; RAXML as tree estimator; GTRGAMMAI as RAxML model; and size in Max. Subproblem was set at 200, and the rest of the settings were left as default. Ambiguously aligned positions, specifically the first 3 bp (5′ end) and last 35 bp (3′ end), were removed.
The resulting alignment was analyzed using maximum parsimony (MP), maximum likelihood (ML) and a Bayesian Markov Chain Monte Carlo approach (B/MCMC). MP analysis was performed using the program PAUP* 4.0b10 (Swofford Reference Swofford2003). Heuristic searches with 1000 random taxon addition replicates were conducted with the tree-bisection-reconnection (TBR) branch-swapping and MulTrees option in effect, equally weighted characters and gaps treated as missing data. Bootstrapping (Felsenstein Reference Felsenstein1985) was based on 4000 pseudoreplicates with random sequence additions. To assess homoplasy levels, the consistency index (CI) and retention index (RI) were calculated.
The ML analysis was performed using an online version of the program RAxML 7.0.4 (http://phylobench.vital-it.ch/raxml-bb/; Stamatakis et al. Reference Stamatakis, Ludwig and Meier2005, Reference Stamatakis, Hoover and Rougemont2008), assuming a general time-reversible model of nucleotide substitution (Rodriguez et al. 1990) and a discrete gamma distribution with six rate categories. The bootstrap analysis was run with 100 pseudoreplicates.
The program MRBAYES 3.1.2 (Huelsenbeck & Ronquist Reference Huelsenbeck and Ronquist2001) was employed to sample trees using an MCMC method. The nucleotide substitution model was selected using the program jModelTest (Posada Reference Posada2008), and following the AIC criterion. Thus, General Time Reversible substitution model (Rodriguez et al. 1990), with estimation of invariant sites and assuming a gamma distribution with six rate categories (GTR+I+G), was used because it had the lowest –lnL value. No molecular clock was assumed. MrBayes was run for 3 million generations with 12 simultaneous chains. Trees were sampled every 200 generations (for a total of 15 000 trees). The first 300 000 generations (i.e., the first 3000 trees) were deleted as the ‘burn-in’ of the chains. We plotted the log-likelihood scores of sample points against generation time using the TRACER 1.0 program (http://evolve.zoo.ox.ac.uk/software.html?id=tracer; Rambaut & Drummond Reference Rambaut and Drummond2003) to ensure that stationarity was achieved after the first 300 000 generations (Huelsenbeck & Ronquist Reference Huelsenbeck and Ronquist2001). Additionally, we used the program AWTY (Nylander et al. Reference Nylander, Wilgenbusch, Warren and Swofford2007) to compare split frequencies in the different runs and to plot cumulative split frequencies to ensure that stationarity was reached. A majority-rule consensus tree with average branch lengths was calculated for the remaining 12 000 trees using the sumt option in MrBayes. Posterior probabilities were estimated by sampling trees using an MCMC method. Support values were calculated for each branch by counting the occurrences in trees that were visited during the course of the MCMC analysis. Only clades that received ≥ 70% bootstrap support in the MP and ML analyses and posterior probabilities ≥ 0·95 were considered as strongly supported.
Calculation of genetic distances
Pairwise ML distances (given as the number of nucleotide substitutions per site) among the ITS rDNA sequences of the Parmotrema reticulatum – P. pseudoreticulatum complex were calculated. Only one sequence per haplotype was included in the analysis (Table 1). Genetic distances were calculated with TREE-PUZZLE 5.2 (Strimmer & von Haeseler Reference Strimmer and von Haeseler1997) using the GTR model of nucleotide substitution, assuming a discrete gamma distribution with six rate categories following Del-Prado et al. (Reference Del-Prado, Cubas, Lumbsch, Divakar, Blanco, Amo de Paz, Molina and Crespo2010). The program generates an output file which consists of a triangular matrix with all pairwise distances between all the samples included. This matrix was visualized with Microsoft Office program Excel 2000 and genetic distances between different specimens of the P. reticulatum – P. pseudoreticulatum complex were manually identified following these criteria: 1) the values of genetic distances among all the specimens morphologically identified as P. reticulatum and P. pseudoreticulatum; 2) genetic distance values among the specimens nested in the different monophyletic clades defined from the molecular phylogenetic tree topology.
In a complementary approach, we have clustered genetic distances groups, independently of the tree topology obtained in the molecular phylogenetic analysis, based on the threshold of 0·016 substitutions per site (s/s) that separate intra- and interspecific distances in parmelioid lichens (Del-Prado et al. Reference Crespo, Kauff, Divakar, Del-Prado, Pérez-Ortega, Amo de Paz, Ferencova, Blanco, Roca-Valiente and Núñez-Zapata2010). The distance values in the matrix ≤ 0·016 s/s have been considered the values between the samples of the single species. We have used the filter provided by Microsoft Excel to separate values ≤ 0·016, obtaining for every specimen included in the analysis the group of specimens with which it shares the values that characterize the species range.
Polymorphism analyses
In order to see the degree of genetic isolation between the clusters inferred by the genetic distance threshold, we calculated the numbers of shared and fixed alleles and pairwise fixation indices (FST) (Hudson et al. Reference Hudson, Slatkin and Maddison1992). We used the program SITES (Hey & Wakeley Reference Hey and Wakeley1997) to assess genetic differentiation among the groups. Calculations were performed for all pairwise comparisons of inferred distance groups of the two species studied (P. reticulatum, P. pseudoreticulatum).
Morphological and chemical studies
Morphology of all specimens of the P. reticulatum – P. pseudoreticulatum complex included in the molecular analysis (Table 1) were studied using a Leica Wild M 8 dissecting microscope. Characters investigated were: type of rhizine, relative abundance of marginal cilia, lobe shape, size, upper surface colour, soralia development (marginal, submarginal, or terminal on lacinae), and reticulation on upper surface (presence/absence).The specimens marked with an asterisk in Table 1 were chemically analyzed by thin-layer chromatography (TLC) using solvent system C (Culberson Reference Culberson1972; Elix & Ernst-Russell Reference Elix and Ernst-Russell1993; Lumbsch Reference Lumbsch, Kranner, Beckett and Varma2002).
Results
Phylogenetic analyses
A matrix with 94 Parmotrema nu ITS sequences and two F. caperata sequences was compiled, using 36 new sequences and 60 sequences downloaded from GenBank (http://www.ncbi.nlm.nih.gov) (Table 1). The data matrix included 460 unambiguously aligned nucleotide positions (TreeBASE No. S11708).
The MP analysis of the data matrix resulted in 4436 most parsimonious trees (tree length = 264 steps, CI = 0·6174, RI = 0·8969). Twenty-seven positions in the matrix were parsimony uninformative and 107 were informative. For the Bayesian analysis the LnL value was −2328·20 with a standard deviation of ±0·396, and for ML the LnL value was −2093·9609.
Since the topologies of the trees estimated from MP, ML and Bayesian methods did not present any well-supported conflict, only the 50% majority-rule consensus tree of the Bayesian tree sampling is shown, with MP and ML bootstrap values indicated on the Bayesian topology (Fig. 1).
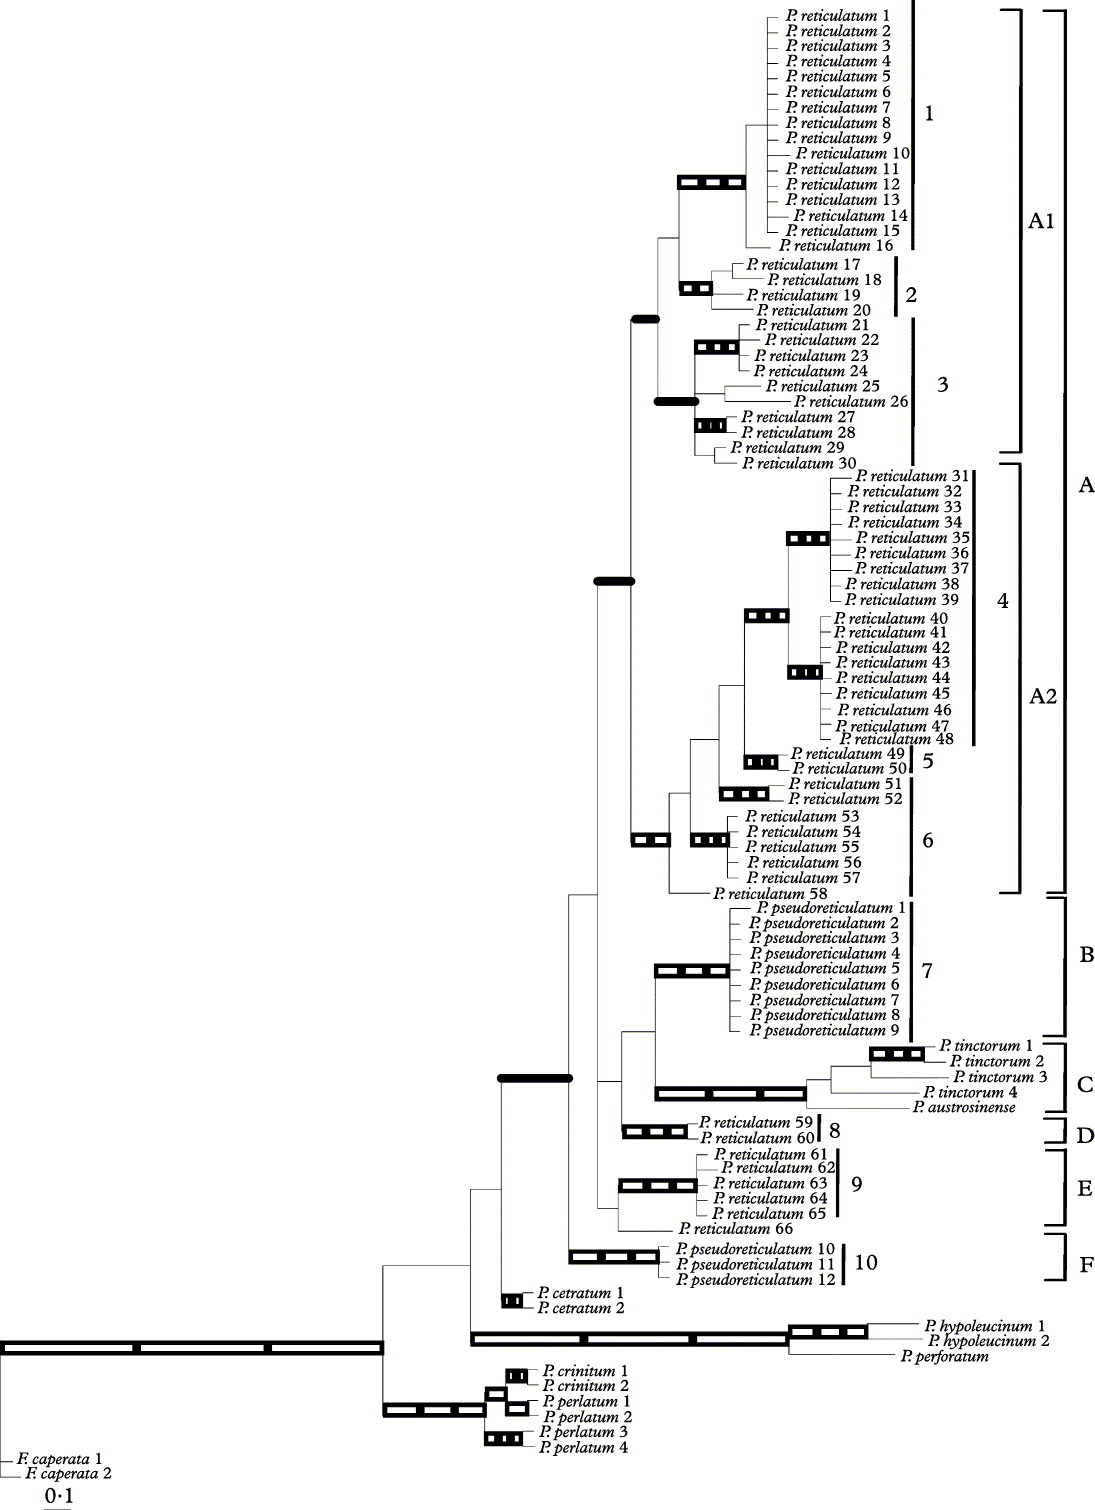
Fig. 1. 50% majority-rule consensus tree of the molecular phylogenetic relationships in the Parmotrema reticulatum – P. pseudoreticulatum complex, based on 12 000 trees from a B/MCMC tree-sampling procedure, from a dataset of nu ITS sequences. Branches that were strongly supported in all three analyses (i.e., PP ≥ 0·95 in the B/MCMC analysis and ≥ 70% in the MP and ML bootstraps) are indicated by three open squares or rectangles; those receiving strong support in the B/MCMC analysis and the ML bootstrap are indicated by two open squares. The branches that received strong support only in the ML bootstrap analysis are indicated by an open rectangle, and those that received strong support only in the B/MCMC analysis are indicated in solid bold line. Groups numbered 1 to 10 indicate the phylogenetic clusters obtained when a value of 0·016 s/s is taken as the screening threshold for attempting to determine the species boundaries in the P. reticulatum – P. pseudoreticulatum complex.
The topology of the tree (Fig. 1) shows that the Parmotrema species formed a well-supported monophyletic group, indicated by the three methods. However, the phylogenetic relationships between the species were not well resolved. All the samples morphologically identified as P. reticulatum or P. pseudoreticulatum nested in a monophyletic clade with strong support in the Bayesian analysis, that included the samples of P. tintorum and P. austrosinense. Within this clade, the samples of P. reticulatum and of P. pseudoreticulatum split into multiple statistically supported clades (Fig. 1). Fifty-eight specimens of P. reticulatum formed a monophyletic group (Clade A) with strong support in the Bayesian analysis, two samples from Chile formed a different clade (clade D), five samples from the Canary Islands clustered in an independent group (clade E), and one sample from the Canary Islands (P. reticulatum 66) separated from the rest of the clades.
Specimens of P. pseudoreticulatum split into two well-supported monophyletic groups (clades B and F). Samples of P. tinctorum grouped with P. austrosinense in a well-supported monophyletic group (clade C). However, phylogenetic relationships among the clades were not resolved, since they lacked strong statistical support.
Additionally, within clade A, two well-supported monophyletic clades (clades A1 and A2) were recovered. The samples of P. reticulatum included in both clades did not correlate with the geographical distribution (see Table 1). Molecular phylogenetic relationships between well-supported lineages within clades A1 and A2 were not resolved as they lacked strong statistical support.
Genetic distances
The results from the genetic distance analysis, comparing the distances values within the groups defined in the P. reticulatum – P. pseudoreticulatum complex based on the morphologic, phylogenetic and distances analysis, are compiled in Table 2.
Table 2. Results from the genetic distance (substitution per site) analysis comparing the pairwise genetic distance values within the defined groups in the P. reticulatum – P. pseudoreticulatum complex. The absence of mean and standard deviation (SD) is due to values from two haplotypes. Zero values correspond to groups with one haplotype

Pairwise genetic distances between all the specimens morphologically identified as P. reticulatum (Clades A + D + E + P. reticulatum 66 in Fig. 1) ranged from 0·003 substitutions per site (s/s) to 0·054 s/s, while values for the specimens morphologically identified as P. pseudoreticulatum (Clades B + F in Fig. 1) ranged from 0·003 s/s to 0·046 s/s. Estimation of the distances between P. reticulatum and P. pseudoreticulatum samples gave a range of pairwise genetic distances from 0·031 s/s to 0·064 s/s.
Genetic distances were also estimated among the specimens nested in the different supported monophyletic clades based on molecular phylogenetic tree topology (Fig. 1): the range of pairwise genetic distances was 0·003 to 0·047 s/s for clade A1 and 0·003 to 0·030 s/s for clade A2. In clades B and E the distance value between the two different haplotypes of each clade is 0·003 s/s. The specimens included in clades D and F are from different localities but resulted in a single haplotype and thus the distance value is 0·0 s/s.
In a complementary approach, the sequences of P. reticulatum and P. pseudoreticulatum were grouped on the basis of the threshold of 0·016 s/s that separated the intraspecific and interspecific distances in parmelioid lichens (Del-Prado et al. Reference Crespo, Kauff, Divakar, Del-Prado, Pérez-Ortega, Amo de Paz, Ferencova, Blanco, Roca-Valiente and Núñez-Zapata2010). Figure 1 shows the groups (numbered 1 to 10) that formed the sequences following this criterion and Table 2 represents the genetic distances within these groups. These clusters, with the exception of the group number 6, correspond to supported monophyletic clades according to the phylogenetic analysis.
Polymorphism analysis
Polymorphisms in the nuITS marker were analyzed to compare the groups delimited in the P. reticulatum – P. pseudoreticulatum complex in the genetic distance study, considering a standard threshold of 0·016 s/s (Fig. 1). Table 3 shows the number of fixed differences and the fixation indices (FST) between the groups. There were fixed differences between the pairwise comparisons of different genetic clusters, although small sample sizes within groups may artificially inflate the number of fixed loci. The lowest FST value (0·491) was found between groups 2 and 3. The values between group 6 and groups 2, 3, 4 and 5 were approximately 0·6, and all other values were ≥ 0·7. Groups 5 and 10 were represented by a small number of sequences and thus FST values between these groups and the rest are not significant. The shared polymorphisms by different groups, revealed only one nucleotide shared by groups 2 and 3 (position 183) and another by groups 3 and 6 (position 382).
Table 3. Results from nuclear ITS nucleotide polymorphism analyses comparing the groups established in the P. reticulatum – P. pseudoreticulatum complex by the use of genetic distances applying a standard threshold of 0·016 s/s to separate intra- and interspecific divergence. Values are number of fixed differences (above diagonal) and fixation index values (FST – below digonal)

Morphological and chemical studies
There was a wide range of variation in morphological features identified within each individual clade, including specimens with an olive-green to grey upper surface, simple to squarrose rhizines on the lower surface, capitate soralia on lobules to marginal, and submarginal soralia on main lobes. These features were therefore inconclusive when trying to corroborate the monophyletic lineages. Since P. reticulatum and P. pseudoreticulatum generally reproduce asexually by soralia diaspores, apothecia are rare in these species, so that ascomatal features and ascospore characters were not investigated.
There was no variation in the phenolic constituent in the specimens of the P. reticulatum – P. pseudoreticulatum complex; all of them contained atranorin and salazinic acid. Additionally, in P. reticulatum 47 (clade A2/4) and P. reticulatum 54 (clade A2/6) gyrophoric acid was also found in trace amounts. Thus, phenolic compounds did not corroborate the groups identified using molecular data.
Discussion
Traditionally, morphological and chemical features have often been used to delimit species of lichenized fungi (Hale Reference Hale1965; Swinscow & Krog Reference Swinscow and Krog1988; Elix Reference Elix1994b; Divakar et al. Reference Divakar, Upreti and Elix2001). In the Parmotrema reticulatum – P. pseudoreticulatum complex, characters traditionally considered as diagnostic have been re-evaluated within a molecular phylogenetic framework, and molecular data failed to corroborate traditionally circumscribed taxa. Rather, these data provide evidence of the existence of several cryptic lineages hidden under the names of P. reticulatum and P. pseudoreticulatum. Lineages inferred from molecular data are not correlated with broad geographical patterns; in fact, specimens from distant geographic regions are clustered in a single clade (clade A1, Fig.1, Table1), which includes specimens from Asia, Europe, North and East Africa, and South America. As a consequence, molecular data appears to be essential to characterize and accurately identify species within this complex.
Genetic distance measurements have been used frequently as a tool to investigate species boundaries and to identify cryptic diversity in different groups of animals (e.g. Hebert et al. Reference Hebert, Cywinska, Ball and deWaard2003a, b, Reference Hebert, Penton, Burns, Janzen and Hallwachs2004a, b, Reference Hebert, deWaard and Landry2010; Ward et al. Reference Ward, Zemlak, Innes, Last and Hebert2005, Reference Ward, Holmes and O'Hara2008; Lefébure et al. Reference Lefébure, Douady, Gouy and Gibert2006; Zemlack et al. Reference Zemlak, Ward, Connell, Holmes and Hebert2009), plants (Kress et al. Reference Kress, Wurdack, Zimmer, Weigt and Janzen2005; Fazekas et al. Reference Fazekas, Kesanakurti, Burgess, Percy, Graham, Barrett, Newmaster, Hajibabaei and Husband2009; Hollingsworth et al. Reference Hollingsworth, Forrest, Spouge, Hajibabaei, Ratnasingham, Van der Bank, Chase, Cowan, Erickson and Fazekas2009) and fungi (Seifert et al. Reference Seifert, Samson, deWaard, Houbraken, Levesque, Moncalvo, Louis-Seize and Hebert2007; Smith et al. Reference Smith, Douhan and Rizzo2007; Nilsson et al. Reference Nilsson, Kristiansson, Ryberg, Hallenberg and Larsson2008; Simon & Weiss Reference Simon and Weiss2008; Vialle et al. Reference Vialle, Feau, Allaire, Didukh, Martin, Moncalvo and Hamelin2009).
Del-Prado et al. Reference Del-Prado, Cubas, Lumbsch, Divakar, Blanco, Amo de Paz, Molina and Crespo2010 measured intra- and interspecific genetic distances in parmelioid lichens, establishing a threshold of 0·015–0·017 s/s to separate ranges of intra- and interspecific divergence. The threshold was established using both phylogenetically and morphologically well delimited species (for detail see Del-Prado et al. Reference Del-Prado, Cubas, Lumbsch, Divakar, Blanco, Amo de Paz, Molina and Crespo2010). Based on these data, the levels of ITS divergence within the specimens morphologically identified as P. reticulatum are much higher than those of single-species populations. The same result is obtained when pairwise distances between all the samples identified as P. pseudoreticulatum are calculated. Also, the distances within the specimens nested in the monophyletic clades A1 and A2, obtained from the molecular phylogenetic analysis, suggest the presence of different groups of lineages within each clade.
Consequently, based on the threshold established for genetic distances in parmelioid lichens, we have used the P. reticulatum – P. pseudoreticulatum complex as a case study to formulate an initial hypothesis of species boundaries, as a move towards inferring genetic clusters within this complex. As a result, eight clusters in P. reticulatum and two in P. pseudoreticulatum were designated as possible candidate cryptic species. Within these clusters, ranges of genetic distances characterized single-species populations. In addition, all of them correspond to well-supported monophyletic groups, except one (group number 6), although the phylogenetic relationships among them remain to be resolved. In the case of group number 6, the phylogenetic relationships between the specimens included in this group also remain to be resolved. Currently we are increasing the taxa sampling and the number of studied loci to evaluate the presence of distances-based groups that could not correspond to monophyletic clades.
Additionally, FST indices, as a measure of population differentiation (Holsinger & Weir Reference Holsinger and Weir2009), were calculated to assess the extent to which these candidate populations are genetically isolated. FST values can range from 0 (complete panmixis) to 1 (complete isolation between populations). FST values measured between our targeted clusters were mostly ≥0·7. These results, in conjunction with only two shared polymorphisms, suggest that the genetic clusters are significantly isolated and constitute lineages that are evolutionarily independent, or on a trajectory towards becoming independent (Ross et al. Reference Ross, Gotzek, Ascunce and Shoemaker2010). Under the unified species concept (De Queiroz Reference De Queiroz2007), these results provide one layer of evidence supporting that candidate species inferred within the P. reticulatum – P. pseudoreticulatum complex represent species-level lineages.
The formal species circumscription, using sequence data exclusively, would be reinforced by strong evidence from multiple independent loci in the subsequent study. In this paper, we have presented an approach to identify candidate species groups using the genetic distances approach with the ITS locus that has recently been proposed as a universal DNA fungal barcode (Fungal Barcoding meeting, Amsterdam 2011). In a subsequent paper, these groups will be evaluated under a multilocus approach to circumscribe species with confidence. Additionally, taxon sampling within this complex is being extended to investigate the reproductive isolation of these clades more completely.
Parmelioid lichens have been shown to include a large number of cryptic lineages hidden under broadly and/or disjunctly distributed species (Crespo & Lumbsch Reference Crespo and Lumbsch2010; Divakar et al. Reference Crespo, Kauff, Divakar, Del-Prado, Pérez-Ortega, Amo de Paz, Ferencova, Blanco, Roca-Valiente and Núñez-Zapata2010b). This suggests that the morphology-based species concept underestimates diversity in this group of lichenized fungi. Genetic distances/barcoding provides an important approach to more accurately (relative to current morphological interpretation) identify species in parmelioid lichens. DNA barcoding in fungi is in its infancy and recently the ITS locus has been proposed as a universal DNA barcode. To develop DNA barcoding successfully, it is essential to delimit species boundaries accurately. The noteworthy contribution of the present investigation is the application of a rapid and reliable method to identify problematic groups and candidate species within parmelioid lichens using the ITS locus with a genetic distances approach. This study provides a working example of how to use this ‘additional tool’ for hypothesis testing in parmelioid species complexes that are confounded by a misinterpretation of morphological and chemical characters.
The authors thank two anonymous referees for their valuable suggestions. We acknowledge the Ministerio de Ciencia e Innovación (CGL2010-21646) for providing main funds for this research, Ramón y Cajal grant (RYC02007-01576) to PKD, and the Universidad Complutense de Madrid for all complementary facilities. We also thank Dr Phil Masson for English revision. Sequencing was carried out at the Unidad de Genómica (Parque Científico de Madrid, UCM) and M. Isabel Garcia Saez is especially thanked. We acknowledge the Encyclopedia Of Life (EOL) and all participants at the Parmeliaceae meeting in Chicago, May 2010.


