


Introduction
Advanced treatment techniques, such as intensity-modulated radiotherapy (RT) and volumetric-modulated RT, have proved to be beneficial in reducing the bowel, rectal and bladder toxicities in prostate cancer patients,Reference Michel1,Reference Zelefsky, Levin and Hunt2 creating an opportunity for dose escalation without increasing organ at risk doses. Several studies support the escalated and hypo fractionated doses for better disease control in prostate cancers.Reference Michalski, Moughan and Purdy3–Reference Katz and Kang8 Reduction in planning target volume (PTV) margin is a necessity in such treatments to help reduce normal tissue toxicity.
Escalated dose with sharp dose fall-off and reduced PTV margins all demand an accurate and reproducible patient setup during the whole course of treatment. Image-guided radiotherapy (IGRT) is the class process to maintain an accurate and reproducible patient setup.Reference Vigneault, Pouliot and Laverdiere9 With the introduction of IGRT technologies, the PTV margins for prostate cases have been reduced from 10 to 7 mm or lower.Reference Litzenberg, Dawson and Sandler10–Reference Mutanga, de Boer and van der Wielen13
Two-dimensional kilo voltage (kV) planar imaging and kV cone beam computed tomography (CBCT) are commonly used to aid prostate localisation. Bony anatomy match or fiducial match is used with the kV images, while the CBCT images provide an additional option of soft tissue match. Although kV planar image acquisition with bone matching is less time-consuming, it has limitations due to prostate movements.Reference Paluska, Hanus and Sefrova11,Reference Beard, Kijewski and Bussiere14–Reference Schallenkamp, Herman and Kruse17 Paluska et al.Reference Paluska, Hanus and Sefrova11 have highlighted the advantage of fiducial marker (FM) matching over bony landmark match for prostate cases to aid localisation using CBCT images. Soft tissue matching in CBCT has been reported as challenging due to inadequate soft tissue contrast in the prostate gland.Reference Liszewski, Choo and D’Alimonte18,Reference Moseley, White and Wiltshire19
The FM, easily visible with kV imaging, acts as a surrogate for the soft tissueReference Ng, Brown, Williams, Chao, Lawrentschuk and Chee20 but relies on the fiducial remaining fixed with respect to the prostate. Several studies based on the kV planar imagesReference Van der Heide, Kotte and Dehnad21–Reference Delouya, Carrier and B’eliveau-Nadeau26 have reported fiducial migration quantified through measuring the inter-marker distance (IMD) with an SD of between 0·3 and 1·03 mm. CBCT-based small population studies made on polymer-based FM and gold FM have reported a seed migration below 1 mm.Reference Camacho, Valduvieco and Sáez27,Reference Hammoud, Pradhan and Kim28 The seed movements reported by these studies can be make and model dependent.
Even a daily corrected FM-based setup leaves behind a small degree of setup error that is constituted through FM movement, image matching error, couch correction error, etc. In addition to these, the error due to the prostate movement with respect to the FM also contributes to the effectiveness of the localisation and thereby the quality of RT provided. The movement of the prostate with respect to FM has been established by different studies.Reference Crook, Raymond and Salhani16,Reference Barney, Lee and Handrahan29,Reference Van der Wielen, Mutanga and Incrocci30 These factors need to be considered and incorporated into the PTV margin to aid a good practice in RT.
Daily orthogonal kV-image-based FM registration and translational couch correction is the adopted prostate localisation technique in our department. The CBCT images acquired on the first three days followed by once every week were used to analyse the status of rectum and bladder during the treatment course. These images have been utilised to quantify the FM migration, the setup error after daily correction (translation alone and translation plus rotation) and prostate anatomy variation. The PTV margin that is required for the safe delivery of prostate RT is calculated for two different CBCT-based daily correction scenarios, translation alone and translation plus rotation.
Methods and Materials
A total of 166 CBCT image sets acquired for 25 randomly selected RT patients were studied retrospectively in this study—a total of 75 implanted FM with 3 FM per patient. Orthogonal kV-image-based FM registration and correction were applied daily for the prostate localisation. CBCT images used to analyse the status of the critical organs were acquired before the kV planar images.
FM-based localisation has been the department’s prostate RT localisation technique since 2008. The three gold fiducial seeds were implanted transrectally by experienced urology doctors with ultrasound guidance, along the base (left and right) and the apex of the prostate. A time gap of 2 weeks is allowed between FM insertion and planning CT (PCT) to ensure the settling down of seeds. The seeds used in the study are the MTNW887825 soft tissue gold markers from Civco (Orange City, FL, USA) with dimensions, 1·2 × 3 mm2. Image matching and data acquisition were carried out by Practitioner Training Programme trainees under supervision. Patient setup uses a hip to foot indexed immobilisation device ProSTEP (Oncology Imaging Systems, East Sussex, UK) and prepared with micro enema and full bladder.
The PCT was acquired with Toshiba Aquillion LB 16 slice CT scanner (Canon Medical Systems, Tochigi, Japan) with 3-mm slice spacing. The CBCT was acquired on True Beam Linear accelerator (Varian Medical System, Palo Alto, CA, USA) with 2-mm spacing, 512 × 512 matrix and 0·91-mm resolution in width and height. The software module used for the study is the Offline review, within Aria 11.0.31 and 13.7. Consistency of the match results was checked between both the versions. The study is done in four stages, as shown in Figure 1:

Figure 1. Diagrammatic representation of the methods used in the study.
Stage 1: This part of the study looks at the FM migration during the course of treatment. The IMD measured on the PCT was compared to that measured on the CBCT (Figure 2). The trend of variation of IMD with respect to PCT throughout the treatment was plotted for each patient. Analysis was carried out as right–left (RL), anterior–posterior (AP) and superior–inferior (SI) components of IMD and as the magnitude of the vector displacement between the seeds. The trend in the movement of the individual seeds for the individual patients and as a population was analysed.
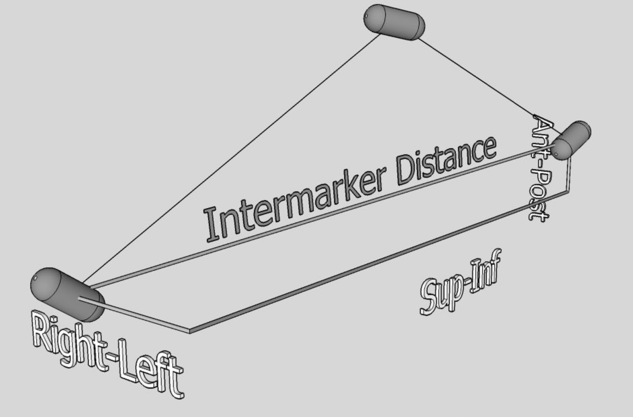
Figure 2. ‘Inter marker distance’ represents the magnitude of the displacement vector between two fiducial markers.
Stage 2: In this stage, we have estimated the residual mismatch that exists between the FM in the PCT and the same seeds in the CBCT after performing the image registration on seeds in two setup correction conditions: (i) translation correction alone (T) and (ii) both translation and rotational corrections (T+R). The residual FM mismatch is the setup error after the corrections are applied on a daily basis. FM auto matching was performed on the CBCT images followed by minute manual intervention to perfectly match at least two FM and leave the third as displaced. The Downhill simplex optimiser along with Mutual Information algorithm for the similarity measure was used as match setup parameters for the automatic FM match option. The systematic and random residual setup errors are calculated from the measured data as per ‘On target’ (Royal College of Radiologists, Institute of Physics and Engineering in Medicine).Reference Hoskin, Gaze and Greener31
Stage3: This stage is where we studied the prostate anatomy variation with respect to the seed matched position. Automatic soft tissue matching parameters were set to look for the best pixel intensity match for the contoured Clinical Target Volume (CTV) plus 1-cm margin. The grey value differences near the peripheral regions of the prostate and the nearby muscles were visually analysed to decide the acceptability of the automatic match. The difference of position of the FM, in the three orthogonal directions, on the CBCT with soft tissue match compared to that with FM match was employed as a measure of prostate deformation that exists after the setup correction. The data are analysed for the systematic and random components of prostate deformations as in Stage 2. The prostate deformation after the (T) corrected seed position and (T+R) corrected seed position is measured separately from the respective FM positions.
Stage 4: In this stage, the systematic and random components of the prostate deformation (Stage 3) and those of residual setup errors (Stage 2) are added quadratically and used to calculate the PTV margins as per Van Herk’s formula.Reference van Herk32
The uncertainties involved in IMD and setup error measurements, such as the inter-observer and the intra-observer variations, are also quantified. The centre of the FM is taken as the centre visualised on the images. The error in identifying the centre of the FM on images is calculated as half the resolution (0·5 mm) in the RL and AP directions and as half the slice thickness (1·5 mm) of the CT in the SI direction.
Results
Stage 1: The average directional variation in the IMD is found to be −0·05 ± 0·9 mm (p > 0·025), while the average absolute IMD variation is 0·6 ± 0·5 mm. A negative value means that the IMD in the PCT is smaller than that in the CBCT.
The above analysis repeated for the RL, AP and SI components separately shows variations of −0·08 ± 0·72, 0·10 ± 1·2 and −0·01 ± 1·23 mm in the RL, AP and SI directions with p values 0·01, 0·06 and 0·86, respectively. Table 1 provides a clear view of FM movements revealed from the study. The SDs in inter-observer and intra-observer variations in IMD measurements are 1·21 (p > 0·025) and 0·89 mm, respectively. The histograms of the data for the 3 stages of the study is provided in the supplementary file.
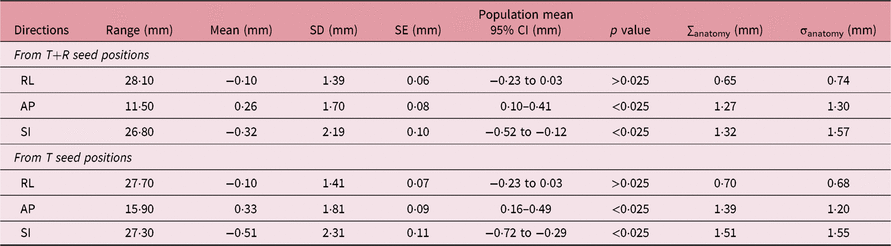
Table 1. The statistical parameters for IMD variation study method 1—considering the RL, AP and SI components separately and as a whole

Notes: ∑ is the systematic component of the seed movements. R represents the correlation between the IMD in planning CT and CBCT.
Stage 2: The setup errors after translation correction alone (T) and after both translation and rotational corrections (T+R) are tabulated in Table 2. The SDs in inter-observer variation in measuring setup error (T+R) corrected are found to be 0·62, 0·87 and 1·52 mm in the RL, AP and SI directions, respectively, with p > 0·025. The corresponding results for T correction are 0·78 mm (p > 0·025), 1·56 mm (p < 0·025) and 1·58 mm (p > 0·025). The intra-observer variations in measuring setup error (T+R corrected) are 0·57, 0·75 and 1·54 mm in the RL, AP and SI directions, respectively. The corresponding results for (T) correction are 0·44, 0·26 and 0·87 mm.
Table 2. The statistical parameters of residual error after seed match and setup correction. ∑setup and σsetup represent the systematic and random components of setup error after corrections

Stage 3: The variation of prostate anatomy, studied by comparing the variation of the FM position between soft tissue matched and FM matched images, is tabulated in Table 3.
Table 3. The statistical parameters of anatomy variation. ∑anatomy and σanatomy represent the systematic and random components of anatomy variation with respect to setup corrected FM positions
Stage 4: PTV margin: The PTV margins for the two setup correction scenarios are calculated as per Van Herk’s formula.Reference van Herk32 Systematic and random errors from Tables 2 and 3 are quadratically added and used in margin calculation (Table 4).
Table 4. PTV margins from residual setup errors and anatomy variation. Setup correction follows two scenarios, translation+rotation correction and translation correction alone

Discussion
Average IMD variation in the studied sample (−0·05 ± 0·9 mm) is close to that reported by Hammoud et al. from their study on CBCT images.Reference Hammoud, Pradhan and Kim28 Our data did not show any patterns in IMD variation as reported by Van der Heide et al.Reference Van der Heide, Kotte and Dehnad21
Figure 3 shows the average IMD variation in each patient. The maximum SD in IMD variation noted in our study is 1·25 mm, whereas Kupelian et al.Reference Kupelian, Willoughby and Meeks24 reported this as 4·2 mm in his study on 56 patients on planar images. The largest observed positive and negative values of IMD variation noted in our study are 3·06 and −3·28 mm. This, as reported by the above study, is 10·2 mm. This lower SD observed in our sample is considered as the result of low-residue diet and the use of micro enema,Reference Yahya, Zarkar, Soutgate, Nightingale and Webster33 which is not mentioned in the study by Kupelian et al. The same study reported an average SD of IMD variation as 0·83 mm. Pouliot et al.Reference Pouliot, Aubin and Langen22 reported an average SD of 1·3 mm (range: 0·44–3·04 mm). The corresponding result from our study is 0·72 mm (range: 0·23–1·25 mm). The pattern in FM migration is tested by plotting a graph of the IMD variation on consecutive images. Decreasing IMD noted on 2 out of 25 patients by observer 1 was revealed to be a subjectivity effect when measured by a second observer. Images with more than 2·5-mm IMD variations were checked individually, but no visually identifiable signs of significant rectum or bladder filling changes were noted.
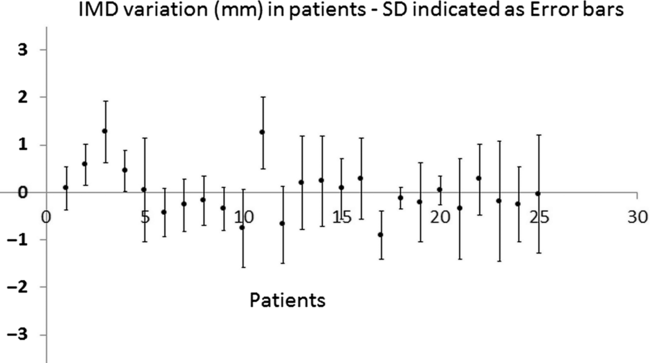
Figure 3. IMD variation in each patient. Blue points represent average in each patient and error bars represent the SD. Y-axis—IMD variation in millimeter.
It is interesting to note that the inter-observer variations in IMD measurements in the RL, AP and SI direction (0·80, 0·99 and 1·81 mm) are close to the SDs in the IMD variation. This means that the quantified IMD variation is close to measurement uncertainty. However, regression analysis was performed to find if any relation existed between the SD of the IMD variation and parameters such as minimum distance between seeds, prostate volume or rectal volume and bladder volume on the PCT taken as separate entities. No relation could be established between these parameters. CT images were individually analysed, and we noted higher SD for patients with either FM seeds very close to the rectal wall or where a marker is under the bladder, or very large bladder volumes over approximately 900 cc or a combination of these factors. The number of patients in our study is a restricting factor in coming to a definite conclusion in this regard.
The residual setup error after translation correction is not significantly different from that of translation plus rotational setup correction. This is an indication of the effectiveness of our localisation technique that has helped us to reduce the pitch roll and rotation on our patients.
Our results on prostate deformation are comparable to those reported by Barney at al.Reference Barney, Lee and Handrahan29 and Hammoud et al.Reference Hammoud, Pradhan and Kim28 Van der Wielen et al.Reference Van der Wielen, Mutanga and Incrocci30 has reported a smaller SD in deformation with the use of alternate methodology.
As the department uses kV–kV FM match with daily translation corrections, a comparison is made on the setup errors of kV FM match vs CBCT FM match. The differences are 0·08 ± 0·82 mm, −0·44 ± 1·42 mm and 0·1 ± 1·5 mm in the RL, AP and SI directions, respectively. The systematic and random errors from this are also added to the departments PTV margin but not reported in this work This work reports PTV margins in three directions, required in two different scenarios, one when CBCT-based daily setup correction is applied in three translation directions and the other where daily setup correction is applied to translational and rotational directions. Other factors such as seed match error, couch correction error, radiation isocentre error, multi-leaf collimation positioning error, margin growing algorithm error, and breathing errors are not reported as these are not within the scope of this study. These factors need to be considered while calculating the final PTV margins. PTV margin calculated from our work is found to be smaller than that reported by Oehler et al.Reference Oehler, Lang and Dimmerling34 who has considered intra-fractional prostate movements and contouring inaccuracy, into their margin formula, neither of which was considered in our study. A 3-mm symmetric PTV margin was reported by Sukhdeep et al.Reference Sukhdeep, Reddy, Campbell and Chen35 and Gert et al.Reference Gert, Meijer and Kartl36 as the margin required to cover the CTV in 99% and 90% of cases, respectively.
Conclusion
Our results show minimal seed migration in the population studied. Only 2 out of 498 images analysis showed a vector IMD variation more than 3 mm. The RL direction shows the lowest SD in IMD variation, setup errors and prostate deformation. The SDs of the prostate deformation relative to FM positions in the SI and AP directions were 2·19 and 1·7 mm, respectively. This could be partly due to the varying bladder and rectal status during the treatment course, which is a known issue even after the introduction of a specific bladder filling protocol. The prostate PTV margins to incorporate the CBCT-based inter-fractional FM localisation error after daily T+R setup correction and prostate deformation are found to be 2·5, 4·5 and 5·2 mm in the RL, AP and SI directions, respectively, with the department-specific immobilisation method, rectal and bladder filling protocols. The corresponding margins for translation corrected scenario are found to be 2·8, 4·8 and 5·7 mm, respectively. This study reveals to us that we have a robust clinical practice that gives a high degree of confidence first in the localisation and second in the margins we use.
Supplementary material
To view supplementary material for this article, please visit https://doi.org/10.1017/S1460396919000827.
Acknowledgements
The authors thank Mone Ioanna, Srikaran Megara and Mahmood Sahar for data collection. They also thank Dr Miguel Panades for reading and commenting on the clinical side of this paper.
Conflict of Interest
The authors declare that they have no conflict of interest.
Ethics Committee Approval
This was not needed due to the retrospective design of the study that did not involve any additional exposure to patients.


