

Energy in the form of food and coal Footnote 1 constituted a major factor in the demands of the war economies established during World War I (WWI). The German war economy was suffering, especially a persistent shortage of coal. Output in all coal-mining districts fell from 1913 to 1914 but most severely in the Ruhr coal district, the largest and most important one (Böse Reference Böse2018, p. 244). Footnote 2 Coal output was stabilized after 1915, yet on a level far lower than that of 1913 and far too low to meet increased war demands. Footnote 3 The coal shortage affected the German war effort and therefore had consequences beyond Germany. Footnote 4 Its primary cause was the reallocation of manpower and other resources toward the military forces (Broadberry Reference Broadberry, Broadberry and Harrison2018; Offer Reference Offer, Broadberry and Harrison2018). Around 800,000 foreign civilian workers and most of the approximately 2.5 million prisoners of war (POWs) taken by Germany––10.5 percent of the 1913 labor force (Spoerer Reference Spoerer2006, p. 124)––were employed in the war economy to overcome the manpower shortage. POWs were employed in agriculture but also in key industries such as coal mining (Herbert Reference Herbert1997, pp. 16–17; Ritschl Reference Ritschl, Broadberry and Harrison2005; Oltmer Reference Oltmer and Oltmer2006, pp. 70–71).
From one perspective, the impact of employing POWs in coal mining is perhaps straightforward and similar to other stories of forced labor told for the twentieth century; firms hired forced labor and, as a consequence, labor productivity declined due to forced laborers’ inexperience, lacking motivation, and poorly maintained physical working capacity. Although POW assignment is only one factor that affected coal-mining productivity, it is the factor to which mining historians have been attaching the most importance. Burghardt (Reference Burghardt1988, p. 97; my translation of the German original), for example, states,
“[l]anguage problems and lacking motivation, inferior nourishment and absent familiarity with the working conditions in coal mining were the root causes for an utterly low productivity among foreign workers. Their employment was out of all proportion to the additional amount of coal won.”
From another perspective, however, the effects of POW employment are a less straightforward issue because much of what we generally know about the relative productivity of forced laborers in both world wars is embodied in indirect information or is anecdotal (Spoerer Reference Spoerer1999; Rauh-Kühne Reference Rauh-Kühne2002; Custodis Reference Custodis2012, pp. 255–59). The best current figure on POWs’ productivity relative to regular miners’ productivity in WWI German coal mining is around 45–50 percent and comes as anecdotal evidence voiced by a few mine owners (Rawe Reference Rawe, Seidel and Tenfelde2005a, p. 48). We face two source problems here, though: first, this statement may well reflect what was going on in the particular mines addressed but it might not be representative for the entirety of mines; and second, the German POW regime provided firms with a huge incentive for understating POW productivity, because firms could apply for a discount on the part of the POWs’ wages that they had to pay directly to the army. To be eligible, firms had to prove POWs’ productivity was far too low to justify paying the regular wages they were obliged to pay (Rawe Reference Rawe, Seidel and Tenfelde2005a, p. 48).
Overall, whether POWs’ assignments were what primarily depressed aggregate labor productivity and whether the scarce anecdotal evidence is representative and credible has not yet been formally tested. The latter fact carries great weight because the problem of understating POW productivity principally applies to every sector of the German war economy in which POWs were employed. This paper provides the first such test by drawing on Jopp’s (Reference Jopp2017) dataset on the Ruhr coal mines over 1913–38, which is currently the only comprehensive plant-level data set available on any sector of the German WWI economy. It covers all 194 Ruhr coal mines operating over 1914–18.
My identification strategy rests on the observation that many, but not all mines employed POWs beginning in the spring of 1915. This setting allows the application of treatment-effects methodology. Specifically, I employ inverse-probability weighted regression adjustment (IPWRA) to estimate the causal effect of POW employment on mine-level productivity, and I do so for two reasons: First, the key identifying assumption in a standard difference-in-differences (DD) approach is the parallel-trends assumption (Angrist and Pischke 2009, pp. 230–31). However, this assumption is violated in my data, as shown in Figure A.1 in the Online Appendix. The standard DD estimator would be biased, and resorting to non-standard techniques becomes necessary. Second, the chances are high that POW assignments to the mines were not random. I provide suggestive evidence for non-random assignments later. Thus, a technique capable of selecting on observables is needed; that is, a technique allowing estimation of the treatment-assignment process and the outcome process in one framework. IPWRA is a technique that can handle both problems and additionally offers a doubly robust estimation of the treatment effect. The double-robustness property ensures we need to specify only one of the two processes correctly. Thus, we can afford to misspecify one process and still arrive at a consistent estimate of the treatment effect (Wooldridge Reference Wooldridge2007; Uysal Reference Uysal2015).
I use my estimates to answer three crucial questions: First, how much does POW labor alone explain labor productivity development at the mine level? I show that POW assignments caused significant productivity losses; 36 percent of a mine’s annual productivity decline is attributable to POW labor––if POWs were assigned. Second, what was the representative POW’s productivity relative to a regular, well-trained miner’s productivity? I find that it ranged between 22 and 42 percent and, thus, was even lower than anecdotal evidence suggests. Third, what was POWs’ contribution to total Ruhr coal output? Had Ruhr coal mines not recruited POWs but would have won coal with the smaller, yet fully regular workforce, counterfactual coal output would have been lower by about 14.9 million tons cumulated over 1915–18. This amount equals 3.9 percent of historical output and measures POWs’ contribution.
The analysis proceeds as follows. Section two places the study in the literature on labor coercion and world wars. Section three briefly discusses the nature of POW labor vis-à-vis other sorts of coerced labor and formulates a working hypothesis. Section four provides the historical background. Section five introduces the data. Section six discusses methodological issues. Section seven presents the results and discusses their broader implications. Section eight concludes.
PLACING THE STUDY
Much has been written about forms of labor coercion in history (e.g., Fenoaltea Reference Fenoaltea1975, Reference Fenoaltea1984; Engerman 1992; Stone Reference Stone1997; Acemoglu and Wolitzky 2011). A large part of the literature has studied eighteenth- and nineteenth-century slavery (e.g., Toman Reference Toman2005; Olmstead and Rhode 2008; Lagerlöf Reference Lagerlöf2009; Calomiris and Pritchett 2016), indentured servitude (e.g., Galenson Reference Galenson1981, Reference Galenson1984), and serfdom (e.g., Markevich and Zhuravskaya 2018; Buggle and Nafziger 2021). Since Fogel and Engerman (1974), one major goal has persistently been to understand the comparative productivity advantage of Southern over Northern agriculture (Field Reference Field1988).
This paper relates more directly to the literature studying the twentieth century and specifically the world wars when POWs formed a substantial part of the forced labor regimes (Davis Reference Davis1977; Bischof and Overmans Reference Overmans1999; Overmans Reference Overmans1999; Yanikdag Reference Yanikdag1999; Rachamimov Reference Rachamimov2002; Lemmes Reference Lemmes2010). Related settings are the Franco regime in Spain after 1937 (Mendiola Gonzalo 2013, 2014) and the Soviet Gulag system prevalent up until 1990 (Overmans Reference Overmans1999, pp. 387–412, 441–82; Gregory and Lazarev 2003). Scholarly interest may be condensed into three main lines of work: first, into providing reliable reconstructions of the historical numbers of forced laborers (Moore Reference Moore1997, Reference Moore2015; Fleischhacker and Spoerer 2002; Custodis Reference Custodis2014); second, into evaluating living conditions, treatment, and survival under the different regimes (Krammer Reference Krammer1983; MacKenzie Reference MacKenzie1994; Spoerer Reference Spoerer2001, Reference Spoerer2006, Reference Spoerer, Seidel and Tenfelde2007; Thiel 2005; Alexander Reference Alexander2006; Hinz Reference Hinz2006); and, third, into assessing how productive and profitable forced labor was vis-á-vis free labor (Fickle and Ellis 1990; Herbert Reference Herbert1997, pp. 299–300; Spoerer Reference Spoerer1999; Rauh-Kühne Reference Rauh-Kühne2002; Alexander Reference Alexander2006; Custodis Reference Custodis2012, Reference Custodis2014, Reference Custodis, Scherner and Eugene2016; Mendiola Gonzalo 2013).
The dominant take-away from the latter strand is that forced labor in the twentieth century increased output but also led to lower output per unit of labor input (i.e., lower labor productivity) (Davis Reference Davis1977; Spoerer Reference Spoerer1999, pp. 65–70; Custodis Reference Custodis, Scherner and Eugene2016). At the very least, in the context of industrial production, losses in aggregate productivity should not come as a surprise considering that workers’ individual productivity depended on their qualifications for the job, their motivation, and their physical condition (Davis Reference Davis1977, p. 623; Mendiola Gonzalo 2013, p. 204). Forced laborers generally were not kept as well-fed as regular laborers and consequently were not as fit (Alexander Reference Alexander2006); and they should also have lacked motivation, although authorities tried to set work incentives in the form of physical punishment, monetary rewards, or better food (Seidel Reference Seidel2003, pp. 115–17; Vourkoutiotis Reference Vourkoutiotis2003, pp. 127–30; Rawe 2005c, p. 225; Alexander Reference Alexander2006).
The studies to which my approach is methodologically closest are those by Custodis on WWII. Custodis assessed the contribution of Italian and German POWs to British agriculture (Custodis Reference Custodis2012, Reference Custodis2014) and of POWs from Allied countries to German agriculture and industry (Custodis Reference Custodis, Scherner and Eugene2016). He has shown that POWs were relatively less productive individually, albeit catching up in productivity over time, but still contributed substantially to GDP with their efforts.
The literature on the employment of forced labor in German WWI mining itself is sparse. Rawe (Reference Rawe, Seidel and Tenfelde2005a, Reference Rawe2005b, 2005c) provides the key studies on Ruhr coal mining but, apart from a short discussion of the anecdotal evidence mentioned earlier, largely neglects the issue of relative POW productivity. Footnote 5 Burghardt (Reference Burghardt1988, Reference Burghardt1995, p. 174) claims that POWs from the East, who constituted the largest fraction of POWs in mining and who had most commonly been agrarian workers before the war, were 50–60 percent less productive than the average regular miner. Burghardt also claims that POWs from the West, if they had worked in an industrial occupation before the war, were only 20–40 percent less productive than the average regular miner.
THEORIES ON THE NATURE OF POW LABOR
How does POW labor relate to other sorts of coerced labor like serfs, slaves, and indentured servants? Footnote 6 One major aspect that POW labor has in common with indentured servitude is the time horizon involved. POWs and indentured servants knew they would be in the scheme for a limited time. While indentured servants would have had an idea of how long they were bound, POWs did not. In game-theoretic terms, POWs and indentured servants played a (repeated) finite game. Principally, given this game structure, no (strong) incentive exists to comply in the final period; recursively solved, no (strong) incentive exists to comply from the start. By contrast, being a slave or a serf was often a lifetime state. Therefore, slaves and serfs played a (repeated) infinite game. The difference in the time horizon between POWs and indentured servants, on the one side, and slaves and serfs, on the other, implies different incentives for complying with the work regime by regulating one’s work effort. These incentives alone might already explain a substantial part of the comparative productivity differences with slavery.
However, a difference also seems to have existed between indentured servants and POWs in detail, raising indentured servants’ motivation to work considerably above that of POWs. Indentured servants could shorten the time they would be bound in servitude by working harder and more productively. Alternatively, not complying would have meant being stuck in the game for another round. By contrast, POWs could not shorten their time in custody by working harder and possibly more productively. Thus, among all types of coerced labor, a POW probably has the least incentive to comply with the work regime, all else equal. This fact alone should lead to a much lower level of baseline motivation.
A related point separates POW labor from slavery, in particular. Since Fogel and Engerman’s (1974) study, the meaning and empirics of slave “maintenance” have been discussed extensively. A slave owner had an incentive to care to maintain a slave’s ability to work. Does this hold regarding POWs, too? Due to the short time horizon on the side of the POWs’ employers, we might doubt this possibility. Frameworks (such as The Hague Convention) prescribing basic care for POWs may have been in place, but POWs’ actual care was reduced to the absolute minimum (see the discussion in the subsequent section). Footnote 7
Finally, beyond the time horizon issue, war introduces a special element of “enemy” into the relationship between the principal and the POW, which is absent in other contexts of unfree labor. This element suggests a much greater level of extractive violence in POW settings than in slave or serf settings.
Fenoaltea’s (Reference Fenoaltea1984) transaction-cost model of (pre-industrial) slavery suggests that economic activity also matters for productivity. The model distinguishes “land- and effort-intensive activities,” in which “supervision can cheaply counter ill will,” from “capital- and care-intensive activities,” to which the opposite applies. It holds that “[s]upervision, threats, and high levels of anxiety will therefore enhance overall productivity in land- and effort-intensive activities but not in capital- and care-intensive activities” (Fenoaltea Reference Fenoaltea1984, pp. 667–68). Footnote 8 Because the model characterizes mining as a land- and therefore effort-intensive activity (Fenoaltea Reference Fenoaltea1984, p. 642), we may expect greater extractive violence toward POWs to be associated with higher levels of POW productivity. So, we face two opposing predictions when bringing together the time horizon and violence aspects, and we can test for which prediction works out.
HISTORICAL BACKGROUND ON RUHR COAL MINING DURING WWI
Stagnating Production and Growth-Retardant Factors
The economically unanticipated outbreak of the war was followed by immediate frictions not only in the supply of manpower but also in the supply of raw materials and intermediate goods leading to a stagnating coal production (Broadberry and Harrison 2005; Ziegler Reference Ziegler, Tenfelde, Berger and Seidel2013, pp. 30–48). First, coal could not be removed quickly enough from the mines to its consumers because of the over-allocated railway system (i.e., the competition with the military over transport capacity). The resulting stockpiles of coal led firms to lower the rate of extraction in the short term (Burghardt Reference Burghardt1988, p. 93; Ziegler Reference Ziegler, Tenfelde, Berger and Seidel2013, p. 37). Second, by 1913, 2 percent of Ruhr coal was extracted with mechanical support (primarily in the form of pneumatic picks), and the remaining 98 percent still by the use of manual labor in combination with explosives. Footnote 9 Originally, mining companies had planned to rapidly raise the degree of mechanization but were now reluctant to invest in new technologies underground because of the prevailing uncertainty about the length of the war. Consequently, the degree of mechanization at the coalface remained negligible (Burghardt Reference Burghardt1988, pp. 99–103; Jopp 2017, p. 949, Reference Jopp, Broadberry and Harrison2018). Third, the so-called Raubbau––that is, the over-exploitation of high-quality coal deposits originally developed for exploitation in the early 1920s––increased “asset erosion” (Burghardt Reference Burghardt1988, pp. 99–104).
In the longer term, measures implemented by the mining firms in 1915 to boost production and to offset the negative effect of the contraction in the workforce could only incompletely reverse the trend of decreasing output and productivity (see the next section on data). Those measures included increasing work time (more and longer shifts per head worked) and work intensity, as well as supplementing the regular workforce with less qualified labor. Therefore, female workers and juveniles below age 16 were allocated to a hitherto unprecedented amount to support activities on the surface (Rawe Reference Rawe, Seidel and Tenfelde2005a, pp. 38–40). According to Burghardt (Reference Burghardt1988, p. 94), the share of females in the Ruhr coal mines’ total workforce increases from 3.7 percent in 1913 to 4.3 percent in 1914, 7.1 percent in 1915, and 7.5 percent in 1916 before it decreased to 6.6 percent in 1917 and 5.8 percent in 1918. The share of juveniles jumped from 0 percent in 1915 and before to 3.0 percent in 1916, 5.0 percent in 1917, and 5.2 percent in 1918. In addition, miners who already had retired on invalidity were reactivated; and as the war continued, regular miners were increasingly called back from the fronts due to mining firms’ appeals.
Apart from domestic labor, the share of foreign laborers grew again, too. They consisted of (i) civilian labor migrants who voluntarily kept working in the Ruhr mines or who were hindered from migrating back to their home country, (ii) civilian deportees (e.g., from Belgium), and (iii) POWs (Rawe 2005c, p. 221). The former two groups are said to have accounted for roughly 0.5, 0.5, 6.3, 8.4, and 6.3 percent of the total workforce over 1914–18 (Rawe Reference Rawe2005b, p. 182). Compared with POWs, the share of female, juvenile, and foreign civilian workers of 16–20 percent in 1916 and after was also substantial. Footnote 10
Institutional Background on How POW Allocation Worked
Employing POWs remained voluntary throughout the war. Up until early 1915, businesses did not draw on the unexpectedly rapidly growing POW reservoir. For one reason, firms had safety concerns because they believed that accident rates would increase and POWs would engage in sabotage. In addition, the regular workforce, as well as the authorities, were concerned that employers would try to capitalize on the sudden extension of the labor market by lowering wages and social standards, which would have caused unrest at the home front. But these concerns were soon put aside in response to the changing demands of the war economy (Laufer Reference Laufer and Saarbrücken1993, p. 208; Rawe 2005a, p. 42–43, 46, Reference Rawe2005b, pp. 81–86; Klank Reference Klank2008, pp. 137–39). Unlike females and juveniles, POWs were allocated primarily to hewing and hauling coal underground. But only a small fraction of them were trained miners, likely making their labor less productive on average (Laufer Reference Laufer and Saarbrücken1993, p. 209; Rawe 2005a, pp. 46–47, Reference Rawe2005b, p. 111).
As pointed out in the introduction, we only have sparse anecdotal evidence on POW productivity. Mine owners complained about productivity being as low as 45–50 percent of regular miners’ productivity. The German POW regime, in general, had a built-in incentive inspiring firms to misreport their productivity estimates (Rawe Reference Rawe, Seidel and Tenfelde2005a, p. 48). According to The Hague Convention, firms were supposed to pay a POW what they paid a regular miner (Herbert Reference Herbert1997, p. 25). Three-quarters of that wage had to be paid directly to the army, which would save that amount to pay it out to the POW after the end of his captivity. The remaining quarter had to be directly paid to the POW. However, firms had the option to apply for a discount on the fraction of the wage paid to the army. To be eligible for such a discount, firms had to convince the army of the POWs’ inferior productivity (Rawe Reference Rawe, Seidel and Tenfelde2005a, p. 45, 2005c, p. 225). Unfortunately, no figures are available on claims made and claims granted. But the army seems to have become increasingly skeptical about the firms’ frequent complaints and their applications for discounts. The army made investigations into this issue, which is indirect evidence that the extent to which such claims were made must have been extensive. However, in the literature, it remains unclear whether the army traced this issue as planned (Rawe Reference Rawe, Seidel and Tenfelde2005a, pp. 48–9). Authorities would probably not have had the knowledge to independently cross-validate a firm’s POW productivity estimate, so they would rather have granted the discount than refused it. My approach can help shed light on the question of whether firms fell for the adverse incentive.
Treatment of POWs in Ruhr Coal Mining
When firms began applying to the army for POW assignments in early 1915, they had to pay for the POWs’ and their guards’ food, shelter, and wages out of their own pockets (Rawe Reference Rawe, Seidel and Tenfelde2005a, pp. 45–6). Mine owners had no experience with how to provide appropriate accommodation. They generally tried to implement and maintain the minimum security and amenities levels necessary to be eligible for POW deployments. Notwithstanding this general tendency, considerable between-mine differences in accommodation existed (Rawe Reference Rawe2005b, pp. 97–9). Footnote 11
Further, the reality of food provisioning was largely determined by the worsening food situation in the civilian population. Working in the mines was physically exhausting; therefore, miners certainly needed more caloric intake than the average worker. Although mine owners tried to secure a decent caloric intake and nutritional quality for their regular workforce, they saved on POWs (e.g., by outsourcing food provisioning), thereby following the general attitude in the population that POWs should not be better provided for than civilians (Rawe Reference Rawe2005b, p. 100). Thus, we can doubt that a POW’s actual daily caloric intake was anywhere near the administratively prescribed 2,700 kcal; the same goes for food quality (Rawe Reference Rawe2005b, pp. 100–101). Footnote 12
Poor accommodation, following the principle of keeping POWs closely together in one space whenever possible, and insufficient food provisioning provided ideal grounds for the spread of infectious diseases. Of all POWs who died in custody, 89 percent died from sickness (Hinz Reference Hinz2006, p. 239). The most frequent cause of death among the POW total was tuberculosis, which was more frequent among POWs from the East than those from the West (Hinz Reference Hinz2006, pp. 239–242; Ziegler Reference Ziegler, Tenfelde, Berger and Seidel2013, p. 33); the same holds for POWs deployed in Ruhr coal mining. Footnote 13
Originally, POWs had to be employed so that they stayed by themselves and were segregated from the regular German workforce. This work organization quickly became infeasible. POWs had to be integrated into the small teams in which miners were organized underground. Each team combined several hewers, haulers, and other auxiliary workers. German miners moved up the ranks in their teams, and POWs were principally exposed to maltreatment. Because team members’ wages varied with team outcome (i.e., the output of coal mined), regular miners had an incentive to bully POWs into exerting more work effort to strengthen the team (Rawe Reference Rawe2005b, pp. 111–12). Having primarily regular miners carry out supervision underground led to a high level of anxiety among POWs. The number of guards (older soldiers and soldiers burned out from the front) allocated to the mines was usually insufficient (Rawe Reference Rawe2005b, pp. 133–4). Authorities issued the directive not to resort to violence to punish a refusal to work and escape/sabotage attempts. But the degree to which German miners adhered to this directive is unclear (Rawe Reference Rawe2005b, pp. 139–42). Footnote 14
DATA
I start from the mine-level dataset introduced in Jopp (Reference Jopp2017) that covers the universe of Ruhr coal mines over the period 1913–38. There are 1,126 observations on all 194 mines that were operating between 1913 and 1918. Footnote 15 The dataset provides annual information on various mine characteristics as well as on characteristics of the firms owning the mines (see Table A.1 in the Online Appendix). The dataset substantiates to which of the 23 mining offices a mine belonged (location proxy), its annual coal output in tons, the number of total mineworkers employed, and the number of POWs supplementing the regular workforce over 1915–18. Unfortunately, the sources do not further disentangle a mine’s regular workforce into regular male adult workers, reactivated male retirees, female workers, and juveniles below age 16, or state the number of foreign civilian workers. This lack of detail makes studying the effects of substituting certain qualities of labor with others largely impossible.
The measures of interest for this study can be computed from the core dataset, namely, labor productivity (output per total worker per mine) and its growth rate, as well as the share of POWs in a mine’s total workforce (see the following subsection). Besides the core variables already mentioned, the dataset includes a mine’s age as well as the mother firm’s output and market share. A set of binary dummy variables indicate the mother firm’s legal form and whether it was state-owned, vertically integrated, and operated just a single mine. Footnote 16 Table 1 provides descriptive statistics on the variables included in the investigation, and Reference JoppJopp (2020) provides the dataset.
Table 1 DESCRIPTIVE STATISTICS ON ANNUAL OBSERVATIONS OVER 1913–18

Notes: See Table A.1 in the Online Appendix for variable definitions and units. A growth rate of, for example, –0.012 (see mine-output growth) equals a growth rate of –1.2 percent.
Sources: Author’s computations based on Reference JoppJopp (2020).
Let us turn to some stylized facts on production, employment, productivity, and POW employment. As of 1913, the Ruhr coal mines were producing the majority share of coal in the German Empire––114 million tons or 60 percent of the total; this share stayed fairly constant over the following war years. Footnote 17 Figure 1 sketches in three panels the macro story of Ruhr coal mining over the extended period from 1911–20. Footnote 18 After output had steadily increased from the middle of the nineteenth century on toward 1913, coal producers faced the first big crisis in the years 1914 and 1915, when production declined by around a quarter and fell below the level of 1911. Coal output then recovered to levels between 95 million and 99 million tons over the remaining war years (see Panel (a)). The obvious source of the decline in coal output was the net contraction of the workforce from 1913 to 1914 by 6 percent and from 1914 to 1915 by 23 percent; see Panel (b). Although this net contraction was primarily caused by enlisting many miners, it also reflects the following: (i) the migration of foreign mineworkers, who had voluntarily worked in the Ruhr mines, back into their home countries following the war’s outbreak (e.g., Dutch workers); (ii) the migration of German miners into other industrial sectors (due to higher wages in the industries even more directly related to the war effort); and (iii) increases in miners’ mortality as a consequence of (delayed) battle deaths, a worsening of the disease environment, and more fatal accidents due to increased work pressure and security neglect (Burghardt Reference Burghardt1988, p. 96; Rawe Reference Rawe, Seidel and Tenfelde2005a, p. 37; Jopp Reference Jopp2013, pp. 121, 124). From 1916 on, regular employment increased again and reached a plateau of 348,000 miners in the war’s last two years. The net contraction in regular miners was offset by allocating POW labor to the mines. About 17,400 (47,300; 55,100; 56,400) POWs were employed in 1915 (1916; 1917; 1918), corresponding to 5.6 percent (13.1 percent; 13.7 percent; 13.9 percent) of the total workforce. Footnote 19 Finally, Panel (c) shows the development of employment-weighted average labor productivity. From 1913 to 1914, labor productivity declined by 9 percent but recovered toward 1915––contrary to the trend in production and employment. By 1918, however, labor productivity had decreased by 15 percent.
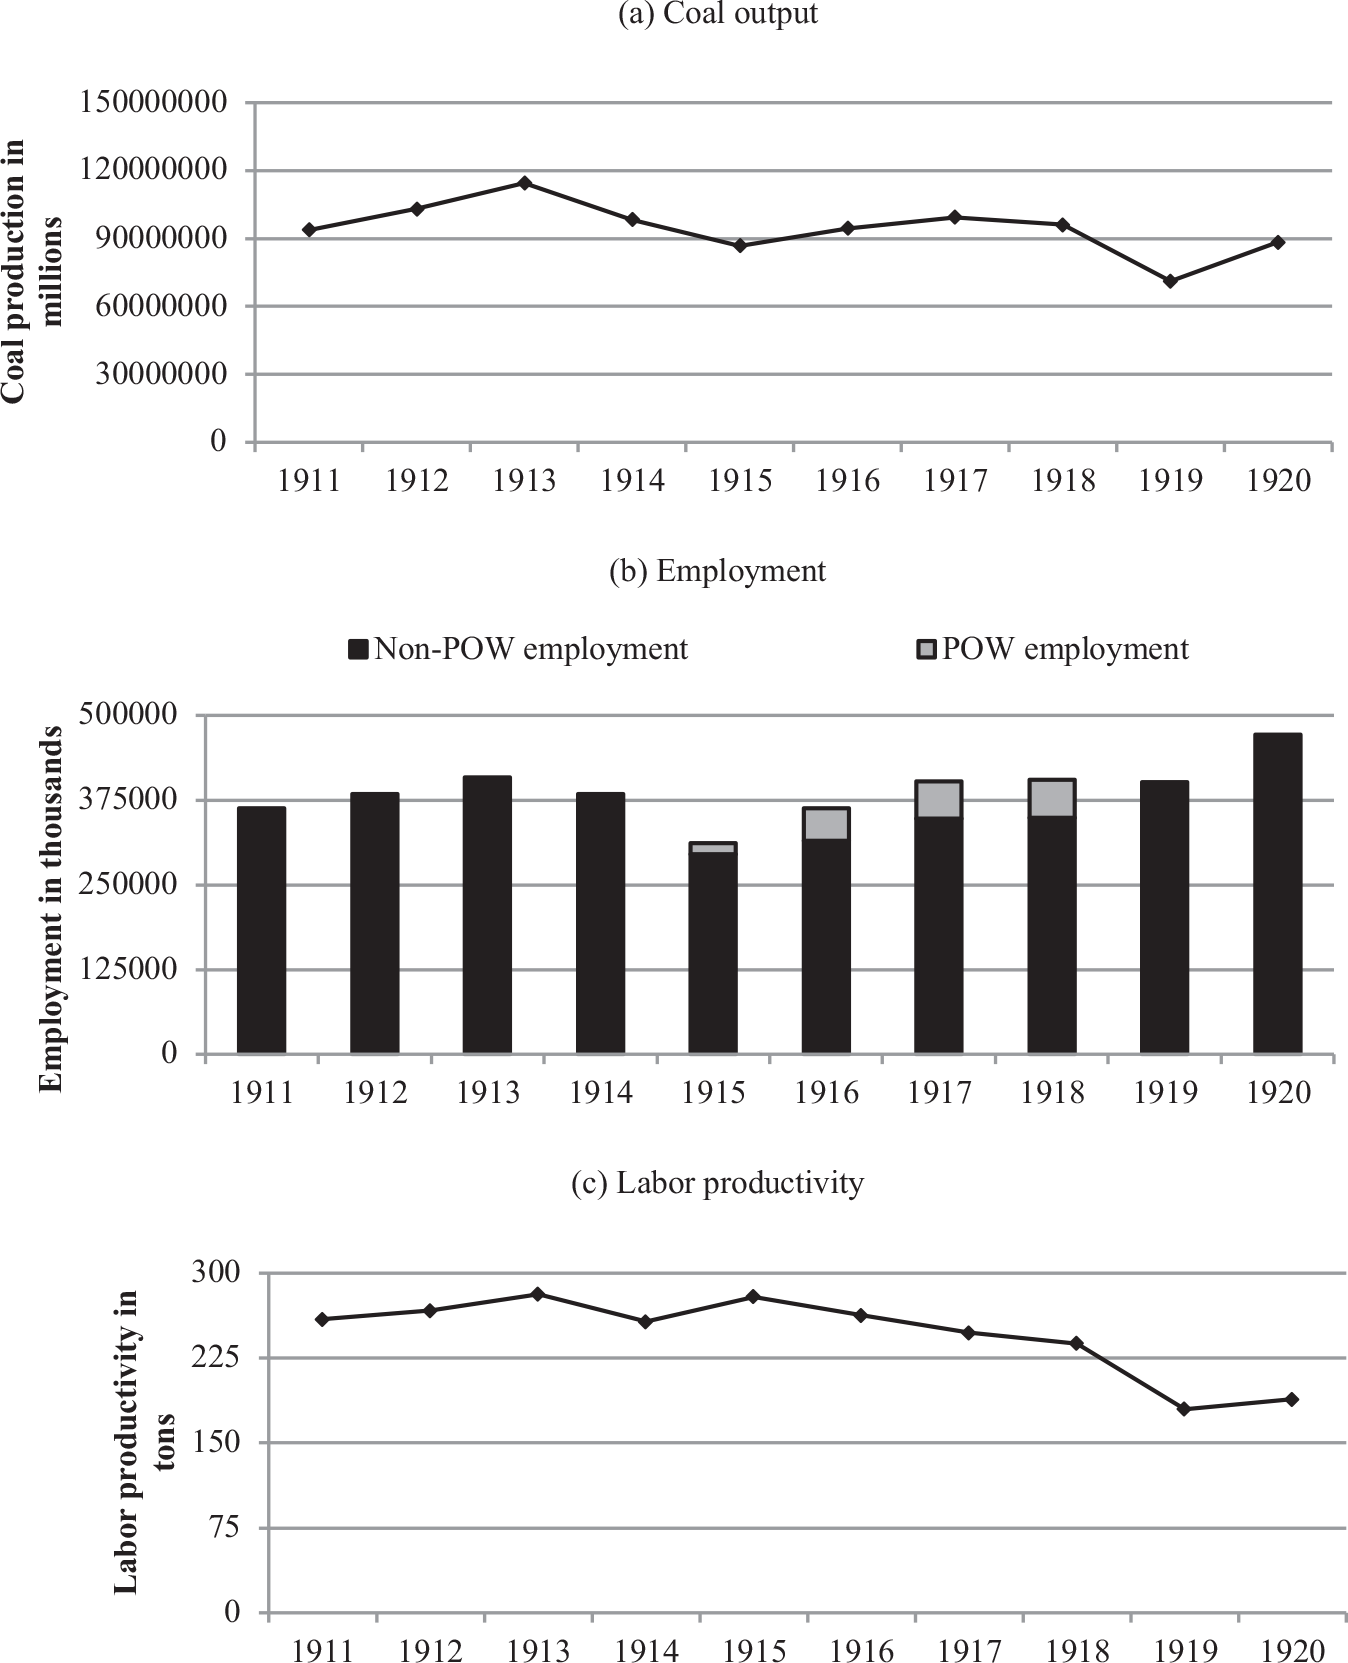
Figure 1 RUHR COAL MINING AROUND WORLD WAR I (1911–20)
Sources: Author’s depiction based on Reference JoppJopp (2020).
In addition, Tables 2 and 3 show how many Ruhr mines used POW labor during the war and to what extent. Specifically, Table 2 shows the annual distribution of mines over the mines’ POW share arranged into four classes. Footnote 20 Apparently, a fraction of mines did not use POW labor at all during the war. The figures also imply considerable cross-sectional variation in the POW share with slightly over 0 percent and up to 33 percent of a mine’s total employment––the maximum POW share in the data (see Table 1). Footnote 21 Table 3 shows for the subgroup of POW-employing mines how many of them started to use POWs in 1915, 1916, 1917, and 1918 and what the annual mean POW share and standard deviation were among the mines starting to employ POWs. For example, 119 mines started to employ POWs in 1915, and 34 started later. The mean POW share of those 119 mines had been 7.2 percent in 1915 and increased thereafter to 15.5 percent in 1918. The mean POW share among those 28 mines starting to employ POWs only from 1916 on was lower, but the variation was a little higher. Only six mines began to employ POWs as late as 1917 and 1918.
Table 2 THE NUMBER AND PROPORTION OF MINES BY POW SHARE AND YEAR (1915–1918)

Source: Author’s computations.
Table 3 MEAN POW SHARE BY START OF TREATMENT (IN PERCENT)

Source: Author’s computations.
METHODOLOGY
Because I observe both the mines that employed POWs and those that did not, it is revealing to use a treatment effects (TE) methodology, which rests on the potential outcomes framework (see Online Appendix I). Footnote 22 In my methodology, treatment is measured by mine-year pairs where the continuous variable POW share is greater than zero in any year 1915–1918, the treatment period (see Table 2). In an extension explained later, multiple treatments are defined expressing the intensity, with which treatment occurred mine by mine and year by year. Recall that, in my data, treatment per mine sets in at different dates (see Table 3). Hence, formally, the treatment group consists of four subgroups, which I refer to as “treatment cohorts” in the following; the treatment cohort of 1915 consequently consists of all mines that started to employ POWs in 1915, the cohort of 1916 consists of those mines that started in 1916, and so on. I limit my pre-treatment period to the years 1913 and 1914. Footnote 23
Model Selection
Unfortunately, the relevant historical literature has almost nothing to say about how firms selected mines for POW assignments. No hard evidence exists on the extent to which firms coordinated with each other on the subject. Footnote 24 Table 4 helps open the black box of firms’ decision-making a little. Displayed are the results of simple t-tests on differences in the mean across groups. I compare characteristics of the mines that never employed POWs with the characteristics of those mines that eventually employed POWs sometime in 1915–18 (the treatment group). The comparison is for the year 1914. The test results say that mines that would use POWs later were significantly different regarding five characteristics just before the intervention. First, they were, on average, more productive. Second, they were larger, both in terms of output and workforce. Third, they were significantly more likely to belong to vertically integrated mining firms, namely, metal-processing and steel-producing companies (e.g., the Gutehoffnungshütte) that owned mines to secure their necessary coal supply. These firms represented a significant share of German metal-processing and steel-production capacities. Fourth, they more likely owned only one mine (as vertically integrated mining firms often did). And fifth, their workforce did not contract as much because of the initial drafting of soldiers. Footnote 25
Table 4 CHARACTERISTICS OF MINES ACROSS GROUPS IN 1914––TREATMENT VERSUS NO TREATMENT

Notes: The table compares the 1914 values of the POW-employing mines with the 1914 values of those mines that did not employ POWs during the war. The results of t-tests on the equality of means across groups are shown. Unequal variance in the groups is assumed. Standard deviations are in square brackets and standard errors are in parentheses. Significance levels are as follows: * p<0.10, ** p<0.05, *** p<0.01.
Source: Author’s computations.
Table 4 supports the view that modeling both the selection and outcome processes explicitly is necessary. To account for the potential endogeneity of the treatment-assignment process, I apply IPWRA as discussed, for example, in Wooldridge (Reference Wooldridge2007, Reference Wooldridge2010, pp. 930–34) and Uysal (Reference Uysal2015). IPWRA simultaneously estimates a model for the treatment-assignment process and a model for the outcome process, under the assumption that treatment assignment is exogenous to outcome once it is controlled for all relevant confounders in the first step. Footnote 26 In this first step, the observational units’ propensity score––that is, the probability of being selected into treatment based on pre-treatment characteristics––is estimated via logit or probit regression. Footnote 27 The inverse of the propensity score is then used to weight a unit’s observation in the model of the outcome process. This weighting procedure is intended to balance the distribution of covariates such that, ideally, it is equal for treated and non-treated units, meaning both face the same ex-ante probability of being selected. This two-step procedure makes IPWRA a doubly robust procedure so that the treatment effect can be consistently estimated even if one of the two models may not be correctly specified; because misspecification is a likely problem occurring in empirical practice, the property of double robustness is a welcome means to lend more credibility to the estimation results.
Additional Choices
Applying IPWRA comes with restraints, requiring additional methodological choices. The first such choice concerns the dependent variable of the outcome process. Because observations are treated as pooled, we lose the advantage of incorporating fixed effects. This issue is problematic insofar as mines varied considerably in labor-productivity levels (see Table 1) owing in large part to systematic differences in geological conditions and, probably, differences in labor force composition even if we ignore POW labor. To level out systematic between-mine differences, I chose as dependent variable annual labor productivity growth in each year (i.e., growth from 1913 to 1914, 1914 to 1915, and so on). Furthermore, IPWRA does not allow for treatment to be continuous. Therefore, I estimated models on the two alternatives. First, treatment may be binary; that is, it only matters if a mine employed POWs or not. We lose all information embedded in the treatment intensity variable, though. Or, second, treatment may be handled as multivalued (e.g., Uysal Reference Uysal2015), meaning we use part of the information on treatment intensity embedded in POW share by defining a modest number of treatment levels 1, 2, and so on; each level represents a subrange of the POW share variable. I decided to use four treatment levels, including no treatment; these levels are defined as in Table 2 (level 1 = 0 percent; 0 percent < level 2 ≤ 10 percent; 10 percent < level 3 ≤ 20 percent; and level 4 > 20 percent). Footnote 28
EMPIRICAL FINDINGS
Table 5 summarizes the doubly robust estimation of the treatment effect of POW labor on annual labor productivity growth for both binary and multivalued treatment. I model labor-productivity growth as linearly dependent on the following set of covariates, X Outcome = [mine age, mine size, lagged labor productivity, mother firm’s market share, district-level capital intensity, district-level shifts per employee, district-level real wage]; the first four variables refer to the mine and the firm level, and the latter three are averages obtained for the Ruhr coal district (Jopp Reference Jopp2016). The intention behind including variables at the district level is to make partly up for the fact that IPWRA does not allow the inclusion of fixed effects. These variables somewhat resemble time-fixed effects in that they are common to all observational units but vary over time. The observations’ weights in the outcome regressions were retrieved from a logit regression explaining treatment assignment as dependent on the following set of covariates, W Selection = [lagged mine size, lagged labor productivity, vertically integrated firm, single-mine firm, lagged regular-employment growth, lagged mother firm’s market share]. Footnote 29 This choice is informed by the results of the mean comparison tests displayed in Table 4 and Table A.2 in the Online Appendix. Footnote 30 The auxiliary regressions along with tests of the basic identifying assumptions are shown in the Online Appendix. Footnote 31 I ran the auxiliary regressions after initially dropping all observations of zero output and thus zero labor productivity and, subsequently, all observations on a mine’s first, second, and last year if the mine had just begun operating or, respectively, was close to being shut down. Footnote 32
As a specification test, I ran a pre-test for the presence of endogeneity using the control-function approach as described in Wooldridge (Reference Wooldridge2010, pp. 945–50). The control-function approach considers the residuals from the treatment-assignment model as additional regressors in the outcome model and the estimation of the treatment effect. However, based on a Wald-test on non-zero correlations between both models, we cannot reject the null of no correlation. Hence, because treatment is exogenous, I consider the treatment-assignment process as correctly specified. This ensures that the IPRWA estimator yields the correct standard errors and that inferences are valid.
Table 5 SUMMARY RESULTS ON THE DOUBLY ROBUST ESTIMATION OF THE TREATMENT EFFECT

Notes: The number of observations is 993. The dependent variable in the underlying outcome model is labor-productivity growth. Robust standard errors are in parentheses. Results on auxiliary regressions are displayed in the Online Appendix. ATET is “average treatment effect on the treated.” POM is “potential-outcome mean.”
Source: Author’s computations.
Let us turn to the estimates of the average treatment effect on the treated (ATET) (see Online Appendix I) (Heckman and Vytlacil 2001, p. 107; Ho et al. Reference Ho, Kosuke, Gary and Stuart2007, p. 204; Smith and Sweetman 2016, p. 874). It states the effect of POW assignments on the labor productivity of those mines that factually employed POWs sometime during the war. In the simple case of binary treatment, the coefficient on the ATET has the expected sign and says that all mines that employed POWs saw 2.1 percent lower annual labor-productivity growth between 1913/14 and 1918 than they would have seen had they not employed POWs. The potential-outcome mean (POM) describes the baseline for the counterfactual, in which treatment was completely absent. It suggests 0.6 percent lower labor productivity growth. However, because both coefficients are statistically insignificant at conventional significance levels, the conclusions are not as clear. As an alternative, I use the multivalued treatment model, which makes use of the information on treatment intensity embedded in the POW share variable. The statistically significant coefficient estimates say that those mines, for which POW labor made up more than 10 percent of their total workforce, saw labor productivity decrease by 2.7 percent (treatment level 1) and 13.2 percent (treatment level 2), respectively, in net terms. Thus, the estimates of the multivalued treatment model provide evidence for the labor-productivity-depressing effect of POW assignments.
I have performed two robustness checks. The first was to assess what happens to the estimates if we keep the outliers where productivity is also measured for mines in their first, second, or last year of operation (see Table A.6 in the Online Appendix). As is evident, the treatment effect becomes much larger––too large to bear substantive meaning. Footnote 33 This lends support to my decision of excluding certain outliers. The second robustness check concerns the inclusion of post-war years as additional controls. I considered the inclusion of the years 1919 and 1920 (see Table A.7 in the Online Appendix). Both the binary and the multivalued treatment model suggest POW assignments depressed a mine’s labor productivity growth. However, in the multivalued treatment model, this effect only sets in for mines for which POWs made up more than 20 percent of their workforce. Thus, my basic conclusions, drawn for the ATET as given in Table 5, still hold, albeit for a higher POW share treatment threshold.
Let us turn to the three questions raised in the introduction. First, how large was the causal effect of POW labor on labor productivity compared to the combination of other factors mentioned in the section on the historical background, such as technical regress? From the multivalued treatment model in Table 5, we can calculate that a POW-employing mine experienced on average a productivity decline of –3.6 percent over the war or 0.9 percent per year. Footnote 34 Further, consider that average labor productivity among the POW-employing mines amounted to 267.2 tons in 1913/14 and 241.2 tons in 1918 implying, a net reduction in labor productivity over the war of 26.0 tons. Expressed in growth rates, this amounts to an overall decrease of –9.7 percent and, thus, to an annual decrease of roughly –2.5 percent. Thus, we can establish as suggestive evidence that about 36 percent of the average POW-employing mine’s annual labor-productivity decline (i.e., –0.9/–2.5) can be attributed to the use of POW labor alone. Footnote 35
This percentage implies that the representative POW was, indeed, much less productive than the representative regular miner. So, the second question is, by how much less? Based on the parameters from the doubly robust model, we can estimate relative POW productivity for 1918 and compare it with the available anecdotal evidence. Table 6 offers the counterfactual exercise needed.
Table 6 DERIVING RELATIVE POW PRODUCTIVITY FROM A COUNTERFACTUAL SCENARIO FOR 1918

Source: Author’s computations.
I start from the fact that the POM given in Table 5 states the average growth of mine-level productivity over 1913/14–18 if no mine had used POWs but had simply produced coal with the historically observable number of regular miners; that is, this counterfactual has no compensation for missing POWs. Following the finding that the POM is not significantly different from zero in both reported models, I assume average labor productivity would have stayed constant had no POWs been employed (1). In addition, we need an assumption on the level of labor productivity from which to start the exercise. I consider two scenarios: one using the unweighted average in the dataset (see Table 1) and one using the employment-weighted average (2). Footnote 36 Given the known historical employment of regular miners (4a), we can estimate counterfactual coal output (5) and the counterfactual coal gap (6) in both scenarios. Dividing the latter by historical POW employment (4b) yields counterfactual POW productivity in tons (7). Finally, by dividing regular miners’ productivity (2) by estimated POW productivity in tons (7), we arrive at an estimate of relative POW productivity (8) for each scenario. According to this counterfactual exercise, the representative POW only was between 22.4 and 42.1 percent as productive as the representative regular miner. The mean of roughly 32 percent may serve as a reasonable compromise estimate for 1918 and for the war as a whole. This percentage even undercuts the pessimistic assessment of 45–50 percent put forward in the literature.
The third question addressed concerns the size of POWs’ contribution to historical Ruhr coal output. The corresponding percentage for 1918 can be derived by dividing the estimated counterfactual coal gap by historical coal output given in Table 6. We arrive at percentages of 6.4 (scenario 1) and 3.5 (scenario 2) in the last year of the war. Multiplying the POW employment figures of 1915, 1916, and 1917 with estimated POW productivity in tons as given in Table 6 (59.7 and, respectively, 109 tons) and summing up, we arrive at 10.5 million and 19.2 million tons of coal supposedly produced by POWs over the war, depending on the scenario. In other words, POWs arguably contributed between 2.8 and 5.1 percent of coal in total or 3.9 percent as a compromise estimate.
Finally, contrary to the hypothesis derived from Fenoaltea’s (Reference Fenoaltea1984) transaction-cost model of slavery, POW labor was fairly unproductive in an environment expected to bring about highly productive forced labor. I propose two mutually non-exclusive explanations for this outcome. First, the time horizon of a POW’s “labor contract” indeed had a much more negative impact on the level of his baseline motivation than expected. Hence, extractive violence was not incentive compatible given the “labor contract’s” finite-time horizon. Apart from POWs’ unfamiliarity with the occupation, this effect was amplified by their reluctance to serve the enemy’s economic needs, resulting in attempts to refuse to work or at least to lower work intensity whenever possible. Second, the error in prediction may be caused by the classification of mining as a land- and therefore primarily effort-intensive activity. This classification neglects the fact that deep mining on coal (in Germany) also required experienced workers, which made mining care-intensive, too. In the latter case, pain incentives and intensive supervision are not supposed to maintain a high level of productivity. The care intensiveness seems to play a much greater role in coal mining, which is why the distinction of economic activities as either effort- or care-intensive thus seems to be too narrow a focus. Footnote 37
CONCLUSION
This paper provides the first quantitative assessment of the productivity effects of POW employment for a key sector of the German WWI economy, namely, hard coal mining. Because the Ruhr mines accounted for the majority share of total German coal output, my findings are representative of all German coal mining. My findings strongly support the view that the benefits from employing POW labor in the form of stabilizing output levels came at the expense of a loss in aggregate labor productivity. On average, more than a third of the average POW-employing mine’s labor productivity decline is attributable to POW labor. Although this finding leaves room for other factors being at play as well, POW employment indeed was an important driving force of mine-level productivity growth during WWI.
As a compromise estimate, POWs’ productivity expressed as a proportion of regular miners’ productivity was estimated at roughly 33 percent. Thus, it even undercuts the anecdotal evidence voicing 45–50 percent at the worst. This finding suggests that the anecdotal evidence mentioned in the literature is not representative of Ruhr mines as a whole, and it suggests that mining firms de facto did not understate POW productivity. However, my approach cannot rule out the possibility that mine owners still thought they were deceiving the authorities about POW productivity. Whether these findings also hold for other sectors of the war economy has yet to be shown.
My analysis also shows that assessing the productivity effects of POW labor in an industrial context is an ambivalent undertaking. On the one hand, one may reasonably suppose POWs’ productivity must have been considerably lower than regular workers’, thus driving down aggregate productivity. On the other hand, one also may suppose that exerting tough supervision, including occasional or even systematic violence, would have pushed POWs’, and thus aggregate productivity. However, my findings do not corroborate violence in any form to have been a powerful incentive. Notwithstanding POWs’ comparatively low productivity, the fraction they contributed to total Ruhr coal output over 1914–18––a share of around 3.9 percent––still seems to have been a valuable contribution to the German Empire’s war effort. Otherwise, the coal shortage would have been even more severe. Further inquiries into the profitability of POW labor may sharpen the picture beyond matters of productivity.


