INTRODUCTION
The Severn Estuary is the second largest estuary in the United Kingdom covering an area of 557 km2 that contains an intertidal area of 100 km2. When included with the Bristol Channel, the region becomes the largest estuarine system in the UK, with an area of 4800 km2 (Collins & Williams, Reference Collins and Williams1981). The estuary experiences the third highest tidal range in the world, exceeding 14.5 m at Avonmouth. This extreme tidal range supports a diversity of habitats, some of which are unique in the UK (Langston et al., Reference Langston, Chesman, Burt, Hawkins, Readman and Worsfold2003). The estuary has been proposed as a Special Area of Conservation (pSAC) (Langston et al., Reference Langston, Chesman, Burt, Hawkins, Readman and Worsfold2003) due partly to the fact that it provides an important habitat and migratory corridor for fish, including the European eel, Anguilla anguilla.
The life cycle of the European eel has seven principal stages. After hatching from eggs in the Sargasso Sea, the leptocephali are orientated eastwards by the Gulf Stream towards European and North African coasts. Having arrived on the continental shelf, leptocephali metamorphose into glass eels which colonize coastal and inland waters. Glass eels move into estuaries from coastal waters by means of passive tidal transport (Deelder, Reference Deelder1984; Tesch, Reference Tesch2003). At this stage their skin begins to develop pigmentation and they metamorphose into elvers. While some individuals remain in estuaries, or are recruited to coastal stocks, others migrate upstream into freshwater during their first year, or as juvenile yellow eels in subsequent years (White & Knights, Reference White and Knights1997b). It has also been shown that some eels never migrate into freshwater and spend their entire growth phase at sea or within estuarine waters (Daverat et al., Reference Daverat, Limburg, Thibault, Shiao, Dodson, Caron, Tzeng, Iizuka and Wickstrom2006). Those that migrate into freshwaters move upstream on the flood tides (Creutzberg, Reference Creutzberg1958) and are positively attracted to freshwater discharges (Deelder, Reference Deelder1958). After completing this growth phase, yellow eels metamorphose into silver eels and migrate back to the Sargasso Sea to spawn.
Since the early 1980s, recruitment of glass eels to European waters has shown a marked decline of up to 90% (Moriarty, Reference Moriarty1996; Dekker, Reference Dekker2000; ICES, 2002) and stocks are now considered to be in danger of collapse (Moriarty & Dekker, Reference Moriarty and Dekker1997; ICES, 2006). The upper Severn Estuary has traditionally supported a glass eel fishery but this has also declined in recent decades (White, Reference White1994; White & Knights, Reference White and Knights1994). The reduction in eel stocks is reflected in the fact that, from March, 2009, A. anguilla has been included in Appendix II of the Convention of International Trade in Endangered Species of wild fauna and flora (CITES, 2007). No single cause for this decline has been identified (Dekker et al., Reference Dekker, Casselman, Cairns, Tsukamoto, Jellyman and Lickers2003) but it is likely that a combination of factors are responsible. These may include habitat loss and degradation (Moriarty & Dekker, Reference Moriarty and Dekker1997; Feunteun, Reference Feunteun2002), parasitism (Kirk, Reference Kirk2003; Aguilar et al., Reference Aguilar, Alvarez, Leiro and Sanmartin2005), overfishing (Dekker, Reference Dekker2003), pollution (Amiard-Triquet et al., Reference Amiard-Triquet, Amiard, Andersen, Elie and Metayer1987; Knights, Reference Knights1997; McCleave, Reference McCleave2001; Feunteun, Reference Feunteun2002; Robinet & Feunteun, Reference Robinet and Feunteun2002), climatic changes in oceanic conditions (Castonguay et al., Reference Castonguay, Hodson, Moriarty, Drinkwater and Jessop1994; Desaunay & Guerault, Reference Desaunay and Guerault1997; McCleave et al., Reference McCleave, Brickley, O'Brien, Kistner, Wong, Gallagher and Watson1998; Knights, Reference Knights2003; Friedland et al., Reference Friedland, Miller and Knights2007; Bonhommeau et al., Reference Bonhommeau, Chassot and Rivot2008) and man-made barriers and impaired passage between marine and freshwater habitats (Moriarty & Dekker, Reference Moriarty and Dekker1997; White & Knights, Reference White and Knights1997a; McCleave, Reference McCleave2001).
Despite the marked decline in the recruitment of glass eels and the general view that yellow eel stocks are declining throughout Europe, Bark et al. (Reference Bark, Williams and Knights2007) have shown that yellow eel populations have remained stable in some UK river systems. They concluded that, despite declining levels of recruitment, many west coast rivers were still at, or near their carrying capacity. Indeed, this was found to be the case for tributaries of the River Severn that enter the upper estuary, where eel numbers remained stable from 1984 to 2004.
The current status of yellow eel populations in many rivers across Europe is well documented. In the UK, yellow eels are widely distributed throughout the catchment of the River Severn but they are also present within the Severn Estuary and Bristol Channel (Claridge et al., Reference Claridge, Potter and Hardisty1986; Potter et al., Reference Potter, Bird, Claridge, Clarke, Hyndes and Newton2001). Much less is known about the current status of these estuarine stocks due to the difficulty of sampling eels in this estuary.
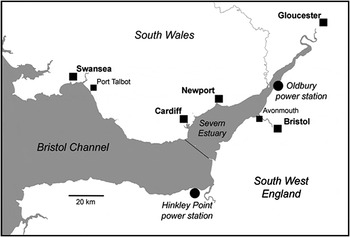
Data on eel abundance have been obtained for 29 years by monthly sampling from the cooling-water intake screens of the nuclear power station at Hinkley Point. Additional data have been obtained, over a three year period, from a similar installation at Oldbury in the upper Severn Estuary (Figure 1). This study describes the long-term variation in the number of yellow eels entrained at power stations within the Severn Estuary and Bristol Channel. It examines the relationship between the abundance of yellow eels and local variations in water temperature, salinity, tide and with changes in oceanic conditions related to the North Atlantic Oscillation Index (NAOI).

Fig. 1. The Severn Estuary and Bristol Channel showing the locations of Hinkley Point and Oldbury Nuclear power stations.
The NAOI is calculated as the difference between normalized sea level pressure over Gibraltar and south-west Iceland (Jones et al., Reference Jones, Jonsson and Wheeler1997) and was acquired from http://www.cru.uea.ac.uk/cru/data/nao.htm. This pressure difference exerts strong control over the climate of the northern hemisphere, especially in the winter. Jones et al. (Reference Jones, Jonsson and Wheeler1997) have suggested therefore, that the North Atlantic Oscillation Winter Index (NAOWI) is often a more useful measurement, calculated as the December to March average of NAOI monthly measurements. A positive index indicates low pressure over Iceland and high pressure towards Gibraltar. These conditions bring strong westerly winds to northern Europe that result in mild, wet winters. A negative index is generated when low pressure exists over Gibraltar and high pressure develops over south-west Iceland. This often results in northerly winds from north-west Europe and very cold winter weather. Changes in oceanic conditions, thought to be linked to the NAOI index, have been implicated in the decline of glass eel recruitment across Europe (Knights, Reference Knights2003; Friedland et al., Reference Friedland, Miller and Knights2007). Any subsequent impact on yellow eel stocks will depend on the oceanic conditions that prevailed at the time of recruitment to the estuary as glass eels.
MATERIALS AND METHODS
Yellow eels were collected from the cooling-water intake screens at Hinkley Point B power station, in the Bristol Channel, monthly between January 1981 and December 2009. Sampling was not carried out during October 1983 and 1988 or during December 1987 and1999 because of power station maintenance. In addition, a preliminary study was made in October and November 1980 to test for tidal and diurnal changes in the rate of capture. A further intensive study using daily samples was undertaken between November 1993 and February 1994 to study changes in the rate of capture with tidal height. Collections were also obtained from the screens at Oldbury power station in the Severn Estuary approximately once every two weeks between January 1996 and December 1998, except in July and August of 1998. At both power stations (Figure 1), yellow eels were captured and recorded as part of a long-term fish monitoring survey.
The strong tidal currents of the Bristol Channel make traditional sampling techniques difficult. Previous attempts to beam trawl within the estuary have been unsuccessful due to the depth and instability of the sediment in the estuary. The water-intake pipes of power stations provide a permanent sampling point and an effective sampling mechanism that allows long-term quantitative sampling of estuarine fish communities (Henderson & Holmes, Reference Henderson and Holmes1991).
Hinkley Point
The cooling-water intake at Hinkley Point B power station consists of a 3.45 m diameter pipe situated 640 m offshore rising vertically up from the seabed. Minimum water depth at the intake is 3 m. Water is pumped into the station by means of four centrifugal pumps each delivering a constant 7.5 m3 s−1 (Henderson, Reference Henderson1989) and filtered through four metal screens (10 × 10 mm square mesh). On each visit, the samples were obtained from two operational filter screens. The capture rates of conger eels, Conger conger, the only other eel in the Bristol Channel, were also recorded to help establish whether any long term changes in the abundance of anguillids were species specific. The screens retain all yellow eels and conger eels of standard length greater than approximately 250 mm (Turnpenny, Reference Turnpenny1981).
To minimize possible tidal effects, the standard monthly sampling date at Hinkley Point was not fixed, but chosen to fall halfway between spring and neap tides, with sampling beginning at high-water. The number of eels recorded from two screens over a 6 hours period represents a total water volume of 3.24 × 10⁵ m3, which equates to 15 m3 s−1. This volume did not vary over the entire sampling period. Depending on the tidal cycle, sampling commenced between 11:00 and 13:00 hours and was completed during daylight.
Mean monthly water temperature data, recorded by Hinkley Point power station, was obtained from http://www.cefas.co.uk/data/sea-temperature-and-salinity-trends.aspx. Salinity was measured, on each sampling date, using a refractometer one hour before low water.
Sampling during October and November 1980 and between November 1993 and March 1994 was undertaken in a similar fashion to the regular monthly work, but was not planned to cover an average tide working from high to low water. Rather these studies were designed to encompass the full range of tidal and day/night conditions.
Oldbury
The cooling-water intake at Oldbury power station is located near the shore of the inner Severn Estuary on the seabed within a deep water channel. Water is pumped into the station by means of four pumps, each delivering a constant 6.63 m3 s−1 (Henderson, Reference Henderson1989) and filtered through four metal drum screens consisting of 10 × 10 mm square mesh. Fish, crustaceans, seaweed and other debris that collect on the screens, are washed off into hoppers and sluiced into collecting baskets for disposal. The total number of yellow eels washed off the screens over a period of 24 hours was recorded by sorting through debris in the collecting baskets. The number was adjusted to a standardized intake water volume of 1.72 × 10⁶ m3 day−1, which equates to a flow, as delivered by three pumps, of 20 m3 s−1.
Mean monthly water temperatures were obtained from continuous records supplied by the power station staff at Oldbury and salinity values derived from measurements of conductivity obtained on each sampling occasion.
The von Bertalanffy growth curve calculated for yellow eels from the Severn Estuary (Bird et al., Reference Bird, Rotchell, Hesp, Newton, Hall and Potter2008) was used to estimate the ages of all yellow eels from Hinkley Point. The total numbers of eels present in all samples were compared with the NAOWI that corresponded to the year these individuals are likely to have entered the estuary as glass eels.
RESULTS
Size and age distribution
Figure 2 shows the size distribution of elvers (black bars) and yellow eels (grey bars) observed at Hinkley Point between 1980 and 2009 inclusive. The modal size-class was 300–340 mm and the maximum recorded length was 770 mm. The yellow eel size distribution was found to fit by regression (adjusted R2 = 0.82) a log normal distribution of the form:
where f is the frequency and x the length in mm.

Fig. 2. Length–frequency of eels caught at Hinkley Point 1980–2009. Data allocated into 40 mm size-classes. Elvers and newly pigmented eels are shown in black, the yellow eel population in light grey. A log normal distribution was fitted to the yellow eel size distribution by regression.
Sufficient observations were available for Hinkley Point to examine the change in mean length through time. Over the three decades commencing 1980, 1990 and 2000 the means and standard deviations were 411.3 ± 92.0 mm; 414.0±144.5 mm and 398.5 ± 99.85 mm respectively. Analysis of variance using log-transformed data found no significant difference in the mean size of the eels (F2.136 = 0.183, P = 0.83).
Bird et al. (Reference Bird, Rotchell, Hesp, Newton, Hall and Potter2008) from a study of otoliths found the average lengths of eel at age 2, 5, 10 and 20 years after the glass eel stage to be 199, 323, 439 and 498 mm, respectively. Assuming that Bridgwater Bay eels conform to the growth curve observed at Oldbury, Hinkley Point eels ranged from 2 to > 25 years in age. Both Oldbury and Hinkley hold populations with a similar size distribution.
Seasonal variation in captures
Yellow eels are present in Bridgwater Bay in all months of the year, but are far more abundant during autumn and winter, showing two seasonal peaks in November and March and an annual minimum in May (Figure 3).

Fig. 3. The average seasonal capture (in 6 hour monthly samples) of yellow eels at Hinkley Point, Bridgwater Bay. Data collected between January 1981 and December 2009.
Data from Oldbury power station between 1996 and 1998 showed that the maximum number of yellow eels in the monthly samples was not consistently associated with any particular season, but they tended to be in lowest abundance between January and March (Figure 4). Peaks in abundance occurred in July 1996, May 1997 and April 1998.

Fig. 4. The number of European yellow eels recovered from the water-intake screens at Oldbury nuclear power station in the Severn Estuary. Eels were collected approximately every two weeks and are the total number of individuals entrained over the previous 24 hours. Note that no samples were obtained in July and August 1998.
Salinity and temperature
There was no relationship between the number of eels in monthly samples from Hinkley Point and either the mean monthly water temperature or the salinity (Figure 5). The records from Oldbury show that comparatively few yellow eels were present at this site during the winter when the water temperature was below 5°C. This probably reflects low levels of activity and reduced energetic requirements of eels in cold water. Similarly, few yellow eels were present at Oldbury when the salinity was <15‰. This is below the salinity minimum for Hinkley Point of 18‰.

Fig. 5. The relationship between the numbers of European yellow eels entrained at Oldbury and Hinkley Point nuclear power stations and the water temperature and salinity. At Oldbury the eels were collected in samples extending over 24 hours, while at Hinkley Point samples were obtained over 6 hourrs (see Materials and Methods for further details).
Diurnal and tidal variation in capture rates at Hinkley Point
In October and November 1980 hourly sampling programmes of 22 and 23 hours duration respectively, were undertaken to test for the effects of tidal height and daylight on eel capture. A general linear model of the form:
with tidal height as a continuous variable and light and month as fixed categorical variables demonstrated that only tidal height was a significant explanatory variable (Table 1). Eel capture rate increased as the tidal height decreased.
Table 1. Unique effects analysis of variance table generated using a general linear model, to test for the effect of tide and light on the number of eels captured at Hinkley Point.

Between 9 November 1993 and 11 February 1994 an intensive study was undertaken to study the change in eel abundance with tidal height. Hourly samples at Hinkley Point power station were typically collected for 6 consecutive hours per day for 41 days giving a total of 242 hourly samples. The plots of the number of eels captured against tidal height for each month are given in Figure 6 and clearly show that eels are usually only caught when the tidal height is lower than 6 m chart datum. The maximum rates of capture occurred at low spring tides (tidal heights < 2.5 m chart datum).

Fig. 6. The variation in hourly catch rates of eel with tidal height for the months November to February 1993–1994. For each day, 6 samples of 1 hour duration were collected, generally between 10:00 and 17:00 hours.
Abundance and the North Atlantic Oscillation
When the annual value of the NAOWI was plotted against the estimated total number of glass eels that would have entered the estuary in that year, no significant correlation between the NAOWI and glass eel recruitment was found (Spearman rank correlation coefficient = 0.242, P = 0.231).
Long-term decline in abundance
Figure 7A shows the long-term decline in the number of yellow eels captured each year since January 1981. This decline was modelled by fitting using regression analysis the exponential equation:
where Abundance is the total number captured over 12 monthly samples and t is time in years. The adjusted coefficient of determination (R2) was 0.75 indicating that an exponential model gave a good fit to the data. This equation gives an estimated average decline in abundance of about 15% per annum giving a total decline since 1980 of about 99%.

Fig. 7. The change in the rate of capture of eels at Hinkley Point B nuclear power station since 1980. (A) The decline in the annual catch of yellow eel, Anguilla anguilla—the exponential curve was fitted by regression; (B) the annual catch of conger eel, Conger conger.
For the standard monthly sampling, the greatest numbers of yellow eels collected at Hinkley Point between 1981 and 2010 were obtained in 1981 and 1982 when 44 and 61 individuals were recorded, respectively (Figure 7A). The annual total declined markedly in 1983 and, despite subsequent small fluctuations from year to year, the total number of yellow eels continued to decline thereafter. Each year since 1991, the annual total never exceeded 10 and since 2002 it never exceeded 5. In 2009 no eels were caught during the standard sampling programme. In contrast, the number of conger eels captured over the same period, using the same sampling methodology, does not show a consistent decline but mostly ranged between 4 and 18 (Figure 7B). The only notable deviation occurred in 2002 when an exceptional 53 conger eels were captured (Figure 7B). The reason for this peak is unknown.
There is additional evidence that abundance in 1980 was also appreciably higher than that observed since 2000 as samples collected in October and November 1980 recorded 47 and 18 yellow eels respectively. On 2 October 1980 over the 3 hours around low water, 34 yellow eels were caught, more than has subsequently been recorded during regular sampling for any year since 1982.
DISCUSSION
The size-range of eels caught at Hinkley Point in the lower estuary are similar to those reported by Bird et al. (Reference Bird, Rotchell, Hesp, Newton, Hall and Potter2008) for Oldbury in the inner estuary and indicate that yellow eels from 2 to more than 25 years of age are living in estuarine waters, at least for part of the year. The pattern of capture at Hinkley Point with maximum rates occurring at low water spring tides suggests that eels occupy intertidal habitat when available. This view is supported by the historically frequent capture of eel by the fixed net fishermen at Stolford who set nets to capture fish retreating from the Stert flats on the receding tide. In addition, it is also possible eels are moving down estuary and out of the River Parrat at low water and concentrating in the vicinity of the intake.
The long-term study at Hinkley Point is based on 6 hourly samples collected typically between 12:00 and 18:00 hours. Initial studies in October and November 1980 found a powerful tidal influence and no diurnal differences in the rate of capture. It has also been found that the capture of many demersal fish is not influenced by the day/night cycle at Hinkley Point (Henderson & Holmes, Reference Henderson and Holmes1991). There are good reasons why European eels are likely to be active throughout the diurnal cycle at Hinkley Point. First, tidal conditions in the Bristol Channel result in suspended solids of up to 3 g l−1 and this restricts light penetration to a depth of only 50 cm below the surface. Secondly, the available evidence suggests that eels favour living on the intertidal flats. They must leave this region at low tide irrespective of the time of day.
The rate of capture at Hinkley Point is highly seasonal with yellow eel occupying the intertidal flats in greatest abundance during the autumn and winter. We have no information as to where these eels move to in the summer, but their association with shallow waters suggests they may be entering the upper estuary of the River Parrat or even freshwaters in the Somerset levels. It is notable that few eels are caught at Oldbury during January (Figure 4) suggesting that, during winter, yellow eels may migrate down estuary to more marine, warmer, waters. The records from Oldbury show that comparatively few yellow eels were present in samples from this site when the water temperature was below 5°C (Figure 5). This probably reflects low levels of activity and reduced energetic requirements of eels in cold water. Similarly, few yellow eels were present when the salinity was <15‰ (Figure 5).
Regular monitoring for 29 years at Hinkley Point power station provides unequivocal evidence that a severe decline in yellow eel abundance has occurred in the Bristol Channel since the 1980s (Figure 7A). The average rate of decline appears to be approximately 15% per annum which is amongst the greatest long-term rates of population decline ever reported for a fish. Abundance in Bridgwater Bay is presently estimated to have declined by 99% from the 1980 level. Hutchings & Reynolds (Reference Hutchings and Reynolds2004) in a review of 230 exploited marine fish populations reveal a median reduction of 83% in breeding population size from known historic levels. The greatest reduction they report is 99.9% over 30 years for a Canadian population of cod, Gadus morhua. This is, however, for a single stock and the species as a whole, while greatly diminished, has not suffered this level of attrition. The decline in eel that we report is one of the greatest ever reported for a fish and can justifiably be termed a population collapse. The decline of yellow eels within the Bristol Channel is unlikely to be an artefact caused by a loss of sampling efficiency, if this were the case a similar decline would be observed in other species of similar form, the number of conger eels shows no such decline (Figure 7B). Further, as recently reported by Henderson & Bird (Reference Henderson and Bird2010), many fish and crustaceans in Bridgwater Bay have maintained stable or increasing populations over the last 30 years. Dekker (Reference Dekker2000) has similarly observed a steep decline in glass eel recruitment in most European estuaries from 1980 onwards. The yellow eel population of the Bristol Channel has paralleled this European decline.
Given the great decline in abundance, it was anticipated that the mean size and age structure of the yellow eel population in Bridgwater Bay would have changed over the last 30 years. A collapse in eel recruitment would be expected to result in a population with a progressively increasing average age and individual length. A comparison of the size distribution over three decades commencing 1980, 1990 and 2000 revealed no significant difference in mean size. Over each decade yellow eel size distribution ranged from 200 to >600 mm total length. This surprising observation suggests that there has not been a sudden recruitment failure. For the size structure to have remained stable over such a long period indicates that both the age specific rates of population increase, generated by recruitment and immigration and the age specific rates of population decline, from mortality and emigration, have remained approximately constant. It is possible that as eel numbers declined individual growth accelerated so that the age of eels in each size-category declined. However, such a response would almost inevitably change the size distribution. The observed decline covers all ages (sizes) and is therefore most likely to be because for an extended period of at least 29 years losses have consistently exceeded the gains without any violent change in recruitment, growth or mortality rate. If the observed population decline was only restricted to eels in the Severn Estuary then a change in local recruitment or immigration would be viewed as plausible or even likely. However, the widespread reports of eel decline strongly suggest that there has been a long-term failure of recruitment to compensate for losses. Our data suggest that this recruitment failure has probably been ongoing for considerably more than the last 30 years.
There have been reports that eel recruitment may be influenced by environmental variables with the widespread decline in glass eel recruitment across Europe as a result of a change in oceanic conditions, that has affected the abundance and survival of eels during their marine phase (Castonguay et al., Reference Castonguay, Hodson, Moriarty, Drinkwater and Jessop1994; Desaunay & Guerault, Reference Desaunay and Guerault1997; McCleave et al., Reference McCleave, Brickley, O'Brien, Kistner, Wong, Gallagher and Watson1998; Friedland et al., Reference Friedland, Miller and Knights2007; Bonhommeau et al., Reference Bonhommeau, Chassot and Rivot2008). The present study has found no evidence that the decline in abundance of yellow eel is related to changes in the North Atlantic Oscillation.
The dramatic decline of yellow eels within the Bristol Channel contrasts with the findings of Bark et al. (Reference Bark, Williams and Knights2007) for the tributaries of the upper Severn Estuary, in which sampling was carried out during 1998, 1999 and from 2002 to 2004. This study concluded that the estuary's upper tributaries were at, or approaching their carrying capacity and stressed the importance of later life stage recruitment from estuaries in maintaining freshwater stocks. It would appear from the data presented in Figure 7 that if the River Severn relies on recruitment of yellow eels from its estuary and the Bristol Channel, then a future decline in the associated riverine stock may be expected. In the short term, however, the freshwater population of the River Severn may remain stable if it is regulated primarily by in-stream density-dependence. This occurs when previous levels of high recruitment result in an over-saturation of suitable habitats within a river. Subsequent years of reduced recruitment result in vacant habitats, reduced competition and a lower rate of mortality and as a result, the population remains stable (Feunteun et al., Reference Feunteun, Laffaille, Robinet, Briand, Baisez, Olivier, Acou, Aida, Tsukamoto and Yamauchi2003). This has shown to be the case in a long-term study of Rio Esva (Asturias, north-western Spain), where despite the decline in abundance of yellow eels within the estuary following a decline of glass eel recruitment, freshwater population numbers have increased (Lobon-Cervia & Iglesias, Reference Lobon-Cervia and Iglesias2008).
The present study gives support to the view that we are presently witnessing a general collapse in European eel populations. Our data offers no indication as to the cause of this disaster. However, it does suggest that the collapse has been underway for 30 or more years and is not linked to any quasi-cyclical event such as the North Atlantic Oscillation. It is possible that the decline of the European eel is the result of a combination of factors which have reduced eel survival and now made the eel life-style non-sustainable. It does seem likely that the actions of man are involved in this collapse and that a major improvement in eel survival to adulthood must be engineered if the European eel is not to fade away to extinction. This would likely involve action on a number of fronts all of which increase survival. First, there needs to be a cessation of elver fishing, which in recent years has become highly lucrative as the price of elvers increased with their scarcity. Second, a reduction in the volume of estuarine water extracted for power station cooling and other purposes. This would reduce the number of elvers which pass through the condenser circuits and are killed. It would also reduce the number of large eels migrating back to the sea that are impinged and killed on the filter screens. The standard use of fish return systems on cooling water intakes would also reduce accidental deaths on filter screens. Finally, there needs to be an assessment for all water bodies of the presence of obstructions such as weirs and pumps which increase mortality during migration. By making water bodies more eel friendly and diverting them away from danger considerable reductions in mortality may be possible. These actions would need to be undertaken over Western Europe if a positive impact were to be produced on such a widely distributed species.
ACKNOWLEDGEMENTS
The authors would like to thank staff at Hinkley Point and Oldbury power stations for their assistance in sampling. S.J.P. was supported by a bursary funded by the Esmee Fairbairn Foundation and the School of Life Sciences, University of the West of England, Bristol. The authors would like to thank the team who have undertaken the long-term sampling at Hinkley including Dr Richard Seaby, Mr Robin Somes, Dr Roger Bamber, Ms Rowena Henderson and Mr Roger Holmes.