


Introduction
Much attention is currently being given to tropical forests as they contain 40–50% of the carbon stored in the terrestrial vegetation (Pan et al. Reference Pan, Birdsey, Fang, Houghton, Kauppi, Kurz, Phillips, Shvidenko, Lewis, Canadell, Ciais, Jackson, Pacala, McGuire, Piao, Rautiainen, Sitch and Hayes2011), storing an estimated 285 Pg of carbon in the aboveground biomass (AGB) (Feldpausch et al. Reference Feldpausch, Lloyd, Lewis, Brienen, Gloor, Monteagudo Mendoza, Lopez-Gonzalez, Banin, Abu Salim, Affum-Baffoe, Alexiades, Almeida, Amaral, Andrade, Aragão, Araujo Murakami, Arets, Arroyo, Aymard, Baker, Bánki, Berry, Cardozo, Chave, Comiskey, Alvarez, De Oliveira, Di Fiore, Djagbletey, Domingues, Erwin, Fearnside, França, Freitas, Higuchi, Honorio, Iida, Jiménez, Kassim, Killeen, Laurance, Lovett, Malhi, Marimon, Marimon-Junior, Lenza, Marshall, Mendoza, Metcalfe, Mitchard, Neill, Nelson, Nilus, Nogueira, Parada, Peh, Pena Cruz, Peñuela, Pitman, Prieto, Quesada, Ramírez, Ramírez-Angulo, Reitsma, Rudas, Saiz, Salomão, Schwarz, Silva, Silva-Espejo, Silveira, Sonké, Stropp, Taedoumg, Tan, Ter Steege, Terborgh, Torello-Raventos, Van Der Heijden, Vásquez, Vilanova, Vos, White, Willcock, Woell and Phillips2012). Tropical deforestation and degradation account for more than 10% of global anthropogenic greenhouse gas emissions (Achard et al. Reference Achard, Beuchle, Mayaux, Stibig, Bodart, Brink, Carboni, Desclée, Donnay, Eva, Lupi, Raši, Seliger and Simonetti2014). However, there are still large uncertainties associated with tropical forest carbon stock estimations. Accurate quantification and assessment of carbon stocks in forest vegetation underpin policies that aim to mitigate carbon dioxide emissions such as the UN-REDD+ program and the recommendations of the Intergovernmental Panel on Climate Change (Gibbs et al. Reference Gibbs, Brown, Niles and Foley2007).
Forest monitoring programs require non-destructive methods for estimating plot and tree AGB (Gibbs et al. Reference Gibbs, Brown, Niles and Foley2007). AGB equations that estimate individual tree AGB have been developed for tropical forest trees (Feldpausch et al. Reference Feldpausch, Lloyd, Lewis, Brienen, Gloor, Monteagudo Mendoza, Lopez-Gonzalez, Banin, Abu Salim, Affum-Baffoe, Alexiades, Almeida, Amaral, Andrade, Aragão, Araujo Murakami, Arets, Arroyo, Aymard, Baker, Bánki, Berry, Cardozo, Chave, Comiskey, Alvarez, De Oliveira, Di Fiore, Djagbletey, Domingues, Erwin, Fearnside, França, Freitas, Higuchi, Honorio, Iida, Jiménez, Kassim, Killeen, Laurance, Lovett, Malhi, Marimon, Marimon-Junior, Lenza, Marshall, Mendoza, Metcalfe, Mitchard, Neill, Nelson, Nilus, Nogueira, Parada, Peh, Pena Cruz, Peñuela, Pitman, Prieto, Quesada, Ramírez, Ramírez-Angulo, Reitsma, Rudas, Saiz, Salomão, Schwarz, Silva, Silva-Espejo, Silveira, Sonké, Stropp, Taedoumg, Tan, Ter Steege, Terborgh, Torello-Raventos, Van Der Heijden, Vásquez, Vilanova, Vos, White, Willcock, Woell and Phillips2012; Chave et al. Reference Chave, Réjou-Méchain, Búrquez, Chidumayo, Colgan, Delitti, Duque, Eid, Fearnside, Goodman, Henry, Martínez-Yrízar, Mugasha, Muller-Landau, Mencuccini, Nelson, Ngomanda, Nogueira, Ortiz-Malavassi, Pélissier, Ploton, Ryan, Saldarriaga and Vieilledent2014; Fayolle et al. Reference Fayolle, Ngomanda, Mbasi, Barbier, Bocko, Boyemba, Couteron, Fonton, Kamdem, Katembo, Kondaoule, Loumeto, Maïdou, Mankou, Mengui, Mofack, Moundounga, Moundounga, Nguimbous, Nsue Nchama, Obiang, Ondo Meye Asue, Picard, Rossi, Senguela, Sonké, Viard, Yongo, Zapfack and Medjibe2018), and the choice of an appropriate AGB equation has been demonstrated to be a critical step (Chave et al. 2004; Molto et al. Reference Molto, Hérault, Boreux, Daullet, Rousteau and Rossi2014). The pantropical AGB equations, developed by Chave et al. (Reference Chave, Andalo, Brown, Cairns, Chambers, Eamus, Fölster, Fromard, Higuchi, Kira, Lescure, Nelson, Ogawa, Puig, Riéra and Yamakura2005) and revised by Chave et al. (Reference Chave, Réjou-Méchain, Búrquez, Chidumayo, Colgan, Delitti, Duque, Eid, Fearnside, Goodman, Henry, Martínez-Yrízar, Mugasha, Muller-Landau, Mencuccini, Nelson, Ngomanda, Nogueira, Ortiz-Malavassi, Pélissier, Ploton, Ryan, Saldarriaga and Vieilledent2014), have been used to convert forest inventory data into estimates of AGB and, thus, aboveground carbon stocks. Recently, the pantropical AGB equation of Chave et al. (Reference Chave, Réjou-Méchain, Búrquez, Chidumayo, Colgan, Delitti, Duque, Eid, Fearnside, Goodman, Henry, Martínez-Yrízar, Mugasha, Muller-Landau, Mencuccini, Nelson, Ngomanda, Nogueira, Ortiz-Malavassi, Pélissier, Ploton, Ryan, Saldarriaga and Vieilledent2014) has been validated by performing the largest ever destructive sampling in Central Africa (an historically understudied forested region), and the estimated coefficients of the allometric model for Central African forests were quite close to pantropical coefficients (Fayolle et al. Reference Fayolle, Ngomanda, Mbasi, Barbier, Bocko, Boyemba, Couteron, Fonton, Kamdem, Katembo, Kondaoule, Loumeto, Maïdou, Mankou, Mengui, Mofack, Moundounga, Moundounga, Nguimbous, Nsue Nchama, Obiang, Ondo Meye Asue, Picard, Rossi, Senguela, Sonké, Viard, Yongo, Zapfack and Medjibe2018). In addition to tree diameter and wood density, the most accurate AGB equations include tree height as a dependent variable. When tree height is not available, AGB estimation errors are usually large (Feldpausch et al. Reference Feldpausch, Lloyd, Lewis, Brienen, Gloor, Monteagudo Mendoza, Lopez-Gonzalez, Banin, Abu Salim, Affum-Baffoe, Alexiades, Almeida, Amaral, Andrade, Aragão, Araujo Murakami, Arets, Arroyo, Aymard, Baker, Bánki, Berry, Cardozo, Chave, Comiskey, Alvarez, De Oliveira, Di Fiore, Djagbletey, Domingues, Erwin, Fearnside, França, Freitas, Higuchi, Honorio, Iida, Jiménez, Kassim, Killeen, Laurance, Lovett, Malhi, Marimon, Marimon-Junior, Lenza, Marshall, Mendoza, Metcalfe, Mitchard, Neill, Nelson, Nilus, Nogueira, Parada, Peh, Pena Cruz, Peñuela, Pitman, Prieto, Quesada, Ramírez, Ramírez-Angulo, Reitsma, Rudas, Saiz, Salomão, Schwarz, Silva, Silva-Espejo, Silveira, Sonké, Stropp, Taedoumg, Tan, Ter Steege, Terborgh, Torello-Raventos, Van Der Heijden, Vásquez, Vilanova, Vos, White, Willcock, Woell and Phillips2012; Chave et al. Reference Chave, Réjou-Méchain, Búrquez, Chidumayo, Colgan, Delitti, Duque, Eid, Fearnside, Goodman, Henry, Martínez-Yrízar, Mugasha, Muller-Landau, Mencuccini, Nelson, Ngomanda, Nogueira, Ortiz-Malavassi, Pélissier, Ploton, Ryan, Saldarriaga and Vieilledent2014). However, tree height is rarely available for all trees because of the extreme difficulty in accurately measuring tree height in structurally complex and multi-layered structure of tropical forests. Therefore, the estimation of tree height using height–diameter allometric equations is a widespread practice in ecology and forestry, and the accuracy of these estimates has important implications for international environmental policies.
When tree height is not available locally, regional height–diameter models (Feldpausch et al. Reference Feldpausch, Banin, Phillips, Baker, Lewis, Quesada, Affum-Baffoe, Arets, Berry, Bird, Brondizio, de Camargo, Chave, Djagbletey, Domingues, Drescher, Fearnside, França, Fyllas, Lopez-Gonzalez, Hladik, Higuchi, Hunter, Iida, Salim, Kassim, Keller, Kemp, King, Lovett, Marimon, Marimon-Junior, Lenza, Marshall, Metcalfe, Mitchard, Moran, Nelson, Nilus, Nogueira, Palace, Patiño, Peh, Raventos, Reitsma, Saiz, Schrodt, Sonké, Taedoumg, Tan, White, Wöll and Lloyd2011; Feldpausch et al. Reference Feldpausch, Lloyd, Lewis, Brienen, Gloor, Monteagudo Mendoza, Lopez-Gonzalez, Banin, Abu Salim, Affum-Baffoe, Alexiades, Almeida, Amaral, Andrade, Aragão, Araujo Murakami, Arets, Arroyo, Aymard, Baker, Bánki, Berry, Cardozo, Chave, Comiskey, Alvarez, De Oliveira, Di Fiore, Djagbletey, Domingues, Erwin, Fearnside, França, Freitas, Higuchi, Honorio, Iida, Jiménez, Kassim, Killeen, Laurance, Lovett, Malhi, Marimon, Marimon-Junior, Lenza, Marshall, Mendoza, Metcalfe, Mitchard, Neill, Nelson, Nilus, Nogueira, Parada, Peh, Pena Cruz, Peñuela, Pitman, Prieto, Quesada, Ramírez, Ramírez-Angulo, Reitsma, Rudas, Saiz, Salomão, Schwarz, Silva, Silva-Espejo, Silveira, Sonké, Stropp, Taedoumg, Tan, Ter Steege, Terborgh, Torello-Raventos, Van Der Heijden, Vásquez, Vilanova, Vos, White, Willcock, Woell and Phillips2012) or global height–diameter models using site bioclimatic constraints (Chave et al. Reference Chave, Réjou-Méchain, Búrquez, Chidumayo, Colgan, Delitti, Duque, Eid, Fearnside, Goodman, Henry, Martínez-Yrízar, Mugasha, Muller-Landau, Mencuccini, Nelson, Ngomanda, Nogueira, Ortiz-Malavassi, Pélissier, Ploton, Ryan, Saldarriaga and Vieilledent2014) can be applied to estimate the tree height. Using height–diameter allometric models established at a global scale (Lewis et al. Reference Lewis, Lopez-Gonzalez, Sonké, Affum-Baffoe, Baker, Ojo, Phillips, Reitsma, White and Comiskey2009) and at a regional scale (Feldpausch et al. Reference Feldpausch, Lloyd, Lewis, Brienen, Gloor, Monteagudo Mendoza, Lopez-Gonzalez, Banin, Abu Salim, Affum-Baffoe, Alexiades, Almeida, Amaral, Andrade, Aragão, Araujo Murakami, Arets, Arroyo, Aymard, Baker, Bánki, Berry, Cardozo, Chave, Comiskey, Alvarez, De Oliveira, Di Fiore, Djagbletey, Domingues, Erwin, Fearnside, França, Freitas, Higuchi, Honorio, Iida, Jiménez, Kassim, Killeen, Laurance, Lovett, Malhi, Marimon, Marimon-Junior, Lenza, Marshall, Mendoza, Metcalfe, Mitchard, Neill, Nelson, Nilus, Nogueira, Parada, Peh, Pena Cruz, Peñuela, Pitman, Prieto, Quesada, Ramírez, Ramírez-Angulo, Reitsma, Rudas, Saiz, Salomão, Schwarz, Silva, Silva-Espejo, Silveira, Sonké, Stropp, Taedoumg, Tan, Ter Steege, Terborgh, Torello-Raventos, Van Der Heijden, Vásquez, Vilanova, Vos, White, Willcock, Woell and Phillips2012, Lewis et al. Reference Lewis, Sonke, Sunderland, Begne, Lopez-Gonzalez, van der Heijden, Phillips, Affum-Baffoe, Banin and Bastin2013) to predict tree heights leads to significant biases in plot-level AGB estimates in tropical forests (Ledo et al. Reference Ledo, Cornulier, Illian, Iida, Kassim and Burslem2016, Sullivan et al. Reference Sullivan, Lewis, Hubau, Qie, Baker, Banin, Chave, Cuni-Sanchez, Feldpausch, Lopez-Gonzalez, Arets, Ashton, Bastin, Berry, Bogaert, Boot, Brearley, Brienen, Burslem, de Canniere, Chudomelová, Dančák, Ewango, Hédl, Lloyd, Makana, Malhi, Marimon, Junior, Metali, Moore, Nagy, Vargas, Pendry, Ramírez-Angulo, Reitsma, Rutishauser, Salim, Sonké, Sukri, Sunderland, Svátek, Umunay, Martinez, Vernimmen, Torre, Vleminckx, Vos and Phillips2018), and especially in Central Africa (Kearsley et al. Reference Kearsley, de Haulleville, Hufkens, Kidimbu, Toirambe, Baert, Huygens, Kebede, Defourny, Bogaert, Beeckman, Steppe, Boeckx and Verbeeck2013, Reference Kearsley, Moonen, Hufkens, Doetterl, Lisingo, Boyemba Bosela, Boeckx, Beeckman and Verbeeck2017a, Fayolle et al. Reference Fayolle, Loubota Panzou, Drouet, Swaine, Bauwens, Vleminckx, Biwole, Lejeune and Doucet2016). Likewise, Chave et al. (Reference Chave, Réjou-Méchain, Búrquez, Chidumayo, Colgan, Delitti, Duque, Eid, Fearnside, Goodman, Henry, Martínez-Yrízar, Mugasha, Muller-Landau, Mencuccini, Nelson, Ngomanda, Nogueira, Ortiz-Malavassi, Pélissier, Ploton, Ryan, Saldarriaga and Vieilledent2014) developed a pantropical height–diameter model with a bioclimatic stress variable, but this model provided higher errors than locally parametrised height–diameter models for AGB estimates (Kearsley et al. Reference Kearsley, Moonen, Hufkens, Doetterl, Lisingo, Boyemba Bosela, Boeckx, Beeckman and Verbeeck2017a). Because local abiotic (e.g. light) or biotic (e.g. competition) conditions may significantly impact height–diameter relationships, it is advisable to develop local height–diameter allometries to provide reliable AGB estimates at the tree (Chave et al. Reference Chave, Réjou-Méchain, Búrquez, Chidumayo, Colgan, Delitti, Duque, Eid, Fearnside, Goodman, Henry, Martínez-Yrízar, Mugasha, Muller-Landau, Mencuccini, Nelson, Ngomanda, Nogueira, Ortiz-Malavassi, Pélissier, Ploton, Ryan, Saldarriaga and Vieilledent2014) and plot levels (Sullivan et al. Reference Sullivan, Lewis, Hubau, Qie, Baker, Banin, Chave, Cuni-Sanchez, Feldpausch, Lopez-Gonzalez, Arets, Ashton, Bastin, Berry, Bogaert, Boot, Brearley, Brienen, Burslem, de Canniere, Chudomelová, Dančák, Ewango, Hédl, Lloyd, Makana, Malhi, Marimon, Junior, Metali, Moore, Nagy, Vargas, Pendry, Ramírez-Angulo, Reitsma, Rutishauser, Salim, Sonké, Sukri, Sunderland, Svátek, Umunay, Martinez, Vernimmen, Torre, Vleminckx, Vos and Phillips2018) across the tropics and, most importantly, in Central Africa (Kearsley et al. Reference Kearsley, de Haulleville, Hufkens, Kidimbu, Toirambe, Baert, Huygens, Kebede, Defourny, Bogaert, Beeckman, Steppe, Boeckx and Verbeeck2013, Reference Kearsley, Moonen, Hufkens, Doetterl, Lisingo, Boyemba Bosela, Boeckx, Beeckman and Verbeeck2017a, Fayolle et al. Reference Fayolle, Loubota Panzou, Drouet, Swaine, Bauwens, Vleminckx, Biwole, Lejeune and Doucet2016). However, few studies have considered how height–diameter allometric relationships vary mixed and monodominant forests with only slight differences according to the close values of parameter estimates of height–diameter allometric models (Kearsley et al. Reference Kearsley, de Haulleville, Hufkens, Kidimbu, Toirambe, Baert, Huygens, Kebede, Defourny, Bogaert, Beeckman, Steppe, Boeckx and Verbeeck2013).
Monodominance is defined as more than 60% of canopy trees belonging to a single species (Torti et al. Reference Torti, Coley and Kursar2001). Monodominant forests of Gilbertiodendron dewevrei (De Wild.) J. Léonard are the most common ones and widespread in tropical Africa (White Reference White1983). The most important mechanism driving monodominance of G. dewevrei is seedling shade tolerance and slow decomposition of leaves, resulting in deep leaf litter layer that could negatively impact the survival of individuals of other species (Peh et al. Reference Peh, Lewis and Lloyd2011a). Monodominance in lowland tropical forests has always interested tropical ecologists because the distribution of this forest type is scattered as ‘islands’ in a ‘sea’ of highly diverse mixed forests and the causes of this distribution pattern is still unknown (Peh et al. Reference Peh, Sonké, Lloyd, Quesada and Lewis2011b). In Africa, monodominant forests are dominated by Gilbertiodendron dewevrei (Family: Fabaceae) and naturally occur beside mixed species forests with high species diversity across Central Africa (Hart et al. Reference Hart, Hart and Murphy1989, Peh et al. Reference Peh, Lewis and Lloyd2011a, Fayolle et al. Reference Fayolle, Picard, Doucet, Swaine, Bayol, Bénédet and Gourlet-Fleury2014a). Several studies, however, have revealed differences in forest structure and diversity between African monodominant and mixed forests. Within monodominant forests, G. dewevrei with 90% of the canopy-level trees (Torti et al. Reference Torti, Coley and Kursar2001) account for more than 75% of the total basal area and AGB in Cameroon (Djuikouo et al. Reference Djuikouo, Doucet, Nguembou, Lewis and Sonke2010) and in Democratic Republic of Congo (Makana et al. Reference Makana, Ewango, McMahon, Thomas, Hart and Condit2011). Consequently, there are a higher number of large trees in these monodominant forests than in mixed forests (Hart et al. Reference Hart, Hart and Murphy1989). In contrast, indices of diversity like species richness, Shannon’s index, Simpson’s index and functional richness are higher in mixed forests than in monodominant forests (Hart et al. Reference Hart, Hart and Murphy1989, Djuikouo et al. Reference Djuikouo, Doucet, Nguembou, Lewis and Sonke2010; Cassart et al. Reference Cassart, Basia, Titeux, Andivia and Ponette2017, Kearsley et al. Reference Kearsley, Verbeeck, Hufkens, Van de Perre, Doetterl, Baert, Beeckman, Boeckx and Huygens2017b).
Despite a clear difference in structural attributes and diversity indices between monodominant and mixed forests, previous studies have ignored the differences in height–diameter allometry between these two forest types, considering them as a single forest type in Central Africa (Kearsley et al. Reference Kearsley, de Haulleville, Hufkens, Kidimbu, Toirambe, Baert, Huygens, Kebede, Defourny, Bogaert, Beeckman, Steppe, Boeckx and Verbeeck2013, Loubota Panzou et al. Reference Loubota Panzou, Fayolle, Feldpausch, Ligot, Doucet, Forni, Zombo, Mazengue, Loumeto and Gourlet-Fleury2018a). These differences in height–diameter allometry between the two forest types could be influencing forest AGB estimates and canopy height attributes (i.e. maximum height), as found by Fayolle et al. (Reference Fayolle, Loubota Panzou, Drouet, Swaine, Bauwens, Vleminckx, Biwole, Lejeune and Doucet2016) and Loubota Panzou et al. (Reference Loubota Panzou, Fayolle, Feldpausch, Ligot, Doucet, Forni, Zombo, Mazengue, Loumeto and Gourlet-Fleury2018a). The variation in AGB and canopy height attributes, like maximum height and Lorey’s mean height, between monodominant and mixed forests has been poorly explored, especially in tropical African forests where little is known about the amount and spatial variation of AGB (Loubota Panzou et al. Reference Loubota Panzou, Doucet, Loumeto, Biwole, Bauwens and Fayolle2016). Therefore, it is not so crucial to properly assess height–diameter allometric models and their impacts on canopy height, AGB and carbon stock estimates of African monodominant G. dewevrei forests.
To our knowledge, there is only one study that compared the height–diameter allometry between monodominant and mixed forests and its consequence on the AGB estimation in Central Africa (Kearsley et al. Reference Kearsley, de Haulleville, Hufkens, Kidimbu, Toirambe, Baert, Huygens, Kebede, Defourny, Bogaert, Beeckman, Steppe, Boeckx and Verbeeck2013). However, no study comparing a wide range of height–diameter equations has been published for African monodominant G. dewevrei forests close to mixed forests. Here, we comprehensively compare the performance, in terms of estimated values, mean square error, and bias, of height–diameter equations fitted by this study and height–diameter equations commonly used in the literature. We then evaluate the precision and bias in AGB estimations when using tree heights derived from literature equations and from equations developed by this study. Two research questions are addressed. First, does height–diameter allometric model vary between monodominant and mixed forests and what impacts can be observed on plot-level height attributes and AGB from specific height–diameter allometric models? We expect that (i) the two parameters (intercept and slope) of the height–diameter allometric model vary with the forest type, assuming the two forest types have similar allometric trajectories but different resource allocation strategies over all diameter ranges (Hulshof et al. Reference Hulshof, Swenson and Weiser2015); and (ii) plot-level height attributes and AGB from specific height–diameter allometric models vary between the two forest types, in agreement with the results of Loubota Panzou et al. (Reference Loubota Panzou, Fayolle, Feldpausch, Ligot, Doucet, Forni, Zombo, Mazengue, Loumeto and Gourlet-Fleury2018a) for the Celtis and Manilkara forests in northern Republic of Congo. Secondly, how do predictions of tree height, which directly influence AGB estimations, vary between height–diameter equations fitted by this study and literature height–diameter equations within each forest type? Like Kearsley et al. (Reference Kearsley, de Haulleville, Hufkens, Kidimbu, Toirambe, Baert, Huygens, Kebede, Defourny, Bogaert, Beeckman, Steppe, Boeckx and Verbeeck2013, Reference Kearsley, Moonen, Hufkens, Doetterl, Lisingo, Boyemba Bosela, Boeckx, Beeckman and Verbeeck2017a) and Ledo et al. (Reference Ledo, Cornulier, Illian, Iida, Kassim and Burslem2016), we expect to find that height–diameter equations fitted in this study produce the lowest errors in tree height predictions, which translates into more accurate estimations of AGB, than literature height–diameter equations for each forest type.
Study Site
The study site was located in the northern Republic of Congo. The region has a mean annual rainfall of 1,600 mm with a distinct dry season (December until March) and a mean annual temperature of 25°C. The topography is slightly undulating, with elevations varying between 400 and 460 m a.s.l. The geological substrate consists of alluvium (Fayolle et al. Reference Fayolle, Engelbrecht, Freycon, Mortier, Swaine, Réjou-Méchain, Doucet, Fauvet, Cornu and Gourlet-Fleury2012). The vegetation in the area belongs to moist Central African forests (Fayolle et al. Reference Fayolle, Swaine, Bastin, Bourland, Comiskey, Dauby, Doucet, Gillet, Gourlet-Fleury, Hardy, Kirunda, Kouamé and Plumptre2014b) and specifically semi-deciduous forests (Fayolle et al. Reference Fayolle, Picard, Doucet, Swaine, Bayol, Bénédet and Gourlet-Fleury2014a). In this study site, monodominant forests are dominated by Gilbertiodendron dewevrei (with an abundance of 61% of the total basal area) and these forests are commonly found beside mixed tropical forests with high species diversity (Table 1). These two emblematic forest types cover extensive areas in the same zone, where they frequently co-occur under similar ecological conditions (Peh et al. Reference Peh, Sonké, Lloyd, Quesada and Lewis2011b).
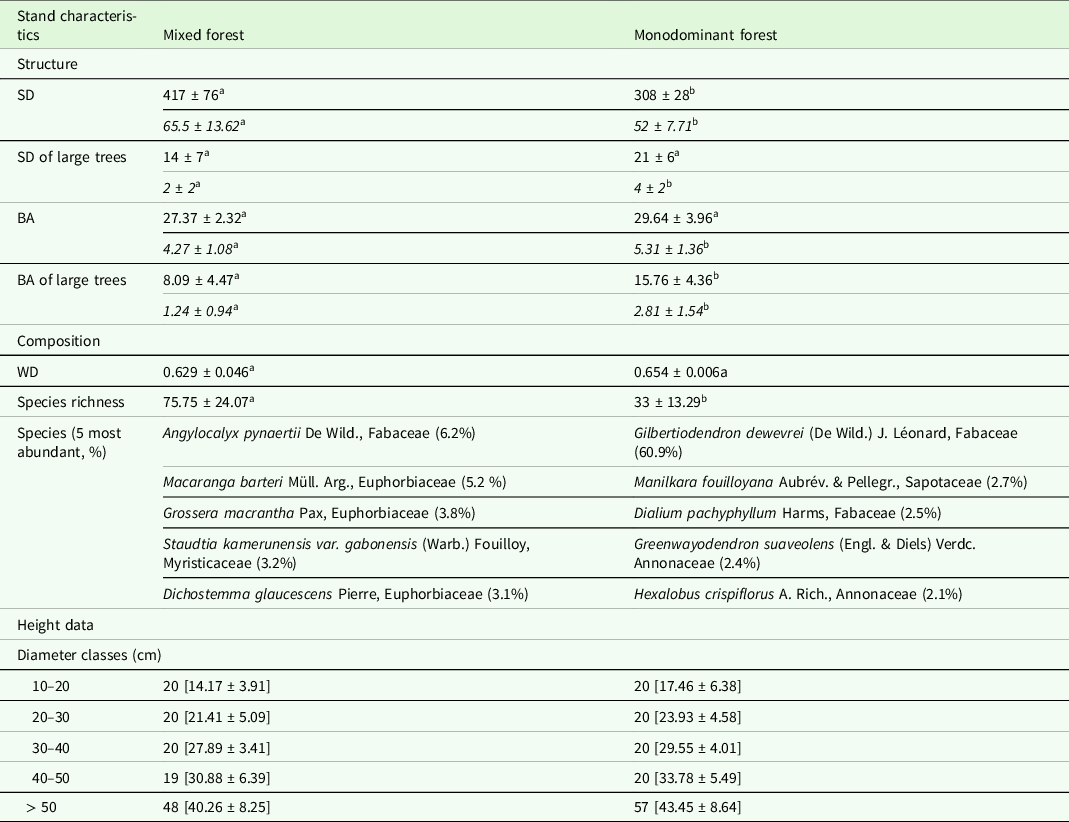
Table 1. Stand characteristics (mean ± sd) for mixed and monodominant forests. For stand structure, stem density (SD) was the number of trees greater than or equal to 10 cm diameter per hectare; basal area (BA, m2) was calculated as the sum of the cross-section area at 1.30 m, or above buttresses, of all trees ≥ 10 cm diameter; SD and BA of large trees (≥70 cm diameter) at 1-ha and 0.25-ha (value in italic) levels. Wood density (WD, g cm−3) was estimated as the mean wood density at plot level, species richness expressed in effective number of species and species abundance is stem density weighted, with only the five most abundant species shown. Sampling effort of the total height (number of sampled trees) [mean ± sd in m] observed in 264 individual trees, by diameter class, in mixed and monodominant forests. The same letters indicated there were not significant differences (P-value > 0.050) and the different letters indicated significant differences (P-value < 0.050) between monodominant and mixed forests.
Methods
Sampling and tree measurements
In the study site, eight 1-ha permanent forest plots were installed in unlogged areas of the mixed forest (n = 4) and monodominant forest (n = 4), and all trees with diameters ≥10 cm were inventoried and identified to species level in each permanent forest plot. Each 1-ha plot in each forest type was divided in 4 subplots of 50 m
 $$ \times $$
50 m (0.25 ha) with a total of 16 subplots for each forest type. We used the plot level of 0.25 ha (n = 16 for each forest type) in order to increase the statistical power.
$$ \times $$
50 m (0.25 ha) with a total of 16 subplots for each forest type. We used the plot level of 0.25 ha (n = 16 for each forest type) in order to increase the statistical power.
We measured the stem diameter of all trees ≥ 10 cm diameter in each 0.25-ha plot and we measured the height of 264 trees with 137 trees from 10 to 129 cm diameter in monodominant forest and 127 trees from 10 to 143 cm diameter in mixed forest across all 0.25-ha plots. As recommended by Sullivan et al. (Reference Sullivan, Lewis, Hubau, Qie, Baker, Banin, Chave, Cuni-Sanchez, Feldpausch, Lopez-Gonzalez, Arets, Ashton, Bastin, Berry, Bogaert, Boot, Brearley, Brienen, Burslem, de Canniere, Chudomelová, Dančák, Ewango, Hédl, Lloyd, Makana, Malhi, Marimon, Junior, Metali, Moore, Nagy, Vargas, Pendry, Ramírez-Angulo, Reitsma, Rutishauser, Salim, Sonké, Sukri, Sunderland, Svátek, Umunay, Martinez, Vernimmen, Torre, Vleminckx, Vos and Phillips2018), the sample number is greater than the minimum required for height–diameter allometric models (at least 50) and we included more than 10 large-diameter trees (>50 cm) (Table 1). Tree diameter was measured with a diameter tape at 1.3 m for regular stems or 0.30 m above the top of the buttresses for irregular stems. Total height (H in m) of trees was measured from a distance larger than the tree height using a VERTEX IV Rangefinder.
Height–diameter allometric models
We fitted and compared 10 height–diameter equations using different models (3 linear models, 3 polynomial models and 4 asymptotic models) to our data following Fayolle et al. (Reference Fayolle, Loubota Panzou, Drouet, Swaine, Bauwens, Vleminckx, Biwole, Lejeune and Doucet2016). We identified the best model with the Akaike’s information criterion (AIC), which is a classical index for model selection where the lowest AIC indicates the best model (Burnham and Anderson Reference Burnham and Anderson2002). The height–diameter allometry tended to support an asymptotic shape with Michaelis–Menten model as the best in the two forest types (Supplementary Material Table S1). Asymptotic models have been demonstrated to better describe the height–diameter allometry for AGB estimations in tropical forests (Ledo et al. Reference Ledo, Cornulier, Illian, Iida, Kassim and Burslem2016, Sullivan et al. Reference Sullivan, Lewis, Hubau, Qie, Baker, Banin, Chave, Cuni-Sanchez, Feldpausch, Lopez-Gonzalez, Arets, Ashton, Bastin, Berry, Bogaert, Boot, Brearley, Brienen, Burslem, de Canniere, Chudomelová, Dančák, Ewango, Hédl, Lloyd, Makana, Malhi, Marimon, Junior, Metali, Moore, Nagy, Vargas, Pendry, Ramírez-Angulo, Reitsma, Rutishauser, Salim, Sonké, Sukri, Sunderland, Svátek, Umunay, Martinez, Vernimmen, Torre, Vleminckx, Vos and Phillips2018), and Michaelis–Menten model popularised by Molto et al. (Reference Molto, Rossi and Blanc2013, Reference Molto, Hérault, Boreux, Daullet, Rousteau and Rossi2014) in French Guiana was also found to provide a good fit to height–diameter data in Central Africa (Fayolle et al. Reference Fayolle, Loubota Panzou, Drouet, Swaine, Bauwens, Vleminckx, Biwole, Lejeune and Doucet2016). We developed specific height–diameter allometric equations using the Michealis–Menten model for each forest type, with the following model form:
 $${{\rm{H}}_{{\rm{if}}}}{\rm{\;}} = {\rm{\;\;}}{{\rm{a}}_{\rm{f}}} \times {{\rm{D}}_{{\rm{if}}}}{\rm{\;}}/{\rm{\;}}\left( {{{\rm{b}}_{\rm{f}}}{\rm{\;}} + {\rm{\;\;}}{{\rm{D}}_{{\rm{if}}}}} \right)$$
where af and bf are the model’s output parameters within each forest type f, Hif (in m) is total height of tree i within each forest type f and Dif (in cm) is the diameter of tree i within each forest type f.
Plot-level height attributes and AGB
To make comparisons between mixed and monodominant forests in height–diameter allometry, the specific height–diameter model for each forest type was used to estimate tree height, in order to compute Lorey’s mean height and AGB at the 0.25-ha subplot level. Lorey’s mean height (HL in m) was the weighted mean height whereby individual trees are weighted in proportion to their basal area for each 0.25-ha subplot:
 $${H_L}\; = \;{{\sum\nolimits_{i\; = \;1}^n B {A_i}{H_i}} \over {\sum\nolimits_{i\; = \;1}^n B {A_i}}}$$
where
 $$B{A_i}$$
(m2) is the basal area and
$$B{A_i}$$
(m2) is the basal area and
 $${H_i}$$
(m) is the height of each tree sample i and n is the number of sampled trees for each 0.25-ha subplot.
$${H_i}$$
(m) is the height of each tree sample i and n is the number of sampled trees for each 0.25-ha subplot.
Although a tree AGB allometric equation for estimating AGB of Gilbertiodendron dewevrei has been developed in Central Africa (Umunay et al. Reference Umunay, Gregoire and Ashton2017), the most recent regional multi-species allometric equations established for the Central African forests (Fayolle et al. Reference Fayolle, Ngomanda, Mbasi, Barbier, Bocko, Boyemba, Couteron, Fonton, Kamdem, Katembo, Kondaoule, Loumeto, Maïdou, Mankou, Mengui, Mofack, Moundounga, Moundounga, Nguimbous, Nsue Nchama, Obiang, Ondo Meye Asue, Picard, Rossi, Senguela, Sonké, Viard, Yongo, Zapfack and Medjibe2018) have been used in this study. To estimate the AGB (in Mg) of each tree in the mixed and monodominant forests, we used the allometric equation of Fayolle et al. (Reference Fayolle, Ngomanda, Mbasi, Barbier, Bocko, Boyemba, Couteron, Fonton, Kamdem, Katembo, Kondaoule, Loumeto, Maïdou, Mankou, Mengui, Mofack, Moundounga, Moundounga, Nguimbous, Nsue Nchama, Obiang, Ondo Meye Asue, Picard, Rossi, Senguela, Sonké, Viard, Yongo, Zapfack and Medjibe2018):
 $${\rm{AGB\;}} = {\rm{\;}}0.125 \times {\rm{W}}{{\rm{D}}^{1.079}} \times {{\rm{D}}^{2.210}} \times {{\rm{H}}^{0.506}}$$
Tree diameter (D in cm) was directly available from the forest inventory of permanent plots. Tree diameters from the forest inventory were converted into tree height estimates (H in m) using the specific height–diameter allometric model for each forest type fitted by this study. Each tree in the plot was assigned a wood density (WD in g.cm−3) from the global wood density database (Chave et al. Reference Chave, Coomes, Jansen, Lewis, Swenson and Zanne2009, Zanne et al. Reference Zanne, Lopez-Gonzalez, Coomes, Illic, Jansen, Lewis, Miller, Swenson, Wiemann and Chave2009). Lastly, tree AGB was summed at the 0.25-ha subplot level.
Model comparisons for tree height predictions and AGB estimations
We used two sets of height–diameter allometric equations for predicting tree height as a function of diameter and for AGB estimations. First, we used height–diameter equations fitted in this study which we refer to as fitted equations. Second, we compared the parametrised local, regional and pantropical height–diameter equations proposed by the literature which we refer to as ‘literature equations’. The eight literature equations were developed by Banin et al. (Reference Banin, Feldpausch, Phillips, Baker, Lloyd, Affum-Baffoe, Arets, Berry, Bradford, Brienen, Davies, Drescher, Higuchi, Hilbert, Hladik, Iida, Salim, Kassim, King, Lopez-Gonzalez, Metcalfe, Nilus, Peh, Reitsma, Sonké, Taedoumg, Tan, White, Wöll and Lewis2012) and Lewis et al. (Reference Lewis, Lopez-Gonzalez, Sonké, Affum-Baffoe, Baker, Ojo, Phillips, Reitsma, White and Comiskey2009) for tropical Africa, by Feldpausch et al. (Reference Feldpausch, Banin, Phillips, Baker, Lewis, Quesada, Affum-Baffoe, Arets, Berry, Bird, Brondizio, de Camargo, Chave, Djagbletey, Domingues, Drescher, Fearnside, França, Fyllas, Lopez-Gonzalez, Hladik, Higuchi, Hunter, Iida, Salim, Kassim, Keller, Kemp, King, Lovett, Marimon, Marimon-Junior, Lenza, Marshall, Metcalfe, Mitchard, Moran, Nelson, Nilus, Nogueira, Palace, Patiño, Peh, Raventos, Reitsma, Saiz, Schrodt, Sonké, Taedoumg, Tan, White, Wöll and Lloyd2011, Reference Feldpausch, Lloyd, Lewis, Brienen, Gloor, Monteagudo Mendoza, Lopez-Gonzalez, Banin, Abu Salim, Affum-Baffoe, Alexiades, Almeida, Amaral, Andrade, Aragão, Araujo Murakami, Arets, Arroyo, Aymard, Baker, Bánki, Berry, Cardozo, Chave, Comiskey, Alvarez, De Oliveira, Di Fiore, Djagbletey, Domingues, Erwin, Fearnside, França, Freitas, Higuchi, Honorio, Iida, Jiménez, Kassim, Killeen, Laurance, Lovett, Malhi, Marimon, Marimon-Junior, Lenza, Marshall, Mendoza, Metcalfe, Mitchard, Neill, Nelson, Nilus, Nogueira, Parada, Peh, Pena Cruz, Peñuela, Pitman, Prieto, Quesada, Ramírez, Ramírez-Angulo, Reitsma, Rudas, Saiz, Salomão, Schwarz, Silva, Silva-Espejo, Silveira, Sonké, Stropp, Taedoumg, Tan, Ter Steege, Terborgh, Torello-Raventos, Van Der Heijden, Vásquez, Vilanova, Vos, White, Willcock, Woell and Phillips2012) for Central Africa, by Kearsley et al. (Reference Kearsley, de Haulleville, Hufkens, Kidimbu, Toirambe, Baert, Huygens, Kebede, Defourny, Bogaert, Beeckman, Steppe, Boeckx and Verbeeck2013) for the mixed forest and the monodominant forest in Democratic Republic of Congo, by Fayolle et al. (Reference Fayolle, Loubota Panzou, Drouet, Swaine, Bauwens, Vleminckx, Biwole, Lejeune and Doucet2016) for the Mindourou site in Cameroon and by Loubota Panzou et al. (Reference Loubota Panzou, Fayolle, Feldpausch, Ligot, Doucet, Forni, Zombo, Mazengue, Loumeto and Gourlet-Fleury2018a) for the Loundoungou–Toukoulaka site in northern Republic of Congo (Table S2).
Data analysis
To test significant differences in height–diameter allometry between the monodominant and mixed forests, we used the equation 1 and compared three forms of the height–diameter allometric model fitted in this study with varying coefficients: (a) varying intercept and varying slope, assuming the two forest types have similar allometric trajectories but different resource allocation strategies over all diameter ranges; (b) varying intercept and fixed slope, assuming the two forest types diverge in their resource allocation strategies at small diameters but have similar allometries at larger diameters; and (c) fixed intercept and varying slope, assuming the two forest types have similar allometries at small diameters and diverge in their resource allocation strategies at larger diameters (Hulshof et al. Reference Hulshof, Swenson and Weiser2015). The model selection was based on (i) the likelihood ratio test (a statistical test used to compare the goodness of fit of two statistical models), we considered the null model as a model with fixed coefficients without a forest type effect, whereas the alternative models where the ones described above as (a), (b) and (c); and (ii) the AIC values, with the lowest AIC indicating the best model (Burnham and Anderson Reference Burnham and Anderson2002). Using the specific height–diameter allometric model for each forest type fitted in this study, we tested plot-level (0.25 ha) height attributes and AGB between the two forests types using one-way analysis of variance (ANOVA) for all tree diameters. For the ANOVA test, the null hypothesis was ‘no difference between means for each variable’. When the null hypothesis was rejected, we conducted Tukey’s post hoc pairwise multiple comparisons between means.
To assess the performance of height–diameter models fitted by this study and with literature equations, we calculated the root-mean-squared error (RMSE), the bias and the paired t-test. The RMSE (in m for tree height and in Mg for AGB) was calculated as the square root of the mean squared difference between measured heights and predicted heights from different height–diameter models (fitted by this study and with literature equations) at tree level (i), or between AGB estimation from equations fitted by this study (referred as measured) and AGB estimation from literature equations (referred as predicted) at plot (0.25 ha) level (i):
 $${\rm{RMSE}}\; = \;\;\sqrt {{1 \over {\rm{n}}}\sum\limits_{{\rm{i}}\; = \;1}^{\rm{n}} {{{\left( {{\rm{measure}}{{\rm{d}}_{\rm{i}}} - {\rm{predicte}}{{\rm{d}}_{\rm{i}}}} \right)}^2}} } $$
where n is the number of sampled trees for tree height and the number of sampled subplots for AGB estimation in each forest type
The bias (in %) was calculated as the difference between mean heights predicted from different height–diameter models (fitted by this study and with literature equations) and measured heights at tree level (i), or the difference between the mean AGB estimated with literature equations (referred as predicted) and AGB estimated with equations fitted by this study (referred to as measured) at plot (0.25 ha) level (i) using the equation 5.
 $${\rm{bias}}\;\left( \% \right)\; = \;\;{1 \over {\rm{n}}}\sum\limits_{{\rm{i}}\; = \;1}^{\rm{n}} {({\rm{predicte}}{{\rm{d}}_{\rm{i}}} - {\rm{measure}}{{\rm{d}}_{\rm{i}}})} /{\rm{measure}}{{\rm{d}}_{\rm{i}}}$$
where n is the number of sampled trees for tree height and the number of sampled plots for AGB estimation in each forest type
We used also the paired t-test to identify significant differences between heights predicted by height–diameter models fitted by this study or literature equations with height measurements and to identify significant differences between AGB estimated using literature equations and AGB estimated using equations fitted by this study.
All the statistical analyses were performed with the open-source R environment (R Core Team 2020) using packages: ‘BIOMASS’ with the getWoodDensity function (Réjou-Méchain et al. Reference Réjou-Méchain, Tanguy, Piponiot, Chave and Hérault2017), and ‘ggplot2’ for graphical output (Wickham Reference Wickham2016). Normality and homoscedasticity of residuals were checked graphically and with Shapiro–Wilk and Breusch–Pagan tests, respectively. Height–diameter allometric relationships were fitted using linear models with ordinary least-squares regressions and non-linear least-squares, via the ‘nls’ function. All significant differences reported to P-value < 0.05.
Results
Characteristics of monodominant and mixed forests
Species richness was significantly higher in the mixed forest, with the number of tree species per 1-ha plot ranging from 43 to 101, whilst within the monodominant forest plots tree species numbers per 1-ha plot ranged from 14 to 45 (Table 1). Stem density was also significantly higher in the mixed forest, whereas the monodominant and mixed forest showed similar basal area and wood density at the 1-ha plot level (Table 1). Similar results have been obtained at the 0.25-ha subplot level (Table 1).
Differences in height–diameter allometric models
Based on AIC values (Table 2), the two parameters of Michaelis–Menten model varied significantly between the two forest types, indicating a significant variation in height–diameter allometry between mixed and monodominant forests (Figure 1a). Specific height–diameter allometric models were used to derive the predicted value of height for two trees of 10 and 100 cm diameters in each forest type. The smallest height (H10 = 10.75 m and H100 = 45.17 m) was observed for the mixed forest, whereas the greatest height (H10 = 12.17 m and H100 = 48.22 m) was observed for the monodominant forest. Trees tended to be significantly taller in monodominant forests than in mixed forests. Using the forest type-specific height–diameter equation fitted in this study, we detected significant differences in Lorey’s mean height and AGB between monodominant and mixed forests at the plot (0.25 ha) level (Figure 1b, c). The mean values of Lorey’s mean height were higher in monodominant forests than in mixed forests at the 0.25-ha subplot level (Figure 1b). Likewise, the mean AGB from 0.25-ha subplots had greater AGB in monodominant forests than in mixed forests (Figure 1c).
Table 2. Differences in height–diameter allometry between mixed and monodominant forests. We compared a general model with fixed parameters (without forest type effect) and three alternative models including a forest type effect on the parameters (varying intercept and varying slope; varying intercept and fixed slope; and fixed intercept and varying slope) using the AIC values and likelihood ratio tests (P-value). The best model is shown in bold.


Figure 1. Differences between mixed forest (Mix-F) and monodominant forest (Mono-F) in height–diameter allometry (a), Lorey’s mean height (b) and aboveground biomass (c). Box plots that show values of Lorey’s mean height (m) and aboveground biomass (Mg) are given at subplot (0.25 ha) level in each forest type. Statistical comparisons among forest types are based on the the non-parametric Kruskal–Wallis rank sum test and different letters indicate a significant difference (P < 0.05) according to the post hoc tests.
Performance of height–diameter allometric models
The height–diameter curves from different literature equations varied within each forest type (Figure 2a). Individual error distributions of tree height predictions were notably different among literature equations within each forest type (Figure 2b). Literature equations severely underestimated the height for trees with larger diameter values (Figure 2b). Among literature equations, Exponential (Banin et al. Reference Banin, Feldpausch, Phillips, Baker, Lloyd, Affum-Baffoe, Arets, Berry, Bradford, Brienen, Davies, Drescher, Higuchi, Hilbert, Hladik, Iida, Salim, Kassim, King, Lopez-Gonzalez, Metcalfe, Nilus, Peh, Reitsma, Sonké, Taedoumg, Tan, White, Wöll and Lewis2012) and Weibull (Feldpausch et al. Reference Feldpausch, Lloyd, Lewis, Brienen, Gloor, Monteagudo Mendoza, Lopez-Gonzalez, Banin, Abu Salim, Affum-Baffoe, Alexiades, Almeida, Amaral, Andrade, Aragão, Araujo Murakami, Arets, Arroyo, Aymard, Baker, Bánki, Berry, Cardozo, Chave, Comiskey, Alvarez, De Oliveira, Di Fiore, Djagbletey, Domingues, Erwin, Fearnside, França, Freitas, Higuchi, Honorio, Iida, Jiménez, Kassim, Killeen, Laurance, Lovett, Malhi, Marimon, Marimon-Junior, Lenza, Marshall, Mendoza, Metcalfe, Mitchard, Neill, Nelson, Nilus, Nogueira, Parada, Peh, Pena Cruz, Peñuela, Pitman, Prieto, Quesada, Ramírez, Ramírez-Angulo, Reitsma, Rudas, Saiz, Salomão, Schwarz, Silva, Silva-Espejo, Silveira, Sonké, Stropp, Taedoumg, Tan, Ter Steege, Terborgh, Torello-Raventos, Van Der Heijden, Vásquez, Vilanova, Vos, White, Willcock, Woell and Phillips2012) models were the most accurate in terms of RMSE and bias and their predicted height values did not differed to height measurements in mixed forest (Table 3).

Figure 2. Fitted height–diameter model (a) and individual tree height estimation error (b) according to tree diameter for the height–diameter allometric models found in the literature (Table S2) for mixed and monodominant forests. Each grey dot represents a measured value of tree height and diameter, and the grey dotted line represents the 0 error for tree height.
Table 3. Root mean square error (RMSE, in m for tree height and Mg for AGB), bias (%) and paired t-tests (P-value) in tree height between height predicted by different literature equations and height observation at tree level, and in aboveground biomass (AGB) between AGB predicted by literature equations and AGB predicted by the specific height–diameter equation at the subplot (0.25 ha) level within of each forest type.

The error distribution of estimated AGB due to inaccurate height estimation differed notably among literature height–diameter equations (Figure 3a). The literature equations tended to underestimated AGB values for trees with larger diameter values, which were less than half the AGB value from height–diameter equations fitted in this study. The values of RMSE and bias in AGB also varied strongly among literature equations (Table 3), which suggests that the selection of height–diameter model affected the accuracy of AGB estimation at the 0.25-ha plot level. Here, Weibull models (Feldpausch et al. Reference Feldpausch, Lloyd, Lewis, Brienen, Gloor, Monteagudo Mendoza, Lopez-Gonzalez, Banin, Abu Salim, Affum-Baffoe, Alexiades, Almeida, Amaral, Andrade, Aragão, Araujo Murakami, Arets, Arroyo, Aymard, Baker, Bánki, Berry, Cardozo, Chave, Comiskey, Alvarez, De Oliveira, Di Fiore, Djagbletey, Domingues, Erwin, Fearnside, França, Freitas, Higuchi, Honorio, Iida, Jiménez, Kassim, Killeen, Laurance, Lovett, Malhi, Marimon, Marimon-Junior, Lenza, Marshall, Mendoza, Metcalfe, Mitchard, Neill, Nelson, Nilus, Nogueira, Parada, Peh, Pena Cruz, Peñuela, Pitman, Prieto, Quesada, Ramírez, Ramírez-Angulo, Reitsma, Rudas, Saiz, Salomão, Schwarz, Silva, Silva-Espejo, Silveira, Sonké, Stropp, Taedoumg, Tan, Ter Steege, Terborgh, Torello-Raventos, Van Der Heijden, Vásquez, Vilanova, Vos, White, Willcock, Woell and Phillips2012 and Lewis et al. Reference Lewis, Lopez-Gonzalez, Sonké, Affum-Baffoe, Baker, Ojo, Phillips, Reitsma, White and Comiskey2009) introduced the lowest values of RMSE and bias in AGB than other literature equations for the mixed forest (Table 3). The error of estimated AGB at the 0.25-ha plot level due to inaccurate height estimation differed notably among literature height–diameter equations (Figure 3b). The literature equations tended to underestimated AGB values, which were less than half the AGB value from equation fitted by this study.
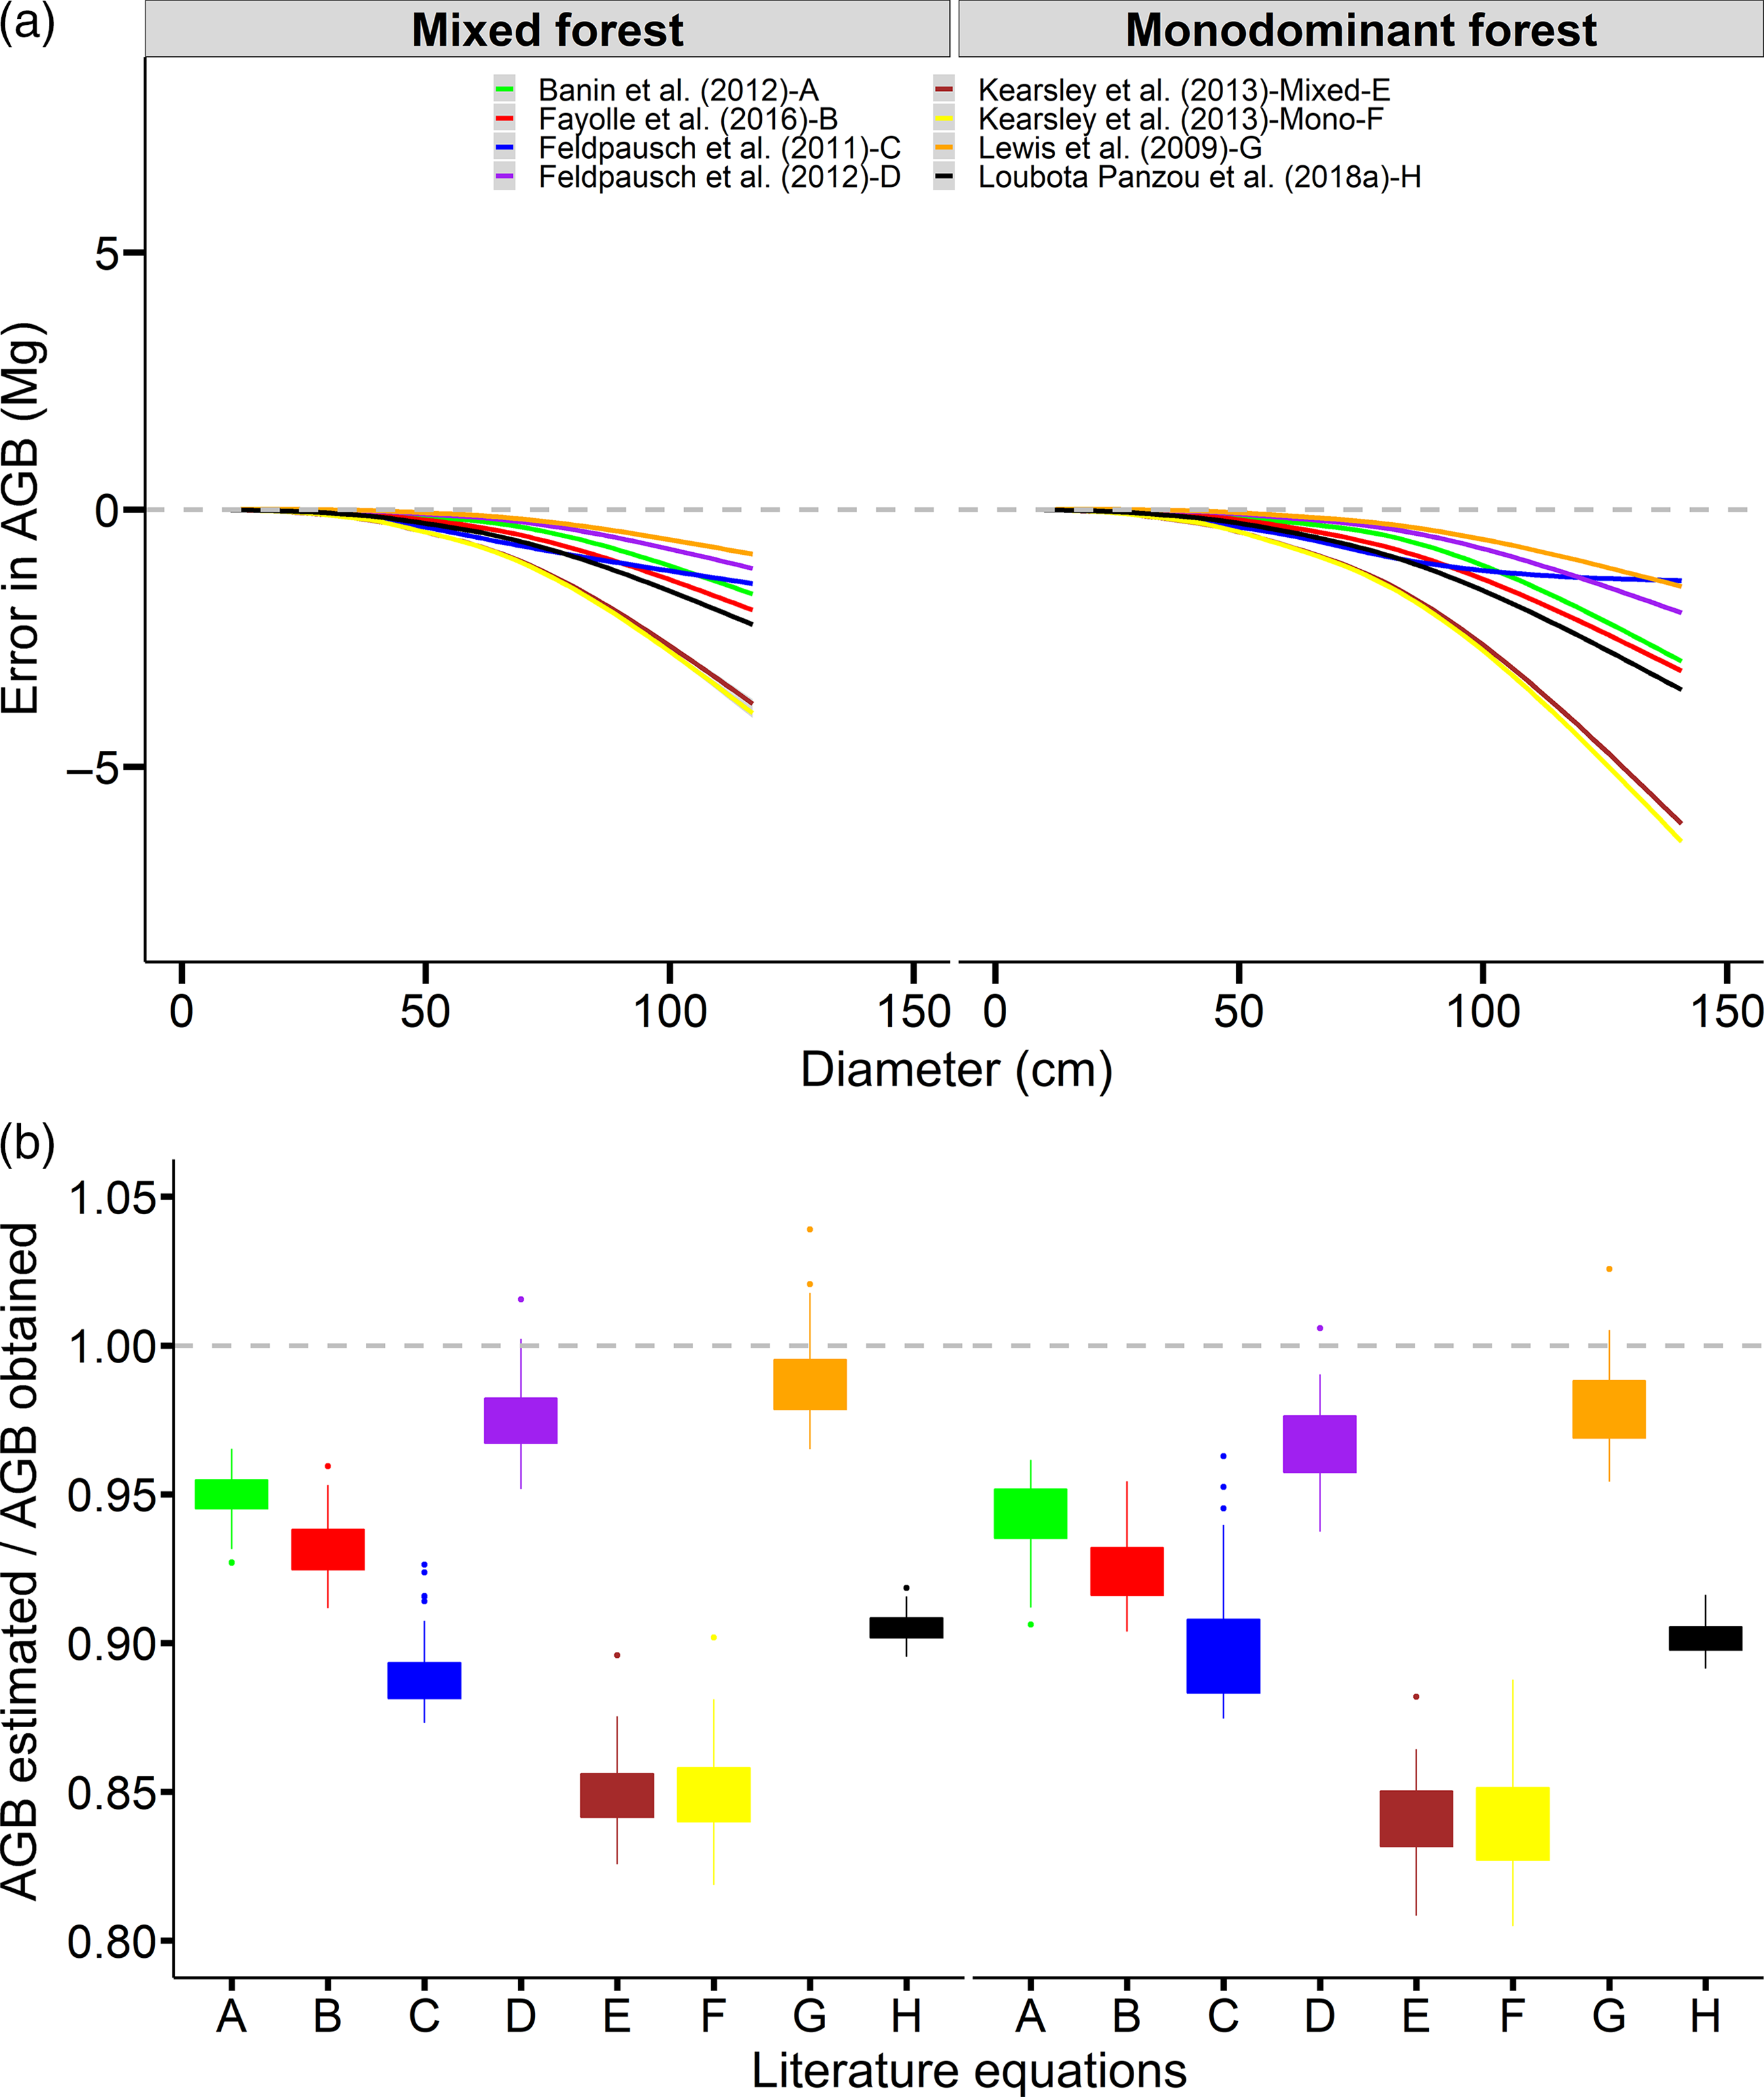
Figure 3. Individual error in tree aboveground biomass (AGB) according to tree diameter (a) and AGB error between AGB estimated using tree height from literature equations in Table S2 (Banin et al. (Reference Banin, Feldpausch, Phillips, Baker, Lloyd, Affum-Baffoe, Arets, Berry, Bradford, Brienen, Davies, Drescher, Higuchi, Hilbert, Hladik, Iida, Salim, Kassim, King, Lopez-Gonzalez, Metcalfe, Nilus, Peh, Reitsma, Sonké, Taedoumg, Tan, White, Wöll and Lewis2012) – A), Fayolle et al. (Reference Fayolle, Loubota Panzou, Drouet, Swaine, Bauwens, Vleminckx, Biwole, Lejeune and Doucet2016) – B, Feldpausch et al. (Reference Feldpausch, Banin, Phillips, Baker, Lewis, Quesada, Affum-Baffoe, Arets, Berry, Bird, Brondizio, de Camargo, Chave, Djagbletey, Domingues, Drescher, Fearnside, França, Fyllas, Lopez-Gonzalez, Hladik, Higuchi, Hunter, Iida, Salim, Kassim, Keller, Kemp, King, Lovett, Marimon, Marimon-Junior, Lenza, Marshall, Metcalfe, Mitchard, Moran, Nelson, Nilus, Nogueira, Palace, Patiño, Peh, Raventos, Reitsma, Saiz, Schrodt, Sonké, Taedoumg, Tan, White, Wöll and Lloyd2011) – C, Feldpausch et al. (Reference Feldpausch, Lloyd, Lewis, Brienen, Gloor, Monteagudo Mendoza, Lopez-Gonzalez, Banin, Abu Salim, Affum-Baffoe, Alexiades, Almeida, Amaral, Andrade, Aragão, Araujo Murakami, Arets, Arroyo, Aymard, Baker, Bánki, Berry, Cardozo, Chave, Comiskey, Alvarez, De Oliveira, Di Fiore, Djagbletey, Domingues, Erwin, Fearnside, França, Freitas, Higuchi, Honorio, Iida, Jiménez, Kassim, Killeen, Laurance, Lovett, Malhi, Marimon, Marimon-Junior, Lenza, Marshall, Mendoza, Metcalfe, Mitchard, Neill, Nelson, Nilus, Nogueira, Parada, Peh, Pena Cruz, Peñuela, Pitman, Prieto, Quesada, Ramírez, Ramírez-Angulo, Reitsma, Rudas, Saiz, Salomão, Schwarz, Silva, Silva-Espejo, Silveira, Sonké, Stropp, Taedoumg, Tan, Ter Steege, Terborgh, Torello-Raventos, Van Der Heijden, Vásquez, Vilanova, Vos, White, Willcock, Woell and Phillips2012) – D, Kearsley et al. (Reference Kearsley, de Haulleville, Hufkens, Kidimbu, Toirambe, Baert, Huygens, Kebede, Defourny, Bogaert, Beeckman, Steppe, Boeckx and Verbeeck2013) – Mixed–E, Kearsley et al. (Reference Kearsley, de Haulleville, Hufkens, Kidimbu, Toirambe, Baert, Huygens, Kebede, Defourny, Bogaert, Beeckman, Steppe, Boeckx and Verbeeck2013) – Monodominant–F, Lewis et al. (Reference Lewis, Lopez-Gonzalez, Sonké, Affum-Baffoe, Baker, Ojo, Phillips, Reitsma, White and Comiskey2009) – G and Loubota Panzou, Fayolle, et al. (Reference Loubota Panzou, Fayolle, Feldpausch, Ligot, Doucet, Forni, Zombo, Mazengue, Loumeto and Gourlet-Fleury2018a) –H ) and AGB obtained using tree height from the specific height–diameter equation fitted in this study at the subplot (0.25 ha) level (b) in mixed and monodominant forests. The grey dotted line represents the 0 error for tree AGB (a) and the 1 error for subplot AGB (b).
In sum, no literature equation was an accurate model to predict the tree height and AGB in monodominant forests. However, the height–diameter allometry fitted by Lewis et al. (Reference Lewis, Lopez-Gonzalez, Sonké, Affum-Baffoe, Baker, Ojo, Phillips, Reitsma, White and Comiskey2009) showed a little RMSE and bias in height predictions and AGB estimation (Table 3) and can be used to predict the height in order to estimate the plot-level AGB when they do not have the local height data for both forest types.
Discussion
Taller trees and greater AGB in monodominant than in mixed forests
We found that the height–diameter allometry varied significantly between mixed and monodominant forests in northern Republic of Congo. This result is similar to the findings of Molto et al. (Reference Molto, Hérault, Boreux, Daullet, Rousteau and Rossi2014) at plot level in French Guiana and Fayolle et al. (Reference Fayolle, Loubota Panzou, Drouet, Swaine, Bauwens, Vleminckx, Biwole, Lejeune and Doucet2016) at species level in Cameroon, which shown that the two parameters of the Michaelis–Menten model varied with forest type. The two forest types have similar allometric trajectories but different resource allocation strategies over all diameter ranges (Hulshof et al. Reference Hulshof, Swenson and Weiser2015), indicating that ontogenetic patterns should be the key differences between the two forest types. Moreover, slender tree species with small maximum diameter size are known to grow in height at a faster rate and to have better access to light in the closing canopy (Loubota Panzou et al. Reference Loubota Panzou, Ligot, Gourlet-Fleury, Doucet, Forni, Loumeto and Fayolle2018b) than those with a larger diameter and therefore may also be more represented in the monodominant stands. The differences of the floristic composition has been shown to control variations in height–diameter models (Feldpausch et al. Reference Feldpausch, Banin, Phillips, Baker, Lewis, Quesada, Affum-Baffoe, Arets, Berry, Bird, Brondizio, de Camargo, Chave, Djagbletey, Domingues, Drescher, Fearnside, França, Fyllas, Lopez-Gonzalez, Hladik, Higuchi, Hunter, Iida, Salim, Kassim, Keller, Kemp, King, Lovett, Marimon, Marimon-Junior, Lenza, Marshall, Metcalfe, Mitchard, Moran, Nelson, Nilus, Nogueira, Palace, Patiño, Peh, Raventos, Reitsma, Saiz, Schrodt, Sonké, Taedoumg, Tan, White, Wöll and Lloyd2011; Banin et al. Reference Banin, Feldpausch, Phillips, Baker, Lloyd, Affum-Baffoe, Arets, Berry, Bradford, Brienen, Davies, Drescher, Higuchi, Hilbert, Hladik, Iida, Salim, Kassim, King, Lopez-Gonzalez, Metcalfe, Nilus, Peh, Reitsma, Sonké, Taedoumg, Tan, White, Wöll and Lewis2012). The results of Banin et al. (Reference Banin, Feldpausch, Phillips, Baker, Lloyd, Affum-Baffoe, Arets, Berry, Bradford, Brienen, Davies, Drescher, Higuchi, Hilbert, Hladik, Iida, Salim, Kassim, King, Lopez-Gonzalez, Metcalfe, Nilus, Peh, Reitsma, Sonké, Taedoumg, Tan, White, Wöll and Lewis2012), for example, showed that Asian forests, which have many individuals from the dominant family of Dipterocarpaceae, tended to be taller than America and Africa mixed forests. The great height and biomass in Dipterocarp forests have been interpreted in the light of the dispersal strategy (dominance of wind dispersal), and this result has also been found in Central Africa for the dominant species (Loubota Panzou et al. Reference Loubota Panzou, Ligot, Gourlet-Fleury, Doucet, Forni, Loumeto and Fayolle2018b). In addition, other ecological factors could also explain the variation in height attributes, such as the functional composition of the canopy species.
Based on the specific height–diameter allometric model for each forest type, the Lorey’s mean height was higher in the monodominant forest than in the mixed forest. The Lorey’s mean height, which was higher in the monodominant forest than in the mixed forest, is widely used in AGB maps derived from LiDAR data (Saatchi et al. Reference Saatchi, Harris, Brown, Lefsky, Mitchard, Salas, Zutta, Buermann, Lewis, Hagen and Petrova2011). Taller trees in African monodominant forests could be the result of an environmental control that facilitates resource acquisition. For example, soil carbon to nitrogen ratio and carbon to phosphorus ratio are significantly higher under G. dewevrei stands than in mixed forest stands, suggesting a higher acquisition of soil nitrogen and phosphorus from soil organic matter by ectomycorrhizal fungi (Hall et al. Reference Hall, Harris, Saltonstall, Medjibe, Ashton and Turner2019). In the monodominant forest, G. dewevrei could outcompete many species (Makana et al. Reference Makana, Ewango, McMahon, Thomas, Hart and Condit2011) through the deep leaf litter that it creates. Leaf litter from G. dewevrei decomposes slowly and could inhibit the establishment of small seeded species, which have fewer resources than big seeded species such as G. dewevrei, and could also potentially cause a low availability of soil nitrogen (Torti et al. Reference Torti, Coley and Kursar2001) and phosphorus, possibly related to ectomycorrhizal associations formed with G. dewevrei (Kearsley et al. Reference Kearsley, Verbeeck, Hufkens, Van de Perre, Doetterl, Baert, Beeckman, Boeckx and Huygens2017b).
AGB estimations with 445 and 353 Mg dry mass ha−1 for trees ≥ 10 cm diameter for the monodominant and mixed forests, respectively, are in the range of values previously reported from old-growth forests in Central Africa (Djuikouo et al. Reference Djuikouo, Doucet, Nguembou, Lewis and Sonke2010, Reference Djuikouo, Peh, Nguembou, Doucet, Lewis, No, Lewis and Sonké2014, Makana et al. Reference Makana, Ewango, McMahon, Thomas, Hart and Condit2011, Kearsley et al. Reference Kearsley, de Haulleville, Hufkens, Kidimbu, Toirambe, Baert, Huygens, Kebede, Defourny, Bogaert, Beeckman, Steppe, Boeckx and Verbeeck2013, Reference Kearsley, Moonen, Hufkens, Doetterl, Lisingo, Boyemba Bosela, Boeckx, Beeckman and Verbeeck2017a, Lewis et al. Reference Lewis, Sonke, Sunderland, Begne, Lopez-Gonzalez, van der Heijden, Phillips, Affum-Baffoe, Banin and Bastin2013, Slik et al. Reference Slik, Paoli, McGuire, Amaral, Barroso, Bastian, Blanc, Bongers, Boundja, Clark, Collins, Dauby, Ding, Doucet, Eler, Ferreira, Forshed, Fredriksson, Gillet, Harris, Leal, Laumonier, Malhi, Mansor, Martin, Miyamoto, Araujo-Murakami, Nagamasu, Nilus, Nurtjahya, Oliveira, Onrizal, Parada-Gutierrez, Permana, Poorter, Poulsen, Ramirez-Angulo, Reitsma, Rovero, Rozak, Sheil, Silva-Espejo, Silveira, Spironelo, ter Steege, Stevart, Navarro-Aguilar, Sunderland, Suzuki, Tang, Theilade, van der Heijden, van Valkenburg, Van Do, Vilanova, Vos, Wich, Wöll, Yoneda, Zang, Zhang and Zweifel2013). There was a significant variation in 0.25-ha subplot-level AGB between monodominant and mixed forests, in agreement with the results of Kearsley et al. (Reference Kearsley, de Haulleville, Hufkens, Kidimbu, Toirambe, Baert, Huygens, Kebede, Defourny, Bogaert, Beeckman, Steppe, Boeckx and Verbeeck2013) in Democratic Republic of Congo. These AGB estimates would be overestimated if these inaccurate height–diameter models were used for mixed and monodominant forests (Kearsley et al. Reference Kearsley, de Haulleville, Hufkens, Kidimbu, Toirambe, Baert, Huygens, Kebede, Defourny, Bogaert, Beeckman, Steppe, Boeckx and Verbeeck2013). The huge difference in AGB between monodominant and mixed forests could be rather due to stand density (tree number and size) than the specific height–diameter model, since the use of general height–diameter model showed the same results (454 and 361 Mg dry mass ha−1 for trees ≥ 10 cm diameter for monodominant and mixed forests, respectively). Large-sized individuals within both mixed and monodominant forests are important for forest function, as demonstrated in Central Africa (Kearsley et al. Reference Kearsley, Hufkens, Verbeeck, Bauters, Beeckman, Boeckx and Huygens2019). Loubota Panzou et al. (Reference Loubota Panzou, Ligot, Gourlet-Fleury, Doucet, Forni, Loumeto and Fayolle2018b) showed also that large-statured canopy species tended to contribute more to forest AGB than understorey species. As an upper canopy species, G. dewevrei might benefit more from increased potential carbon gain as opposed to mixed forest. Although large trees are important contributors to AGB stocks, small trees strongly contribute to AGB annual gains in Central Africa (Ligot et al. Reference Ligot, Gourlet-Fleury, Ouédraogo, Morin, Bauwens, Baya, Brostaux, Doucet and Fayolle2018). There is a balance/equilibrium to be found between old trees that store lots of carbon but have low carbon gains and small trees which have low carbon stocks, but higher carbon gains.
Comparison of height–diameter allometric models
The height values predicted from equations fitted by this study did not differ from the measured height, suggesting a better performance of locally parametrised height–diameter models than literature height–diameter equations for both monodominant and mixed forests. This is in agreement with the results of Ledo et al. (Reference Ledo, Cornulier, Illian, Iida, Kassim and Burslem2016) for three tropical forests (a lowland semi-deciduous forest in Panama, a lowland evergreen rain forest in Malaysia and a montane cloud forest in Peru). Based on the best height–diameter equation for each forest type, the error of height prediction is greater for very large trees, resulting in a negative bias in AGB estimation.
Although measurement errors due to height estimation from the ground are not accounted for in our analyses, they are unlikely to differentially affect the performance of different height–diameter models from the literature. Some literature height–diameter equations generated severely biased height predictions and should not be used. The selection of inaccurate height–diameter models in previous studies may have yielded inaccurate estimates of AGB and consequentially wrong carbon stock values. The use of a power model is problematic when large trees are included, because the most biased height–diameter allometric equations are those using power model expressions (Feldpausch et al. Reference Feldpausch, Banin, Phillips, Baker, Lewis, Quesada, Affum-Baffoe, Arets, Berry, Bird, Brondizio, de Camargo, Chave, Djagbletey, Domingues, Drescher, Fearnside, França, Fyllas, Lopez-Gonzalez, Hladik, Higuchi, Hunter, Iida, Salim, Kassim, Keller, Kemp, King, Lovett, Marimon, Marimon-Junior, Lenza, Marshall, Metcalfe, Mitchard, Moran, Nelson, Nilus, Nogueira, Palace, Patiño, Peh, Raventos, Reitsma, Saiz, Schrodt, Sonké, Taedoumg, Tan, White, Wöll and Lloyd2011). Power models assume an increasing curve that never reaches an asymptote. In mixed forests, non-linear distribution models approaching a horizontal asymptote for trees with large diameters are more realistic (equations of Banin et al. (Reference Banin, Feldpausch, Phillips, Baker, Lloyd, Affum-Baffoe, Arets, Berry, Bradford, Brienen, Davies, Drescher, Higuchi, Hilbert, Hladik, Iida, Salim, Kassim, King, Lopez-Gonzalez, Metcalfe, Nilus, Peh, Reitsma, Sonké, Taedoumg, Tan, White, Wöll and Lewis2012) in Africa and Feldpausch et al. (Reference Feldpausch, Lloyd, Lewis, Brienen, Gloor, Monteagudo Mendoza, Lopez-Gonzalez, Banin, Abu Salim, Affum-Baffoe, Alexiades, Almeida, Amaral, Andrade, Aragão, Araujo Murakami, Arets, Arroyo, Aymard, Baker, Bánki, Berry, Cardozo, Chave, Comiskey, Alvarez, De Oliveira, Di Fiore, Djagbletey, Domingues, Erwin, Fearnside, França, Freitas, Higuchi, Honorio, Iida, Jiménez, Kassim, Killeen, Laurance, Lovett, Malhi, Marimon, Marimon-Junior, Lenza, Marshall, Mendoza, Metcalfe, Mitchard, Neill, Nelson, Nilus, Nogueira, Parada, Peh, Pena Cruz, Peñuela, Pitman, Prieto, Quesada, Ramírez, Ramírez-Angulo, Reitsma, Rudas, Saiz, Salomão, Schwarz, Silva, Silva-Espejo, Silveira, Sonké, Stropp, Taedoumg, Tan, Ter Steege, Terborgh, Torello-Raventos, Van Der Heijden, Vásquez, Vilanova, Vos, White, Willcock, Woell and Phillips2012) in Central Africa). Predicted heights differ from the measured values by only a few meters for large trees and by a few centimetres for smaller trees. In contrast, no height–diameter model from literature was appropriate for the tree height prediction and AGB estimation in the monodominant forests. This particular result and the significant biases associated with regional height–diameter models confirmed the need for local site-specific models (Chave et al., Reference Chave, Réjou-Méchain, Búrquez, Chidumayo, Colgan, Delitti, Duque, Eid, Fearnside, Goodman, Henry, Martínez-Yrízar, Mugasha, Muller-Landau, Mencuccini, Nelson, Ngomanda, Nogueira, Ortiz-Malavassi, Pélissier, Ploton, Ryan, Saldarriaga and Vieilledent2014). The use of specific height–diameter allometry for monodominant forests should have strong practical implications for carbon monitoring in African tropical forests.
Conclusion
This study provides new data, which supports the argument that the specific height–diameter allometric model should be used in AGB estimates for each forest type. In northern Republic of Congo, there were important differences in height–diameter allometry with > 2 m as the difference of height predictions between mixed and monodominant forests. These results reinforce the conclusions of Kearsley et al. (Reference Kearsley, de Haulleville, Hufkens, Kidimbu, Toirambe, Baert, Huygens, Kebede, Defourny, Bogaert, Beeckman, Steppe, Boeckx and Verbeeck2013) on the need to use the appropriate height–diameter model for each forest type to estimate with accurate the AGB and carbon stocks. It is likely that AGB estimates for monodominant forests in many previous studies are biased owing to the use of inappropriate height–diameter allometric equations. Monodominant forests are unique in terms of their forest ecology and, most importantly, forest structure, and thus require the use of specific height–diameter equations. Improved equations for AGB calculations will have strong practical implications for carbon monitoring in African tropical forests.
Supplementary material
To view supplementary material for this article, please visit https://doi.org/10.1017/S0266467421000183
Acknowledgements
This study is a contribution from the PREREDD+ in Republic of Congo, the regional project on 2b component of the project ‘Building allometric equations for the forests of the Congo basin’. We would like to acknowledge the CIB-OLAM for the logistic support necessary to field measurements. We also acknowledge Wallonia-Brussels International (WBI) for its financial support. The authors also thank the large number of technicians and students who were involved in the data collection. We gratefully acknowledge Dr Greta Dargie, Dr Lidiany Carvalho and D. Giacomo Sellan for the very useful comments on an earlier version of the manuscript.


