


In the summer of 1671, the naturalist Nicolaus Steno (1638–86) headed north towards the Alps, equipped with tools to measure length and temperature. Authorized by the Accademia del Cimento and Cosimo III de’ Medici (1642–1723), Grand Duke of Tuscany, to revise the ancient scholarly concept of ‘antiperistasis’ in nature, Steno set out to investigate and gather data in the ice caves of Gresta (Trentino) and Moncodeno (Lombardy). Originating with Aristotle, the concept of ‘antiperistasis’ was based on the idea that one quality increases the force of another, contrasting quality. It was used as a general explanatory model for numerous natural phenomena.Footnote 1 In particular, reports that alpine caves produce their ice during the summer months were invoked to support the existence of ‘antiperistasis’. This phenomenon intrigued Steno and motivated him to make his own observations on site. Roughly drawn sketches of Moncodeno Ice Cave (Figure 1), including two sections in astonishing detail, were attached to the two reports he sent to Cosimo.Footnote 2 More than mere illustrations, these images constituted a central part of Steno's argument, clearly distinguishing between the different shapes of ice formations and assigning them specific locations inside the cave. Furthermore, they reinforced his decisive argument against ‘antiperistasis’, namely that the low temperature inside the cave was caused by the accumulation of snow at the entrance, and not by a concentration of cold air reacting in opposition to the heat outside.Footnote 3 According to Luca Ciancio, Steno's field research employed interrelated methods including ‘the use of measuring instruments for dimensions and temperature [and] the visual representation of structures, plans and profiles’.Footnote 4 To quote M. Norton Wise, Steno's survey was ‘not illustration, but argument’.Footnote 5
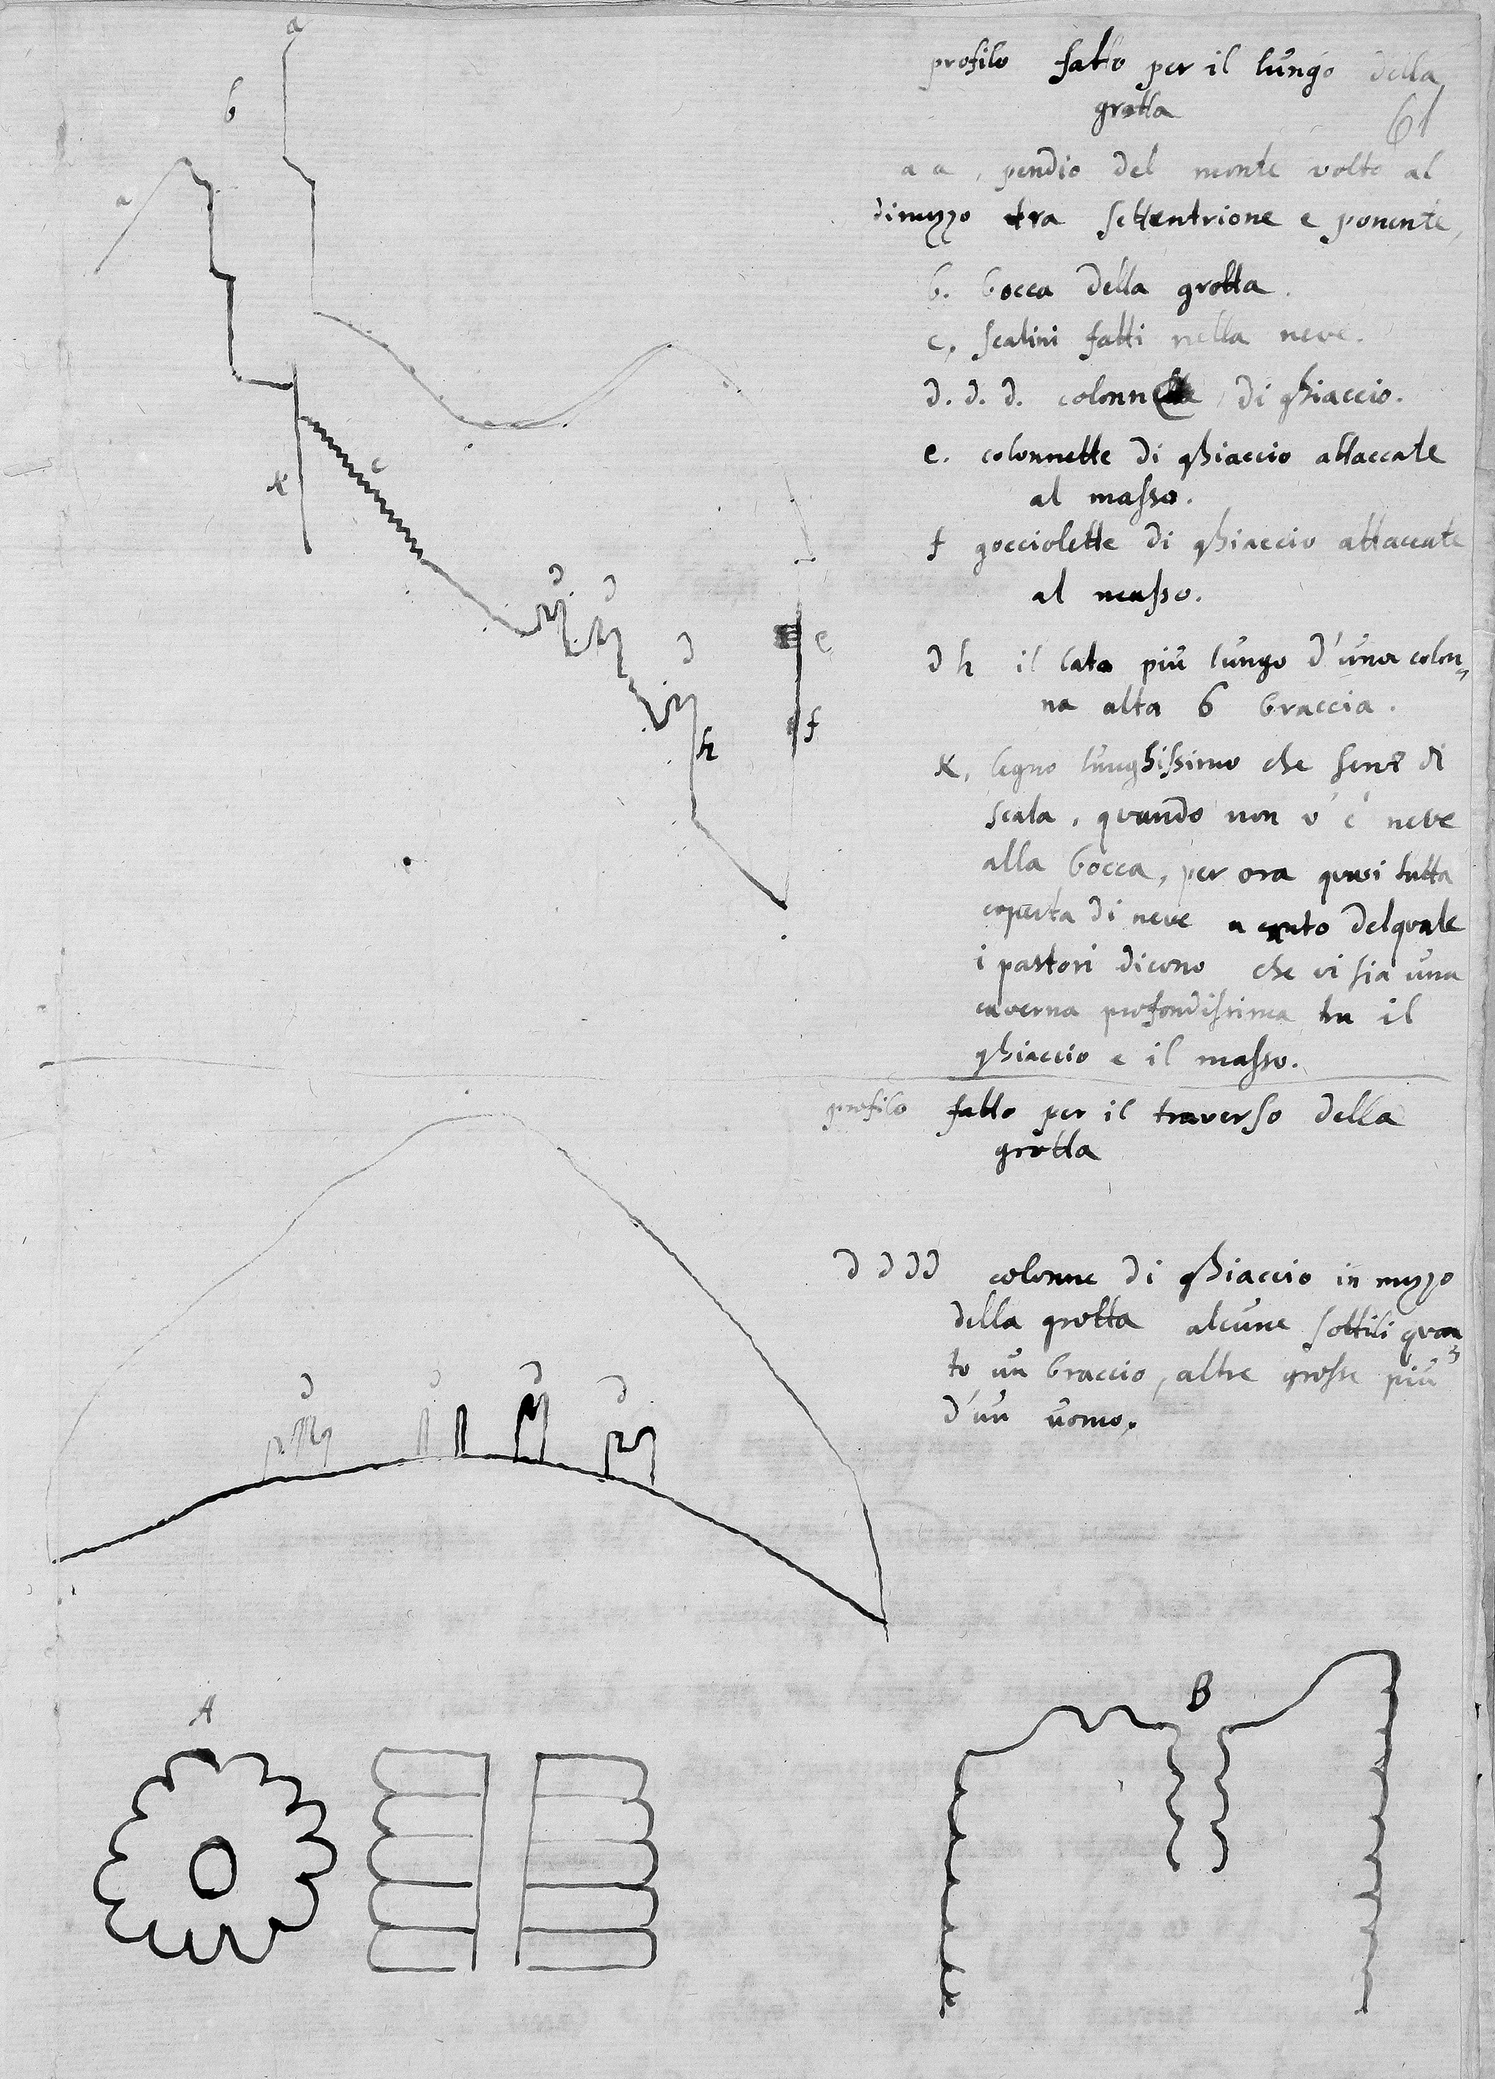
Figure 1. Longitudinal section (top) and cross-section (centre) of Moncodeno Ice Cave (Lombardy), drawn by Nicolaus Steno in 1671 (National Central Library of Florence, Ms., Gal. 286/32, p. 61r). Steno clearly illustrates the descent (c) into the cave and the ice formations that present as columns (d) in the centre of the hall and on its walls (e, f). The text on the right side of the sheet provides additional information, for example, about a deep shaft (x) located next to the steps (c), where shepherds report that stones thrown down there make a long rolling noise. The drawings on the bottom of the page illustrate the different shapes of ice figures which were formed by drops of water falling from the ceiling.
Maps were often used in epistemic settings that combined various fields of knowledge and empirical observation practices.Footnote 6 Although Steno's naturalistic style and his use of maps in scientific argumentation are rather exceptional for his period, they anticipate the later large-scale adoption of the map format for visualizations of natural cavities. Unravelling the different layers of visual argumentation, this paper will examine early modern cave maps as representations of subterranean space; more precisely, as a space of representation in which knowledge, objects, epistemes and their interactions in space and time are discussed and legitimized.
Towards the end of the eighteenth century, increased awareness of sensory perception and debates around the limits of human knowledge were closely connected to the development of a visual culture in earth sciences and scholarly efforts towards a common geological perspective. Martin Rudwick's 1976 paper ‘The emergence of a visual language for geological science’, in which he examines the growing number and broader diversity of images in geological literature around the turn of the nineteenth century, draws our attention to naturalists’ visualization strategies when carrying out fieldwork or communicating their results in publications.Footnote 7 This milestone paper fostered scholarly interest in visual sources (such as maps, sections and landscapes), as well as in the materials, techniques and artisans involved in their production. Discussing the interconnection of ‘major changes in geoscience cartography … shifting scientific preoccupations and convictions’, Kenneth Taylor's essay ‘Early geoscience mapping, 1700–1830’ analyses the broad range of mineralogical, stratigraphic, mining-related and topographic mapping, tracing its diversity back to the ‘theoretical pluralism that characterized geology for many years, well beyond its establishment as a recognized science’.Footnote 8 Referring directly to Rudwick, Taylor points out that the development of these visual representations should be recognized as more than ‘a set of changes in technique, since technical alterations are tied to adjustments in ideas about the things it may be profitable to represent cartographically’.Footnote 9
In the wake of Rudwick's paper, a wealth of literature has been written about the visualization of geological features. Important contributions have been made by William Ashworth (writing about basalt), Jane Davidson and Martin Rudwick (fossils), Susanne Keller (earthquakes) and David Oldroyd and Simon Winchester (geomaps), to mention only a few.Footnote 10 Studies by art historians such as Fritz Emslander and Barbara Stafford have also shown how visualizations of geological phenomena were pre-shaped by artistic representations.Footnote 11
Although some of the wide-ranging surveys mentioned above also deal with mine maps, comparatively little attention has been paid to caves and their impact on early modern concepts of nature. Ernst Hamm's pioneering article ‘Knowledge from underground: Leibniz mines the Enlightenment’ identifies mines and caves as objects of scholarly curiosity in the eighteenth century. Recognizing subterranean geographies both as ‘an instrument for managing the mine’ and as a ‘method for understanding the earth’, Hamm argues that, due to limited physical access, maps of the underground ‘were needed to make the invisible visible, and to do so required many generalizations and hypotheses about the way the earth's crust was structured’.Footnote 12 Michael Shortland's ‘Darkness visible’ takes a similar approach, drawing connections between the power of subterranean imagery, romanticism and politics, and dissecting how the undercurrents of ‘cavelove and cavelore’ in early nineteenth-century Britain shaped a ‘formative period in modern geology’.Footnote 13 Attributing a ‘central position in geological theory’ to natural cavities, Nicolaas Rupke looks at the study of fossils in Romantic natural philosophy and the visualization of stratigraphic columns.Footnote 14 Another valuable paper by Luca Ciancio (see above) uses the activities of Athanasius Kircher and Nicolaus Steno as a basis for examining early practices of scientific fieldwork in caves.Footnote 15 Focusing on Central Europe, a volume by Johannes Mattes presents a longue durée cultural history of knowledge-based interactions with cavities and other subterranean sites, especially their visualization by scholars and artists.Footnote 16 Equally important is the contribution of Patrick Anthony, who comments on the entanglements of ‘underground enlightenment’ and vertical cartography with reference to mines in the Harz mountains.Footnote 17
Covering the spectrum from surveying technologies, via resources, to the significance of vertical spaces, recent scholarship in history of science, environmental history, urban studies and (political) geography has broadened our understanding of subterranean geographies as dynamic multidimensional landscapes of social practice, and of their role as interaction facilitators.Footnote 18 Compared to artificial spaces such as mines, catacombs and bunkers, considerably less is known about the scientific impact of natural cavities, especially when it comes to cave surveying and the practices of knowledge involved.Footnote 19 Some handbooks, such as the multi-volume History of Cartography series, even classify cave plans as a separate type of topographical map, ‘drawn in plan view with generalized walls shown as solid lines. Because … direct field survey remains the only reliable method for mapping them, cave exploration and mapping have been closely coupled since the 1800s’.Footnote 20 Although the Encyclopedia of Caves and Karst Science mentions more than a dozen cave maps made before 1800, the authors’ interest is focused on the nineteenth and twentieth centuries and on how improved exploration techniques informed the science of speleology (the study of caves) as a whole.Footnote 21 Vlado Božić, Stephan Kempe et al., José Lima et al., Johannes Mattes, Michael Sutton and Petr Zajíček pursue a similar line of inquiry in their own various, very useful approaches to the topic, which mostly deal with the history of cave cartography based on case studies of single caves or regions.Footnote 22 Trevor Shaw's History of Cave Science, which contains several reproductions of unique sources that he examines in the context of cave exploration, deserves particular recognition.Footnote 23
Since the publication of John Brian Harley's seminal essay ‘Deconstructing the map’ and Derek Gregory's work on ‘imagined geographies’, geographers and historians of cartography have paid considerably more attention to the power-related constructive character of spatial knowledge, its relation to imagination and its social and discursive framework.Footnote 24 The critical approaches of scholars such as Simon Naylor and David Turnbull interrogate established paradigms of cartography and argue for maps as tools of knowledge production and translation, underlining their importance for historians of science.Footnote 25 Of particular relevance is a recent paper by Charles Withers, who calls for a deeper evaluation of the epistemological issues of trust and credibility in geography and the ways these are secured.Footnote 26 Referring to the valuable work done in this regard by David Livingstone and Steven Shapin, the author asks how ‘technologies’ of credibility building, such as surveying and mapping, were able to ‘inscribe trust in space’ despite ‘the instruments involved running slow or breaking’.Footnote 27 This is especially true for cave environments, which, due to difficulty of access and limited vision underground, created an epistemic setting in which imagination and empiricism interacted and specific scholarly strategies were required to establish credibility.
In recent years, I have been able to study more than 120 maps made before 1800, covering both natural caves and artificial cavities (where these were believed to be of natural origin at the time the plan was made). Starting from an exceptional 1417 drawing of Labyrinth Cave near Gortyn (Crete), the sources comprise maps of caves located in Europe, Siberia (from the early eighteenth century onwards) and the Americas (from the late eighteenth century). In contrast, the earliest preserved maps of caves in Africa, Australia and other parts of Asia date back to the first decades of the nineteenth century and are therefore not considered in this article. While maps made after 1800 vary significantly in their designated use depending on who created or commissioned them, early modern maps were almost exclusively aimed at scholars, travellers and learned aristocrats. They were either made by scholarly authors and publishers or else commissioned by them from engineers, surveyors or painters, and were mostly published within travel accounts, country descriptions or scholarly treatises. Cave maps have also been preserved in provincial and state archives located in karst and cave areas, as well as the personal estates of various scholars. Other commonalities that justify a comparative study are that all of these surveys originated from personal observation, and that they can be clearly distinguished from artistic depictions by the use of cartographic features. From the range of these maps, I will deal primarily with caves which were known among scholars and/or mapped several times. However, schematic representations of underground watercourses (such as in Athanasius Kircher's ‘Mundus subterraneus’) which do not depict a specific cave are not included in this study.Footnote 28
Comparing these unique sources raises questions regarding their ‘experimental’ character, which interweaves various spheres of knowledge, evidence-based practices and elements of the contemporary imagination about the Earth's interior. Constituting a shared point of interest for early modern naturalists, surveyors, travellers, artists and (local) collectors, caves can also be understood as ‘boundary objects’ connecting different meanings and communities of practice.Footnote 29 It is my contention that, unlike mines and other subterranean or remote spaces of knowledge production, the specific conditions of cave environments – such as their labyrinthine topography, impassability, isolation and obscurity – gave rise to distinct ways of handling both knowledge and the different kinds of objects found there, such as minerals, fossils and artefacts. In these underground sites, limited vision presented a challenge to the early modern practice of providing evidence based on experience, casting contemporary cultures of perception into doubt.
The premise of this article is that mapping subterranean geographies was an important technology of credibility building, even though any such endeavour was founded on non-empirical aspects such as ambiguity and lack of knowledge. Cave maps showed significantly more than early modern surveyors could actually see. I contend that the act of making them was not just knowledge-based, but creative: a translation process that blurred the traditional boundaries between natural, unnatural and supernatural. This means that cave maps are not only a ‘sensitive indicator of the changing thought of man’ about the subterranean world, but also epistemic tools that made it possible to observe the invisible, empowering the viewer to see and believe in structures within the Earth's crust that would otherwise remain unknown to them.Footnote 30 In its broad scope, this article discusses in depth the process by which early modern visualizations of underground space in the form of cave maps became powerful tools of scientific reasoning, even as they confronted considerable epistemic uncertainty. The interplay of empiricism and imagination, cartographic practices, the techniques involved in the legitimization of knowledge and the subsequent embedding of these maps in scholarly discourse are all focuses of my analysis. My case study therefore contributes to a better understanding of the grounds and means of scientific credibility and cartographic representation by furnishing new insights into these under-studied sites of natural history.
First of all, I will discuss the impact of limited vision and the intermediate meaning of caves in early modern maps, and show how a complex set of interrelations between empiricism and imagination gave rise to certain epistemic conventions in visualizing underground sites. In the second section, I will focus on the development of map design; interactions between naturalists, artisans and map users; and how surveying practices and measuring instruments shaped the process of credibility building and the claim to accuracy. Outlining their changing epistemic functions, the final section analyses how cave maps were used as scientific arguments and became embedded in causal thinking about natural history.
Landscapes of translation: between empiricism and imagination
Limited vision
For many scholars of the early modern world, studies of natural history were unthinkable without the first-hand, arduous experience of personal travel. Like above-ground journeys, excursions underground followed predetermined itineraries and were associated with visual expectations, encounters and illusions. Since Plato's analogy of the cave, subterranean sites, with their inherent liminality, have been understood as the prototype of an epistemic laboratory where the limitations of human perception are examined in an experimental setting.Footnote 31 According to contemporary accounts, the multi-sensory experience of descending into heavy and humid darkness and encountering objects of uncertain origin not only overwhelmed many naturalists, but also undermined their trust both in their own observations and in the descriptions of previous visitors.
The Protogaea, a posthumously printed treatise on the history of the Earth by the prominent German polymath Gottfried W. Leibniz (1646–1716), includes probably the best-known early modern map of a cave.Footnote 32 Based on a survey published fifty years earlier by Hermann von der Hardt (1660–1746) and modified most likely according to Leibniz's directives – or even by Leibniz himself – the unsigned map is a visual representation of the detailed report of his subterranean sightseeing trip to Baumannshöhle cave (Harz mountains). In this report, Leibniz addresses the curiosities, such as mineral formations and fossils, that he encountered along the way and their distorted perception by many visitors:
In one column, they think they see a monk; in another, Moses with two horns. Not far from Moses, and in various other places, are the bones of large animals and river pebbles, enclosed as if by the same mortar. But the games of nature presented in these caves demand the support of imagination. For they point out the Ascension of Christ stamped in the rock, a baptismal font, something that looks like an oven, an organ, a forest, and who knows what else … To consider the nature of the rock more carefully, I ordered that some pieces be broken off to examine with leisure at home.Footnote 33
Leibniz recognized caves as mutable spaces where the narrowing and delimitation of the visitor's field of vision generated an illusionary world shaped by the viewer's prior experience and imaginative power. Although he personally distinguished between in-depth observation and imagination, the map as revised by Leibniz unites both domains. While he took over some of the anthropomorphic depiction of stalactites and other curiosities from the previous survey, Leibniz also added highly detailed depictions of his own findings, such as petrified bones, which he inserted around the part adopted from von der Hardt's original map. His critical examination of sensory perception and the mind's reflection on what the senses perceive exemplifies the tension in which most early modern cave maps are embedded. As media of translation, cave maps engage with the dual function of the subterranean realm as a space of empiricism and imagination. The frequent reuse and adaptation of existing visualizations complied with the user's expectations of how the space should look, and satisfied their habits of reception.
The three-dimensional topography of caves, and the impossibility of illuminating them, mean that many areas (e.g. ceilings, slopes, deep pits or vast chambers) remain partly invisible. This in turn means that ‘translating’ subterranean landscapes into map format may have been even more demanding for surveyors than were above-ground topographic maps.Footnote 34 In narrow passages or canyons, the field of view is blinkered and does not extend beyond the next turn. Similarly, the low intensity of the available light sources had a considerable effect on the observation of large-scale sections. For example, the English naturalist John Beaumont (c.1650–1731) reported on his 1681 visit to Lamb Leer Cavern (Somerset) in the Philosophical Collections that ‘by the light of our candles we could not fully discern the roof, floor, nor sides’ of the cave.Footnote 35 Lowered by miners fourteen fathoms on a rope, Beaumont did not hold back from giving details of the dimensions of a vast chamber even though he himself could only see part of it.
Travellers and their guides chose from the broad variety of illuminants according to different needs. While wax candles were reserved for prestigious public and private rooms due to the scarcity of raw material, the ‘dull light’ of miners’ lamps and smoky pinewood spills could only illuminate a narrowly confined space.Footnote 36 Torchlight – which is brighter, but produces a lot of smoke – met the visual expectations of an experience-oriented audience.Footnote 37 Contrasting shadows transformed the ‘dark night of the cave’ into a ‘starry firmament … in which the stalactites shone like stars’.Footnote 38 However, this did not satisfy the demands of the surveyors.
Maps display no evidence of these adversities, nor of the other visual limitations naturalists faced while crawling, descending or climbing in total darkness. The scholars’ awareness of enormous areas in the Earth's underground, which cannot be illuminated by torches or penetrated by human perception, gave rise to specific strategies for dealing with the invisible and establishing credibility. Rather than employing ‘cartographic silence’ – a term coined by John Brian Harley to designate spaces intentionally left blank in order to denote the unknown – cave maps dissected the Earth's subsurface by choosing a very detailed form of presentation and/or providing imaginative illustrations of hidden areas.Footnote 39 Like artists, mapmakers were urged to ‘complete similarities that nature had only outlined’.Footnote 40 But maps, which penetrated beyond the surface of the Earth and incorporated experiences gathered in exploration, were more reliable than paintings. Powerful tools of persuasion, ground plans and longitudinal sections lifted off the top or the side of a mountain and illuminated hidden geographies.
A comparison of two sketches of Kungur Ice Cave (Ural mountains), based on surveys by the Russian cartographer and polymath Semyon Remezov (1642–1720) and the German Johann Berckhan (1709–51), the painter attached to the second Kamchatka expedition, reveals these epistemic strategies. The first map (Figure 2A) was made in 1703 by order of Tsar Peter the Great and was subsequently copied by the Swedish military officer and cartographer Philipp von Strahlenberg (1676–1747), who printed the survey in his widely translated treatise on the Russian Empire.Footnote 41 The map guides visitors along an underground track past natural, unnatural and supernatural curiosities such as ice figures, an icon of Saint Nicholas and a fertile place where plants grow in darkness. Rather than leave invisible or unknown areas blank, the draftsman added fictional passages and chambers, emphasizing the cave's labyrinthine structure. Although this map became quite popular in eighteenth-century Europe and was reprinted in different styles and with variations in the objects depicted, the outlines of the galleries remained unchanged.
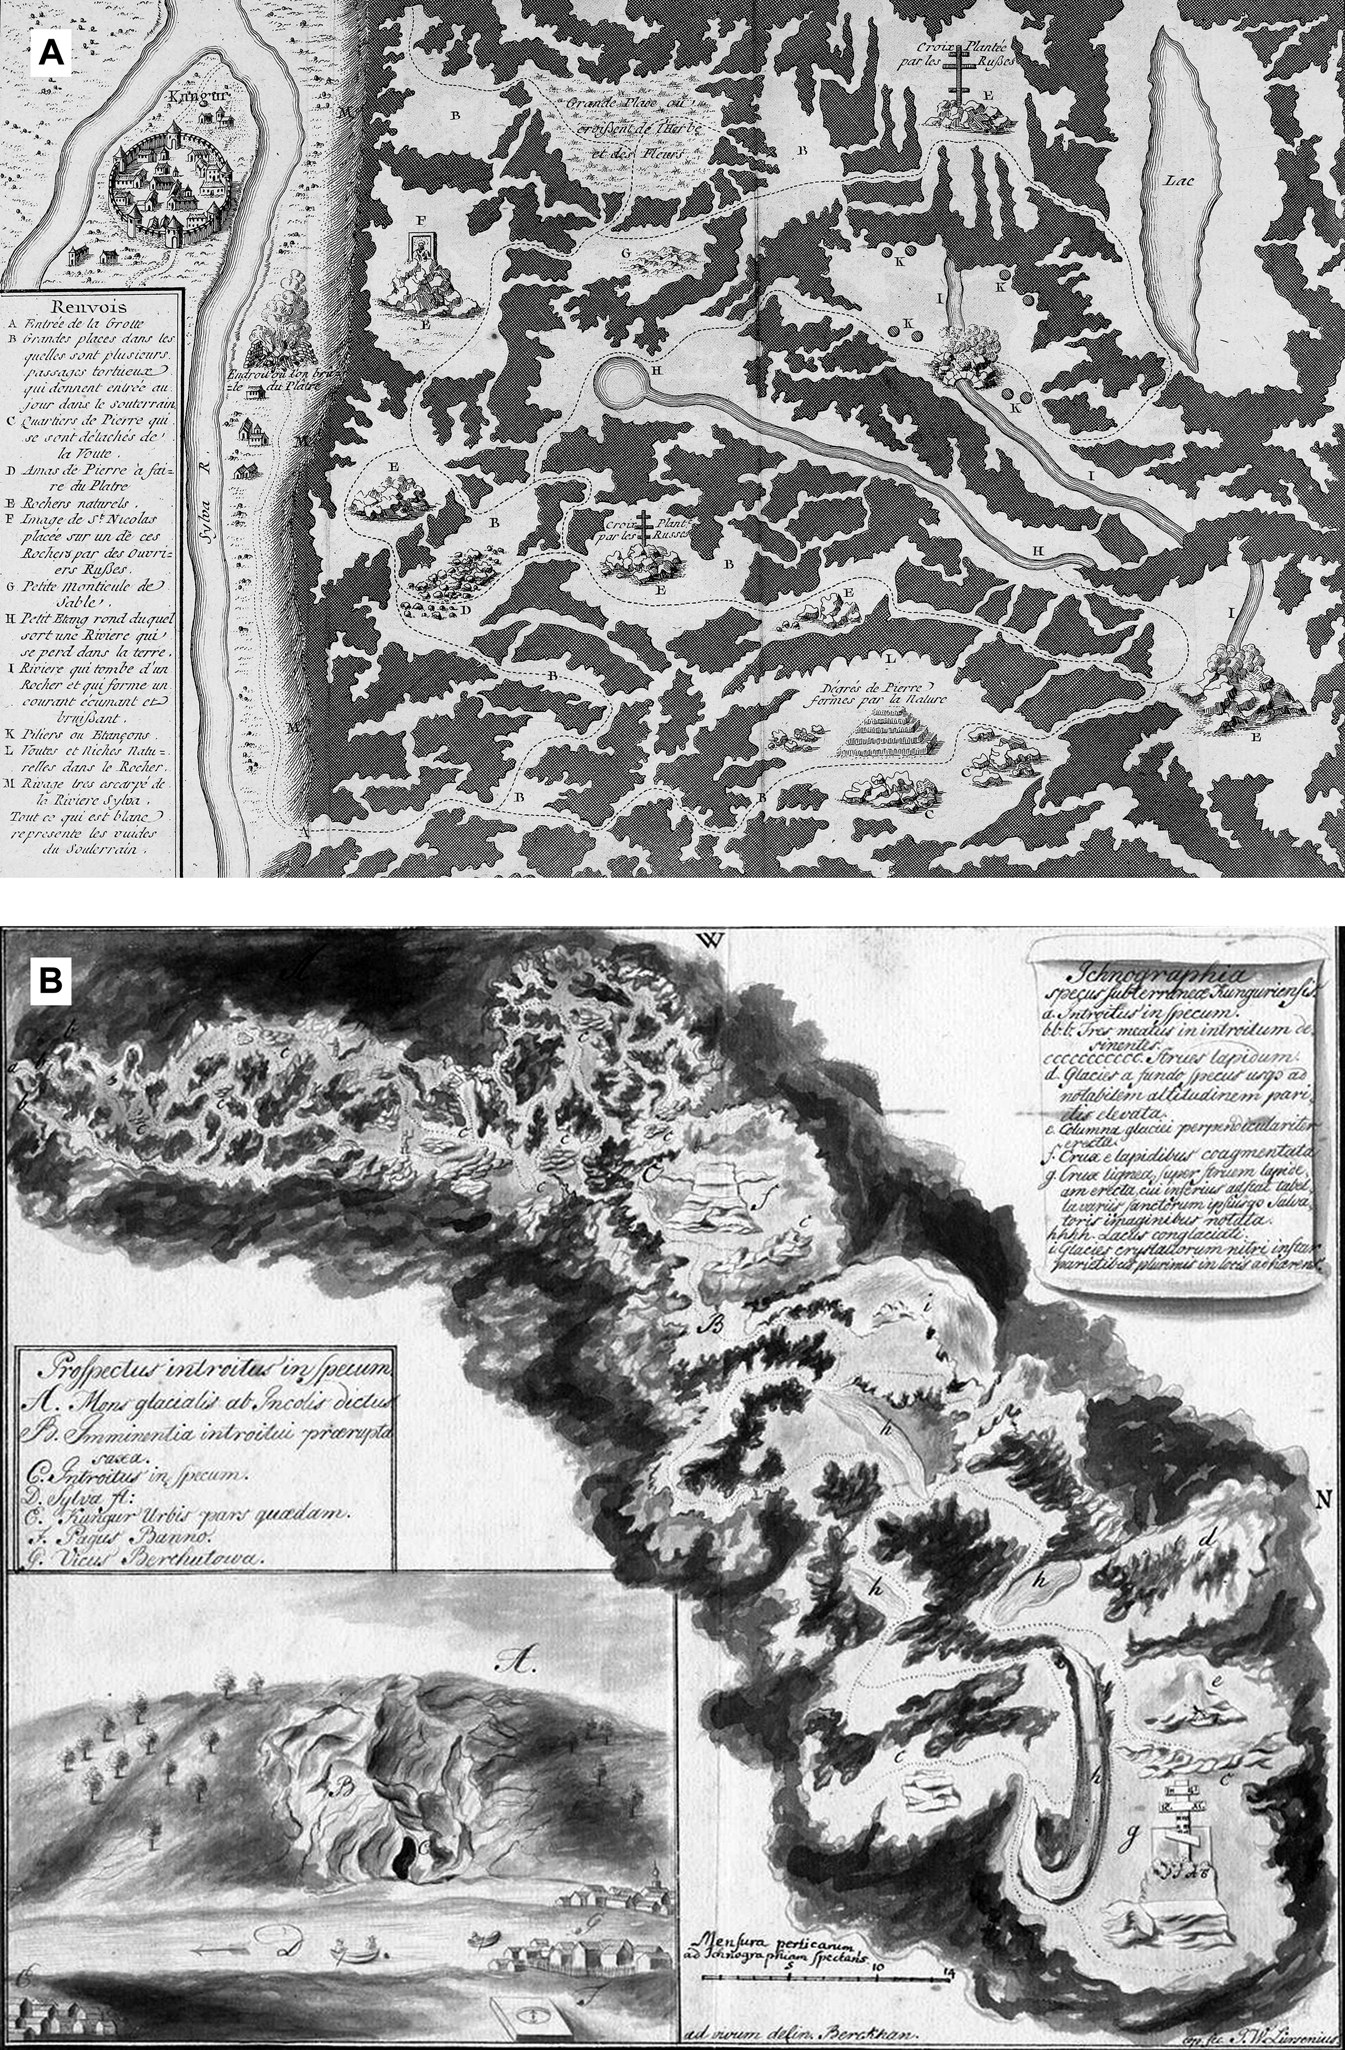
Figure 2. (A) Ground plan of Kungur Ice Cave (Ural mountains), surveyed by Semjon Remesov in 1703 and published in a slightly modified version in Alexandre Deleyre (ed.), Histoire générale des voyages, vol. 18, Paris: Rozet, 1768, p. 105 (Tab. VIII). (B) Ground plan of the same cave, surveyed by Johann Berckhan in 1733 (Russian State Archive of Ancient Acts, F. 199, Opt. 2, Portfolio 430, D. 20, p. 1). As with other early modern cave maps, the authors used map symbols that mimicked the shape of natural specimens. Their understanding required no prior knowledge as they were easy to understand intuitively. Both maps even included formal legends or entire paragraphs that explained abbreviations and clarified the relationship between the signifier and signified. In short, the accessible sign systems were intended for a wider audience.
On the contrary, Berckhan's unpublished map (Figure 2B), drawn during a 1733 venture together with the German botanist Johann Gmelin (1709–55) and the historian Gerhard Müller (1705–83), uses another strategy to prove its credibility to potential users.Footnote 42 Although, as the survey indicates, direction was measured by a magnetic compass and length was counted in steps, the draftsman was aware of the insufficiency of his empirical observations underground and of the tools used. Accordingly, he uses shading and transitions between grey and black to emphasize the uncertainty of sight and of the exact position of the outlines of the galleries. However, he precisely marks the track that he and his companions took during their venture and explains the curiosities and religious monuments he encountered in more detail in the map legend. Even though this sketch also contains imaginary sections intended to reinforce the impressive scale of the cave, the depiction of the paths actually taken conveyed confidence in the validity of the survey. Overall, the phenomenon of ‘cartographic silence’ – in other words, the acknowledgement of empirical limits – is rarely, if ever, found in early modern cave maps.
Shifting boundaries underground
Caves are polyvalent places, as we can see by their diversity of use: as burial places, religious sites, dwellings, refuges, food stores, repositories for natural resources, features (in the form of grottos) in landscape gardens and popular destinations on the Grand Tour. This polyvalence is also evident in the research accounts of scholars of the early modern world. Alchemists and naturalists assigned special significance to caves and mines as access points to fertile processes such as mineral growth and the genesis of ores.Footnote 43 Likewise, scholars experienced caves as ‘whole museums of stone’ that had apparently fallen into disarray, blurring the boundaries between the categories of natural history acknowledged in the scientific discourse of the time and making it difficult to identify the curiosities they encountered.Footnote 44 Furthermore, the presence of famous caves in mining areas, such as the Harz mountains, upper Hungary and the Yorkshire Dales, meant that there was little differentiation of knowledge related to diverse underground spaces, with cave and mine studies arising and developing in parallel.
Canonizing the growing curiosity about underground sights, the guidebooks to subterranean destinations that appeared in eighteenth-century Europe were not limited to natural caves but also included tombs and catacombs; the ancient ruins of baths, cisterns and temples; and garden grottos and pits.Footnote 45 Travellers distinguished less clearly than we might expect between natural and artificial cavities, as well as between the different kinds of objects discovered there.Footnote 46 The ontological hybridity of these boundary spaces can be seen, for instance, in scholarly hypotheses about cave formation. Drawing on their visits to underground quarries and catacombs in Rome, Syracuse and Paris, a number of naturalists concluded that particular natural caves were also the result of human excavation. The majority of hypotheses in which a given cave was assumed to be artificial were based on the observation of individual objects, and did not in themselves constitute an overarching theory. They mostly concerned naturally formed caves that had been expanded by humans; for example, for use as sites of worship.Footnote 47 For instance, the French naturalist Georges-Louis de Buffon (1707–88) argued that the caves of Arcy-sur-Cure (Bourgogne) were an underground quarry. Not long afterwards, the English topographer and antiquarian Samuel Rudder (c.1726–1801) maintained that Pen Park Hole near Bristol was a lead mine, no doubt on the basis that evidence of mining activity can be seen in parts of the cave.Footnote 48
Referring to and incorporating scholarly assumptions about the origins of particular caves in their own work, mapmakers developed specific strategies to deal with the hybridity and shifting boundaries of underground spaces. This is particularly evident in the case of cavities of uncertain origin, where the lack of clear information meant that maps had to convey an especially compelling narrative. The first example I would like to mention in this respect is a map made by the French military officer Mathieu Dumas (1753–1837) of the Labyrinth Cave (Crete): a system of underground galleries, probably used as an ancient quarry (Figure 3A).Footnote 49 The Labyrinth Cave was well known among travellers and was assumed to be the ruins of the mythological labyrinth of the Minotaur. Dumas investigated the cave in 1783 during a mission by order of the French king to gather information on the island's government and topography. Dumas's secret report to the sovereign, which included a map of Labyrinth Cave, was finally published in 1839.Footnote 50 In the scholarly debate over the hybrid origin of the cave, Dumas excluded its use as an ancient quarry, since other sites were more favourable and the labyrinth had only one entrance. Rather, he argued that ‘some parts of this cave are a whim of nature, and existed before the hand of man added anything to it’.Footnote 51 Dumas's ground plan, surveyed using compass and pacing, serves as a convincing argument for this hypothesis, making visual the on-site observations described in more detail in his report.Footnote 52 The map shows no traces of quarry work and the outlines of the galleries largely resemble a natural cavity. However, the addition of architecture-like straight and rectangular elements is intended to indicate that the cave had been artificially enlarged, but only to a small extent. According to Dumas, his ‘exact copy’ of this hybrid space favoured its natural origin.Footnote 53
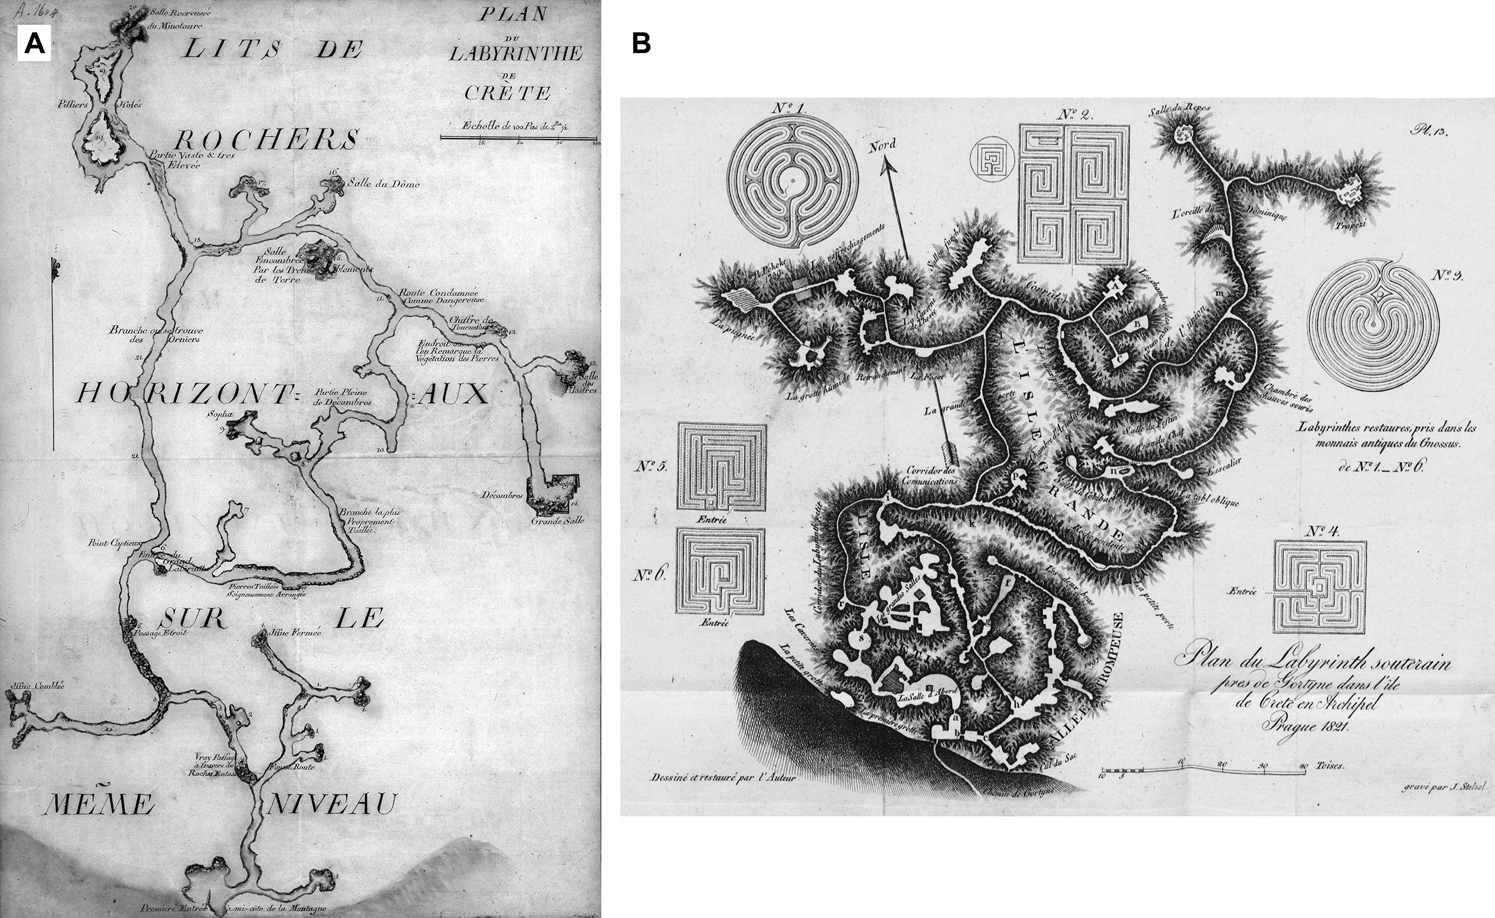
Figure 3. (A) Mathieu Dumas's 1783 ground plan of Labyrinth Cave (Crete) (Archives départementales des Yvelines, Collection graphique, FR/FR-AD078/A1604). (B) Ground plan of the same cave, made by the botanist Franz Sieber in 1821 and published in Franz Sieber, Reise nach der Insel Kreta im griechischen Archipelagus, vol. 2, Leipzig: Sorau, 1823, Tab. XIII. Similar to Figure 2B, Sieber adopted shading techniques to depict the outlines of galleries. Shading had already been used to depict elevation differences in maps of mountainous or hilly terrain.
A map made about thirty years later by the Bohemian botanist and collector Franz Sieber (1789–1844) and surveyed using compass and measuring line depicted the same cave, albeit in a completely different form (Figure 3B).Footnote 54 Sieber had visited the Labyrinth Cave on a collecting trip to Crete in 1817. Based on his assumption that the labyrinth was an ancient quarry, he sketched in large chambers and merged natural and artificial elements, with a preponderance of the latter. Since Sieber produced the map specifically for the purpose of publication in his two-volume travel account, he was aware of the publicity it would receive. He further reinforced his argument for the cave's primarily artificial origin by adding illustrations of labyrinth motifs found on Minoan coins; his map also contains more circuits than that of Dumas.
Curiosities found underground similarly challenged the previous empirical observations made by visitors. In particular, the existence of specimens that could, potentially, be classified in a number of ways made it necessary to interrogate the description and naming of objects, resulting in various attempts to reorganize knowledge about the organic and inorganic world. As ‘hybrid objects’, speleothems (e.g. stalactites, flowstones, moonmilk) undermined the nature–culture opposition by ‘combining art and nature in form and matter’.Footnote 55 They were collected not only by naturalists but also by locals; they were sold, placed in garden grottos, ground up and administered as medicine to pregnant women, sick people and cattle, and added to flour during food shortages. The attempts of scholars to distinguish and differentiate the sub-categories of speleothem reflect their varying uses across diverse contexts and communities. Nonetheless, speleothems were often thought to be fossils, and vice versa.Footnote 56 For example, the Swedish chemist and naturalist Johan Gottschalk Wallerius (1709–85) claims in his treatise Mineralogia that the basis for the formation of stalactites is a fossil substance that hardens under the influence of air like an icicle in winter.Footnote 57
Thus early cave maps prioritized the various types of minerals, fossils and artefacts encountered over geographical direction, distance and projection planes. Striking map symbols that mimicked the shape of natural specimens served to guide the reader through the labyrinths. As these were often arranged along preset underground pathways, the objects also structured the plan itself. The resulting combination of empiricism and imagination transformed these maps into wonder rooms or ‘curiosity cabinet[s] of natural science’.Footnote 58 The shape, order and cross-referenced meaning of the specimens depicted were key to building on the prior knowledge of potential users and signalling that the map was trustworthy. By rendering hybrid specimens into more approachable objects, such as religious figures or architectural features, mapmakers made these specimens visually descriptive and comprehensible.
I would like to illustrate this hypothesis using a sketch of Baumannshöhle (Figure 4), drawn by a certain ‘Studiosus von Alvensleben’, who visited the cave in 1656 as a companion of the Saxonian theologian Gottfried Olearius (1604–85). In this map, consisting of two sheets, the curiosities found in the cave are arranged along a winding path with obstacles, emphasizing the labyrinthine structure, while the galleries are only sketched in outline.Footnote 59 The draftsman uses features familiar to readers to represent his empirical observations in visual form. Narrow parts and climbable passages such as the ‘Roß’ (horse) are depicted as intestine-like tubes. Speleothem formations such as the ‘monk beside two other images’ and a ‘beautiful and miraculous wall of all kinds of figures’ are illustrated as anthropomorphic figures or as a cluster of very detailed objects. One eye-catching combination of stalactite and stalagmite is even depicted as a broken antique column, while other speleothems are visualized as pyramid-shaped aggregations of stones. Nevertheless, the mapmaker is well aware of possible sensory illusions and affirms the uncertainty of empirical perception underground, noting in the margin, ‘Here, [the speleothem] falsely appears to be a ghost.’

Figure 4. Ground plan of Baumannshöhle (Saxony-Anhalt), made by the Studiosus von Alvensleben in 1656 (Landeshauptarchiv Sachsen-Anhalt, Rep. H 66, Gutsarchiv Erxleben II, Nr. 952, p. 15). The figure shows the second page of the map with the heading ‘Die mittlere Bumanßhöhle’ (The middle Baumannshöhle cave). In the upper right corner, a narrow passage is depicted, from where a visitor lowers himself with a rope. Once there, three torch-bearing companions with headgear indicate the continuation of the tour. It leads past speleothems, a ‘Brunnen’ (well), another narrow passage and a stalactite formation called ‘monk’, to the upper left edge of the map, where another visitor is depicted with a torch.
Communicating trust: techniques of persuasion
If we imagine scholars of the early modern world dressed in their court garb, crawling on all fours or stuck in pits or being carried piggy-back by their guides through wet passages, we can understand the underground as a space in which hypotheses, methods and instruments faced challenges which they might fail. Draftsmen regularly went along on underground voyages, but in some cases they also produced maps based on reports or sketches supplied by their clients. Likewise, scholars and publishers hired local naturalists, especially if they were unable to visit the cave(s) themselves.Footnote 60 This meant that mapmakers were all the more concerned with conveying trustworthiness, even though the empirical data behind the maps were, most likely, not trustworthy at all. Since there were no standardized methods for the cartographic depiction of natural cavities, features such as map symbols performed a special role in ordering knowledge, while surveying practices and scale bars took on a legitimizing function. As this section argues, these were not just visual features, but powerful techniques of persuasion that communicated a sense of accuracy and enabled potential users to understand the complex topographies underground, and so supported and enhanced the use of maps in scientific reasoning.
Visual narratives and map symbols
Maps aim to create order and orient the viewer via the distribution of symbolic meaning. Accordingly, early cave maps depicted the dynamics and disruption within the Earth's crust as a systemic form of disorder. Based on his readings of Kenneth Burke, the philosopher Pierre Smolarski draws a connection between the ‘rhetoric of maps’ and their organizing function, pointing out that motifs represent ‘acronyms’ and ‘pathways to orientation’.Footnote 61 The ordering of figurative symbols along pathways in cave maps resembles the rhetorical practice of ‘memoria’: an ancient technique for learning a speech by heart by systematically associating its parts with figurative signs and places. Here, motifs are essential in helping the viewer to make sense of the map and shaping their understanding of it. By simplifying the knowledge represented, they offer a clearer and more convincing narrative than the written accounts of cave visits, which are often rather confusing. The rhetoric of maps and their potential to create order only become really evident when they break new ground in their design, or else fail. Otherwise, the order they depict appears natural and convincing.
Visual narratives use recognizable symbols to communicate (non-)knowledge and make it commonly understandable. As the prevailing visual narrative used in early modern cave maps, the labyrinth motif fulfilled a central epistemic function: specifically, identifying the unknown.Footnote 62 Referring to Richard Yeo,
when knowledge is ordered, subdivided, and controlled, we speak of … maps … metaphors suggesting definite structures and relationships. When knowledge is regarded as chaotic, overwhelming, undifferentiated, we speak of labyrinths, mazes … still perhaps implying that an order exists but acknowledging that it is not yet visible.Footnote 63
By attributing order and comprehensibility to that which is invisible to the eye, cave maps made it possible to evaluate, measure and ultimately control the unknown in nature. The labyrinth motif symbolized non-knowledge by visually contrasting centre and periphery, proximity and distance, order and mess. In this respect, the motif both marked the limits of perception and established trust. A good example of this is the depiction of the Labyrinth Cave by the Florentine humanist Cristoforo Buondelmonti (1386–c.1430), who visited the site in 1415. His manuscript ‘Descriptio insulae Cretae’, written two years later, contains the first map-like drawing of a cave incorporating orientation information.Footnote 64 Enriched by material from ancient Greek and Roman writers and from contemporary oral accounts, Buondelmonti's description links mythological narratives with detailed information about the length and direction of the cave. His map, in contrast, quotes the visual narrative of the labyrinth by depicting several interconnected corridors that extend beyond the edge of the map format. Buondelmonti's personal observations made on site, and his detailed report, indicate that his depiction of the cave as a labyrinth is not purely imaginative; the motif itself serves to indicate the limits of knowledge.
Towards the end of the eighteenth century, the use of uniform map symbols, rather than individual objects or visual narratives, arose from fundamental shifts both in epistemological interest and in the classification of natural specimens. In the new context, experience-based knowledge had to be ranked into a hierarchy and brought into relation. What was important had to be distinguished from what was unimportant. This development made it possible to compare different caves by reading their respective maps. The use of symbols also required a higher degree of abstraction and generalization of observed natural phenomena. Some maps even included formal legends, or entire paragraphs explaining the abbreviations and clarifying the relationship between a sign and what it signified: in other words, accessible sign systems intended for a wider audience.
The loss of perceived authenticity caused by this increase in abstraction required the invention of new means of conveying empirical evidence. Likewise, the interest of naturalists and mapmakers was no longer directed solely towards the individuality of a given object, but towards its comparability to other objects too. These developments, in turn, gave rise to changes in the hierarchies of representation. Significantly more attention was paid to the representation of topographical knowledge and the exact localization of mineralogical, palaeontological or archaeological findings. Topographical features such as gradient arrows, gradient lines, differences in elevation, heights of chambers and symbols representing drops, pits or domes were particularly effective in persuading the reader to trust the information presented in the map. These features allowed conclusions to be drawn about tectonics and speleogenesis (cave formation). At the same time, collecting this kind of detailed information required the surveyor's presence on site and the taking of measurements, especially with regard to vertical difference.
A sketch of Madison's Cave in Virginia demonstrates these shifts in the scholarly interest in caves and the rhetoric of maps. The first known survey of a US cave, it was drawn by the American statesman Thomas Jefferson (1743–1826), who visited with two travel companions in 1783.Footnote 65 After his time as governor of Virginia and following the death of his wife, Jefferson had retired from politics and devoted himself to the exploration of Virginia's natural history, even conducting systematic archaeological excavations. His lifelong interest in caves may have been driven by his convictions about the potential production of saltpetre from soils. Saltpetre was essential to the manufacture of gunpowder, so finding new methods of production was an important question of national defence.Footnote 66 Jefferson's sketch supports his hydrological hypotheses. Although he mentions the cave's ‘elegant drapery’, stalactites and massive columns in his description – later published, together with a generalized version of the map, in Notes on the State of Virginia – they do not appear on the map itself.Footnote 67 Rather, Jefferson's sketch indicates two water basins ‘of unknown extent’ at the rear of the cave as well as the difference in elevation of the galleries, marked using gradient arrows and numerical data in feet and degrees. Although Jefferson observed that the basins were at the same elevation as a nearby river, he concluded from the clarity of the water and the constant water table that they were ‘probably one of the many reservoirs with which the interior parts of the earth are supposed to abound and yield supplies to the fountains of water distinguished from others only by being accessible’.Footnote 68 Jefferson's map symbols, therefore, did not have a purely visual function. In fact, they were abstractions of topographic knowledge based on measurements and were embedded in the context of a specific scientific argument, even though the surveying techniques and tools employed often did not and could not provide accurate data.
Surveying and accuracy
Today's surveyors face the same problems they did three hundred years ago. They typically underestimate the size of large halls, while overestimating that of smaller chambers. Besides restricted visibility, vertical or narrow sections that are difficult or impossible to traverse can also cause significant errors of measurement. This becomes particularly obvious when a loop within a cave is surveyed, or when two traverse lines, drawn on the basis of a sequence of measurements along a cave passage, happen to cross. In addition, equipment such as measuring tools and instruments – which have to be dragged behind during the descent – are exposed to extreme conditions that affect their precision. Reliable observation depends on conditions that cannot be guaranteed in practice. In short, cave maps claim a degree of accuracy that is impossible to achieve.
A surviving ink-and-wash drawing from 1749 by the Italian engineer and painter Carlo Beduzzi (c.1710–c.1770), depicting the artist in the process of making a sketch of the Magdalena Cave in Slovenia for a factual report to the Vienna court (Figure 5), provides an insight into early modern surveying practices. Torchbearers are placed to illuminate an extensive hall within the cave. An assistant winds a tape on a reel, while the surveyor, dressed in a frock coat, knee breeches, tricorn hat and wig, sketches a draft on a large sheet: the back of another assistant serves as his drawing board. In narrow or steep cave sections, the surveying process was undoubtedly much less orderly and careful than Beduzzi's picture suggests.

Figure 5. Detail of an ink-and-wash drawing of Magdalena Cave (Slovenia) in Joseph Nagel, ‘Beschreibung deren auf allerhöchsten Befehl … untersuchten, in dem Herzogthume Crain befindlichen Seltenheiten der Natur’ (Austrian National Library, Ms. 7854, Tab. VII). Its painter, Carlo Beduzzi, an Italian engineer working in Vienna, accompanied the imperial mathematician Joseph Anton Nagel (1717–94) on a trip to Carniola. Nagel visited caves and other natural wonders in lower Austria, Styria, Carniola and Moravia in 1747 and 1748 on behalf of Emperor Franz Stephan (1708–65). Beduzzi made no less than four maps and nineteen drawings of caves for one of the two reports to the emperor, including this drawing showing the impressive stalactites of Magdalena Cave. Fitting for an official report to the court, the speleothems were depicted quite realistically. Note: see Johanna Schönburg-Hartenstein, Josef Anton Nagel: Ein Direktor des physikalischen Kabinettes, Vienna: Austrian Academy of Sciences, 1987; Trevor R. Shaw and Alenka Čuk, Slovene Caves and Karst Pictured 1545–1914, Ljubljana: Založba ZRC, 2012, p. 88.
Although surveying methods that enabled accurate scale mapping were developed, mainly in the seventeenth century, it is doubtful that these were applied in cave environments.Footnote 69 This is also true of well-established mine surveying techniques, which were only of limited use in natural cavities. In particular, surveying conditions in mine tunnels following the course of ore veins – which tended to be rather easier to access – were significantly different to the geographies of natural caves, which were winding and hard to traverse. There, the traditional method of triangulation was at a disadvantage compared to traverse surveying, even if we allow for a higher degree of inaccuracy. There is also little evidence of professional mine surveyors engaged in mapping before 1800. Although a number of tools and instruments used in early modern mine surveying – such as the measuring rod, miner's level, compass and plumb line – are mentioned in reports of early modern cave visits, it is uncertain to what extent these were actually used in practice.
The most common tool was certainly the measuring cord, supplemented as necessary with a hand-bearing magnetic compass, angle meter and plumb line. In many cases, just a cord and compass may have been used for taking measurements along more or less continuous traverse lines. Surveying steep sections was a tricky and unsafe task that could easily produce contradictory results. Determining the angle of inclination of these sections was particularly challenging. Since pits in caves are not always vertical, plumb lines were of limited use. Angle meters also had high error rates due to difficulties in targeting. As inaccuracies in measuring depth added up in the course of a traverse survey, vertical data in cave surveys were marked by a high margin of error and uncertainty.
The challenge of translating the empirical data obtained by surveyors into cartographic codes was not only a practical one, but also epistemological. Mapmakers in the early modern period had to use specific strategies to deal with questions of accuracy and to communicate trustworthiness to potential users. While some mapmakers openly admitted the uncertainty of their maps by giving them titles such as ‘eye-draught’, others asserted their credibility by including depictions of measuring tools. Before the appearance of scale bars, human figures were depicted as a comparative sizing method. The inclusion of these figures, shown holding lights in the cave's corridors – they sometimes included the mapmaker himself – conveyed a sense of authenticity. During the eighteenth century, mapmakers tried to enforce their claims to accuracy by illustrating epicartographic elements as scale bars and by referring in various ways to surveying practices.Footnote 70 Within a given map, the scale of the objects depicted also varied in accordance with the mapmaker's sense of the user's expectations. Areas of particular significance to clients might be drawn on a larger scale, while other, less interesting, galleries might be left out altogether. Other convincing epicartographic elements such as north arrows or compass roses would be depicted on the map even if measuring tools were obviously not used when exploring the cave.
Projection planes and verticality
The complex three-dimensional topography of cave systems presented early modern mapmakers with a considerable challenge. In particular, multiple over- and underlays of corridors were difficult to depict in a two-dimensional drawing. The need to present whole cave systems and natural specimens in a traceable and comprehensible manner gave rise to the development of consistent projection planes in cave surveying, such as ground plans, longitudinal sections and cross-sections.
Originating as drawings incorporating orientation information, the basis of cave maps gradually shifted from the subjective perspective chosen by a given observer to the kind of abstract projection plane already used in the topographical maps of the period. Perspective map projections functioned as an intermediate stage between the two, providing a three-dimensional overview while still enabling the reader to inhabit the mapmaker's chosen viewpoint.Footnote 71 This change in the use of projection planes also threw up a number of hybrid forms.Footnote 72 In order to give an overview of phenomena that could not be represented solely by a ground plan or sections, the draftsmen combined different projection planes within a single map and illustrated the galleries’ outlines multidimensionally. This was intended to reinforce the credibility of the sketch.
The interpenetrating power of maps and their ability to render a mountain transparent were key to persuading the reader to trust the information presented in them. In particular, the switch from horizontal to vertical projection planes exposed areas of the Earth's subsurface that were previously inaccessible to human perception and aroused interest in their examination. As naturalists gradually came to understand the underground in terms of the Earth's development over time, they experienced, in the words of the German naturalist Georg Christoph Lichtenberg (1742–99), ‘phenomena that raise questions such as How? Why? and Whence?’Footnote 73 Growing interest in geological and archaeological phenomena made verticality an increasingly important dimension of knowledge acquisition, although the measurement of vertical dimensions remained strikingly unreliable and produced wildly varying results. While early cave maps were mostly ground plans and did not show vertical differences, such as pits, steps and chimneys, longitudinal sections of caves soon became common map projection planes.
Longitudinal sections were especially important: they opened up new opportunities for viewing phenomena in comparison and bringing them into the context of a given scientific argument. Drawing a longitudinal section, early mapmakers were embarrassed by so much blank space between the surface of the Earth and the roof of the cave, and they started to use this previously neglected area to enhance the map's scientific value. This allowed them to make an explicit connection between the topography of the cave, the findings made there and the conditions on the Earth's surface: for example, drawing in fissures in order to attribute the occurrence of stalactites to the intrusion of vadose water from subsurface soils.Footnote 74 As I will discuss in more detail in the following section, cross-sections of cave passages, which were sometimes made in supplement to ground plans and longitudinal sections, allowed the mapmaker to draw connections between the location, type and frequency of findings and the process by which the cave is thought to have formed.
A fascinating example of an early longitudinal section and its techniques of persuasion is a 1719 survey of Demänovská Ice Cave in Slovakia, where ice was routinely cut for the Vienna court. A detail of the map is provided in Figure 6. It was made in 1719 by the naturalist Georg Buchholtz (1688–1737), rector of the Protestant lyceum in Kežmarok, and possibly commissioned by the Hungarian polymath Mátyás Bél (1684–1749). Buchholtz also printed the sketch in the style of a formal, scholarly map in his 1723 country description Hungariae antiquae et novae prodromus.Footnote 75 Since this map is the only cartographical representation included in the treatise apart from a single topographical map, it was clearly intended to make an impression on the reader. Although it is questionable whether Buchholtz actually used surveying tools, these are depicted together with a scale bar below the title cartouche. Two scale figures with torches shown standing inside the cave, and the figures of two scholars approaching its entrance, accompanied by a porter, underpin the authenticity of the depiction. Ice figures, speleothems and fossils encountered underground are sometimes illustrated in anthropomorphic form, and about fifty abbreviations, explained at the edge of the map, offer detailed information on the occurrence and origin of the curiosities. Buchholtz also uses the map to furnish evidence of the location where he had found some supposed ‘dragon bones’ (mammoth fossils), which he sent as a gift to the art and natural cabinet in Dresden.Footnote 76 His choice of a vertical projection plane certainly makes the course of the cave appear longer, easier to grasp and therefore more impressive than it would appear on a ground plan due to its labyrinthine topography. However, this choice meant that the map was far from suitable for helping other visitors find their way inside the cave. Probably unsure how to fill the white space between the surface of the Earth and the roof of the cave, Buchholtz depicts the stratification of the Earth using a rockface pattern inhabited by single, anthropomorphic faces. In contrast to later mapmakers, however, he does not sketch in a hypothetical geological relationship between the course of the cave and the surface of the Earth.

Figure 6. Detail of the longitudinal section of Demänovská Ice Cave (Slovakia), surveyed by Georg Buchholtz in 1723, engraved by Sámuel Mikoviny and published by Mátyás Bél (ed.), Hungariae antiquae et novae prodromus, Nuremberg: Monath, 1723, p. 141 (Sammlung Woldan, Austrian Academy of Sciences). The two wind roses indicate the direction of expansion of the upper and lower cave entrances.
The use of abstract projection planes certainly made maps less accessible to inexperienced readers. However, the consistency of projection planes and the possibility of comparing different sketches were key to establishing credibility, and met the growing need to examine different natural phenomena in a comparative way. Due to the complex three-dimensional structure of caves, ground plans were extremely limited in their ability to render vertical differences such as pits, or how far one gallery lies above another. In contrast, longitudinal sections were unsuitable for depicting labyrinth cave systems, and broadly useless in pathfinding due to the lack of directional information. Therefore mapmakers came to adopt a technique already used in architectural drawings, in which ground plan, vertical section and profile view were all created in the same process.Footnote 77
Cave maps as devices in scientific reasoning
As the Saxonian mining engineer Friedrich von Trebra (1740–1819) argues in his geological–mineralogical description of the Harz mountains titled Erfahrungen vom Innern der Gebirge (Experiences from Inside the Mountains) (1785), visualizations of subterranean spaces stimulated efforts in stratigraphic mapping, paving the way from descriptive–local observations to causal–general exploratory models:
Were it possible to remove all the tops from the mountains and so place them before you as bare rock, or even to take them apart right down to their deepest points, then we would have opportunity enough to educate ourselves fully about their interior structure. And if we could even depict the mountains as one skeletonizes sheets of paper, then, O! it would doubtless be very easy to establish a theory of the fabric of the galleries, to seek their origin in the transverse rock, to research their development to the very last detail.Footnote 78
As the following section argues, cave maps began simply as a way to ascribe a specific location to natural curiosities. Over time, however, they came to be seen as reliable natural-historical evidence in their own right. At the turn of the nineteenth century, these maps – although still reliant on dubious data – came to play an active role in scholarly argumentation and emerged as powerful tools in scientific reasoning.
Localizing findings of natural-historical significance
According to Nicolaas Rupke, caves ‘were believed to be pervasive and primordial features, present since the birth of the earth as a planet, providing essential information as to the manner of its origin’.Footnote 79 At the subterranean level, the beginnings of the Earth's chronology became visible in fossil deposits, speleothems and different layers of rock or soil. The human lack of awareness of immeasurable periods of the Earth's history and the growing realization of ‘geological deep time’ transformed caves into enlightening and challenging sites of natural history.Footnote 80 Martin Rudwick's interpretation of the well-known caricature The Hyaena's Den at Kirkdale, which depicts the renowned English geologist and palaeontologist William Buckland (1786–1856) crawling into a cave and encountering living hyenas from the prediluvial period, illustrates how naturalists broke the ‘epistemic barrier that separated the observable present from the prehuman past’.Footnote 81 Formerly inaccessible periods materialized under the scholars’ feet, were made transparent by vertical sections, and thus became a topic for scientific reasoning.
Cave maps did not only provide insights into the places where the discoveries were made. Increasingly, they also functioned as veritable archives of natural history, where the deposition of fossils or mineral formations could be seen on display. The aforementioned map of Baumannshöhle, included in Leibniz's posthumously printed Protogaea, sheds light on the fundamental nature of evidence building in drawing conclusions about the history of the Earth. Unlike the original map by Hermann von der Hardt, Leibniz's revised and supplemented version was not a tool for other visitors, indicating the underground curiosities most worth seeing. Illustrating the shift in function from merely locating specimens to placing them in a causal relationship with natural history, the map was intended to designate the sites of specimen discovery and to differentiate and highlight the findings through detailed, naturalistic representations.Footnote 82
During his visit to the cave, Leibniz collected fossils and speleothems. His descriptions of these findings identify similarities with the bones of animals or the minerals found in mines. Likewise, he saw in the structure and stratification of speleothems ‘something like the rings that designate years in trees … since nature rested intermittently and then resumed her work again with a new inundation’.Footnote 83 In Leibniz's map, the image of one distinctive fossil specimen, enlarged and placed at the centre, alludes to his hypothesis mentioned in Protogaea that specimens ‘did not arise in those places but came from the ocean, carried there by the violence of the waters’.Footnote 84 Remains of ‘sea monsters and of other animals’,Footnote 85 they were swept, together with those of terrestrial animals, into caves by a great flood as its waves retreated into the Earth's interior. According to the valuable work of Claudine Cohen and Andre Wakefield, Leibniz's ideas about the origins of fossils changed considerably during his lifetime; however, caves as sites of discovery remained crucial to his thought.Footnote 86 Although the Baumannshöhle map was not in itself intended to support a particular hypothesis, his detailed comparison of various specimens and his specific identification of fossils enabled a better understanding of universal principles, contributing to the generalization of local knowledge.
As well as cartographic features and the depiction of surveying practice, who made a given map and where it was published were crucial factors in establishing its credibility. Maps often furnished evidence for the hypotheses of their authors, and as such were closely tied to the argumentative context of their publication. Only rarely did naturalists refer in their hypotheses to maps made by or for others. The reputation of the editor and the scientific recognition of the publication medium contributed to the perceived trustworthiness of the depiction. This explains why maps that were not printed in scientifically accredited treatises, country descriptions or journals were only afforded limited consideration in the scientific debate. In individual cases, a scholar's credibility and authority might even allow him to present his hypothetical map as concrete evidence for his argument, without actually carrying out any fieldwork.
But implicit acceptance was far from guaranteed. Serving as a key foundation for his hypothesis about the origin of fossils, the cave maps printed by William Buckland in his Reliquiae Diluvianae were openly criticized for being a ‘hypothetical presentation’ rather than the ‘result of an investigation’.Footnote 87 Buckland's sketches, mapped by the geologist Thomas Webster (1773–1844) using a vertical projection plane, stimulated lively scholarly debate.Footnote 88 Evidence found in caves had drawn considerably more attention from naturalists after Johann F. Esper's (1732–81) groundbreaking identification of rich fossil deposits in Gailenreutherhöhle (Franconia) as the remains of extinct animals such as cave bears.Footnote 89 One such naturalist was the anatomist John Hunter (1728–93), who argued in his paper presented to the London Royal Society that the ‘vast accumulation’ of fossils in Gailenreutherhöhle required the presence of living animals in the cave for
many thousand years … these caves have their bottoms covered with animal earth, for some feet in depth, in all degrees of decomposition, the lowermost the most pure, and the uppermost but little changed, with all the intermediate degrees; in which caves are formed a vast number of stalactites, which might incrust the bones of those that die there.Footnote 90
Building on Hunter's hypothesis that fossil findings in caves were the remains of animals that had once lived there, Buckland attributed a larger role to a prehistoric flood. Although he argued that, in most cases, the waters did not wash the bones into the cave, he specified that they were responsible for covering the fossils with mud.Footnote 91 To reinforce this statement, Buckland's maps, such as the longitudinal section of Gailenreutherhöhle, do not depict successive layers of cave deposits but show the specimens as being of similar age.Footnote 92 The Gailenreutherhöhle map clearly distinguishes between fossiliferous strata and the speleothems that formed above them, indicating that the latter came after the deluge. Although he himself had visited Gailenreutherhöhle, Buckland also depicts layered deposits and stratifications of findings that had not, in fact, been verified in situ. Combining a vivid sense of the fascination of the underground with the depiction of caves as palaeontological sites, Buckland's maps became powerful epistemic tools capable of advancing a hypothesis and apparently confirming it at the same time.
Reasoning about speleogenesis
The variety of early modern concepts about speleogenesis cannot be understood in isolation from scientific ideas about fossil and speleothem formation and how these specimens came to be found in the earth. Some of these hypotheses were tied to universal exploratory models of the Earth's formation; others were made in the course of personal observations on site, but did not claim universal validity. Alongside a gradual shift from catastrophic to actualistic viewpoints, greater significance was accorded to the development of universally valid models of speleogenesis, which combined different factors such as corrosion, erosion, volcanism, gases and tectonic causes. Trevor Shaw, who has carefully collected and categorized the various historical theories about cave formation, classifies them according to the following factors: tectonic origins (uplift, collapse, underground expansion); drains for the deluge; gas bubbles in limestone; erosion of soft material or limestone; solution by thermal, vadose or phreatic waters; volcanism; and atmospheric corrosion.Footnote 93
Arising as they did from a general interest in natural-history specimens, it was relatively late before cave maps were employed in causal reasoning about speleogenesis. The reason for this was that longitudinal sections tended to focus on depicting cave deposits, whereas ground plans were more suitable for pathfinding. Cross-sections of galleries, which were important for attempts to reconstruct the process of speleogenesis, did not become a common feature of cave maps until the nineteenth century. Often, naturalists used artistic drawings instead of maps to explain the formation of a given cave.Footnote 94 Others employed diagram-like maps showing supposed subterranean water reservoirs and channels to explain the fluctuating level of intermittent lakes and springs.Footnote 95
For many mapmakers in this period, it was more important to give a visual representation of a particular scientific argument than it was to make a claim to accuracy. In particular, the shape of the galleries’ outlines and the way in which they were visualized on a given map underpinned the author's own hypothesis about how the cave was formed.Footnote 96 One of the few pre-1800 ground plans to serve as an argument about speleogenesis is a 1753 map of the lava tube cave Surtshellir in Iceland. Based on a survey by the Icelandic naturalist Eggert Ólafsson (1726–68) and the physician Bjarni Pálsson (1719–79), the map was not printed until 1772 in Ólafsson's posthumously published and widely translated account Reise igiennem Island.Footnote 97 Entrusted by the Royal Danish Academy of Sciences with the task of studying the island's topography and mineral deposits, the two naturalists travelled their homeland for several years. In the course of their research, they also surveyed Surtshellir, a cave that was of particular interest to scholars at the time. Stalactites collected there had been circulating among scientists since the seventeenth century, stimulating the development of widely differing hypotheses about the nature of their origins. In his description, Ólafsson pays specific attention to the cave's structure, such as walls, shelves, horizontal benches, speleothems and the glazed ceramic appearance of the walls. He attributes these features to the effect of lava flowing through the cave. In order to support this hypothesis about the cave's volcanic origin, the map shows an exaggeratedly worn and smoothed texture in the outline of the galleries, as if shaped by a river. This resulted in
a clear testimony to the paths of the underground fire and its effects, in particular the passages and rivers it melted out beneath the earth's crust; it also shows, if only on a small scale, how easily this fire can bring soil and stone types to the point of flowing, and carry them away with the molten material as it flows past.Footnote 98
While surveys like those of Surtshellir served as evidence both for the detailed observations made by the draftsmen on site and for the credibility of the arguments on which they were based, other maps themselves stimulated the development of new hypotheses. This is especially true for cross-sections of cave passages. Providing evidence of mechanical erosion, dissolution and tectonic processes, these maps inspired scholars to consider a combination of different factors in cave formation. This insight became clear to the French engineer and mathematician Nicolas Brémontier (1738–1809), in later years inspector general of bridges and roads, when he surveyed Rouffignac Cave in Dordogne, now famous for its prehistoric paintings.Footnote 99 Most likely made in 1765, the map comprises a surprisingly accurate ground plan and no less than twenty-seven cross-sections of passages. The highly irregular shape of the cross-sections, depicted side by side and aligned along a common datum line, led Brémontier to hypothesize about speleogenesis in his later report to the Academy of Caen. According to him, some parts of the cave were primarily formed by stream erosion, after an earthquake caused fissures in the rock and allowed the water to infiltrate; other parts developed through rock corrosion caused by air: ‘The walls and roof provide a tangible proof of this … This difference in hardness has resulted in pendants, domes, partitions … hollows and projections.’Footnote 100 By understanding speleogenesis as a complex interaction of different geological forces, such as mechanical erosion, and tectonic and corrosive action, scholars and their cave maps were able to cast doubt on previously accepted universal models of the Earth's history, despite the uncertainty of the evidence from which they worked.
Conclusion
This essay has shed light on natural cavities as both stimulating and challenging sites of knowledge production. Thus far, they have not been given appropriate consideration by history-of-science scholarship, particularly in the case of early modern natural history. Caves, like other subterranean and vertical sites of scientific inquiry (mines, mountains), were the focus of a wide range of scholarly approaches in this period. Practitioners from different areas brought a great diversity of methodologies and means of translation to their work in the emerging field of cave studies. Striking observational results, untrustworthy visitor reports, and findings that furnished evidence of geological or ‘deep-time’ processes all intensified this scientific interest. However, demanding conditions underground – such as remoteness, limited vision and topography that was difficult to navigate – posed a considerable challenge for early modern experience-based knowledge acquisition, casting empirical methods of observing, measuring and recording into doubt. In this sense, my paper has argued that natural cavities are unique knowledge spaces which, in this period, required specific strategies for dealing with ambiguity at various levels of scientific practice. Maps, and the use of surveyors, instruments and techniques in their creation, were key to communicating authenticity and credibility, although the data behind them were at times erroneous and prone to epistemic uncertainty.
An analysis of the processes by which cave maps, even before standardization, provided support for causal thinking about the history of the Earth reveals that these largely neglected sources were more important to naturalists than was previously believed. In the early modern world, where understanding was structured through analogies, maps represented a meta-level of abstract reasoning, combining the scaled-down rendering of distant, out-of-sight geographies with the construction of an analogical space on two-dimensional materials. Struggling as they did with the imprecision of perception, draftsmen combined experience and inspiration to legitimize the process of attributing meaning to previously undefined areas. While early maps had a strong narrative component that structured the underground topography around striking naturalistic symbols, the practice of surveying dissolved this spatial order and concealed the inaccuracy of the drawings behind a clear, comprehensive (and therefore convincing) representation. Ever more frequently invoked in support of arguments that aimed to reveal and elucidate processes at work in natural history, maps were increasingly required to meet a certain standard of comparability. As this paper has shown, longitudinal sections and cross-sections used as projection planes not only became powerful tools that could render the Earth's subsurface transparent, but also contributed to establishing verticality as an important dimension of knowledge, bringing previously invisible periods of natural history into the light.
Taking these considerations into account, this paper has addressed topical issues of academic debate around the role of evidence, witnessing and trust in pre-1800 scholarship and cartography. A critical study of cave maps suggests that more attention should be paid to the nature and epistemic difficulties of empirical knowledge production and their impact on early modern credibility building. In this regard, surveying techniques were not the basis for the faithful mapping of a given site, but functioned as tools of persuasion, conveying an accuracy that was impossible to achieve in practice. In closing, let us return to Steno's celebrated visit to Moncodeno Ice Cave. As he notes in his report to the grand duke, Steno was well aware of the practical obstacles he faced in drawing up his sketches in the freezing cold and by candlelight. Exhausted by the ‘terrifying steep drops above and below the cave, as well as by the strenuous climb, and overwhelmed by all the new impressions’, his initial enthusiasm for conducting extensive measurements had abruptly died down.Footnote 101 Obviously worried about the dangers of the cave and its remoteness from the nearest settlement, he sketched his sections swiftly and ‘not with the accuracy of a proper measure’.Footnote 102 Like the maps of other scholars, Steno's sketches were concise representations of his scientific claims rather than detailed depictions of the cave itself. In short, maps made darkness visible, but only to an extent. The uncertain could still stimulate both reasoning and imagination.
Acknowledgements
I would like to thank Ernst Hamm (York University, Toronto), Norman Henniges (Berlin), Sandra Klos (Austrian Academy of Sciences), Simone Sambento (University of Edinburgh), Elena Trofimova (Russian Academy of Sciences) and Steffen Zierholz (University of Bern), who read and commented on this essay and/or provided sources. Thanks are owed to the Archives départementales de la Dordogne, the Archives départementales des Yvelines (both France), the Austrian National Library, the Austrian Academy of Sciences, the Landeshauptarchiv Sachsen-Anhalt (Germany), the Moravian Library (Czech Republic), the Massachusetts Historical Society (United States), the National Central Library of Florence (Italy), and the Russian State Archive of Ancient Acts for access to their collections. I am also grateful for the constructive and enriching suggestions of the two anonymous reviewers, who helped me to improve the content of the manuscript. Last but not least, I especially thank Kirsty Jane Falconer (Ferrara) for her language editing of this paper.


