Introduction
Tandem repeats are a source of genetic variation for evolutionary adaptation. In humans, single-amino-acid repeats (SAARs) are of particular interest due to the observation that repeats expansions are associated with a growing list of genetic diseases (Karlin et al. Reference Karlin, Brocchieri, Bergman, Mrazek and Gentles2002; van Eyk et al. Reference van Eyk, McLeod, O'Keefe and Richards2012), mostly neurodegenerative conditions (Paulson, Reference Paulson2000). Strand slippage during DNA replication may cause repetitive sequences to expand or contract at a faster rate than single nucleotide polymorphisms and other indels accumulate in the genome. Evidence for repeat length evolving in response to selective pressure has been observed. One of the argument in support of this view is the differential evolution of human short tandem repeats (syn. microsatellites) located in genes and in intergenic regions (Shimada et al. Reference Shimada, Sanbonmatsu, Yamaguchi-Kabata, Yamasaki, Suzuki, Chakraborty, Gojobori and Imanishi2016).
The phylum Apicomplexa includes several species of human and animal pathogens, including the agents of malaria, toxoplasmosis, coccidiosis and cryptosporidiosis. SAARs in the genome of the malaria parasite Plasmodium falciparum have been extensively researched. The abundance of asparagine (N) SAARs in P. falciparum has been linked to the AT-richness of the genome (Zilversmit et al. Reference Zilversmit, Volkman, DePristo, Wirth, Awadalla and Hartl2010). Compared with homologous proteins in other eukaryotes, P. falciparum proteins are enriched in low-complexity amino acid regions (Aravind et al. Reference Aravind, Iyer, Wellems and Miller2003) that are predicted to have no secondary structure (Wootton, Reference Wootton1994). Almost one-quarter of P. falciparum proteins contain N- and Q-rich protein domains potentially capable of forming self-propagating amyloid fibres (Singh et al. Reference Singh, Chandra, Bhattacharya, Akhouri, Singh and Sharma2004). To put this number in context, the proportion of such proteins in the human proteome is only 0.3%. Several mechanisms favouring high abundance of N repeats have been proposed, including modulation of mRNA stability and rate of translation (Frugier et al. Reference Frugier, Bour, Ayach, Santos, Rudinger-Thirion, Theobald-Dietrich and Pizzi2010), protein–protein interaction and, in P. falciparum, antigen diversification (Ferreira et al. Reference Ferreira, Ribeiro, Tonon, Kawamoto and Rich2003).
Due to extensive length polymorphism, many repetitive DNA sequences in the genome of Cryptosporidium parasites have been used as genetic markers (Tanriverdi et al. Reference Tanriverdi, Grinberg, Chalmers, Hunter, Petrovic, Akiyoshi, London, Zhang, Tzipori, Tumwine and Widmer2008; Feng et al. Reference Feng, Tiao, Li, Hlavsa and Xiao2014). In the absence of morphological traits to differentiate Cryptosporidium species and genotypes, length polymorphisms have played an important role in elucidating the epidemiology of human and animal cryptosporidiosis. Although less attention has focused on SAARs, two genes possessing such repeats, gp900 and gp60 (Barnes et al. Reference Barnes, Bonnin, Huang, Gousset, Wu, Gut, Doyle, Dubremetz, Ward and Petersen1998; Strong et al. Reference Strong, Gut and Nelson2000), have been extensively studied. Gp60 in particular, has found wide application as a genetic marker. The proteins encoded by these two genes have been shown to be extensively O-glycosylated and to have mucin-like properties. As with P. falciparum SAARs, no evidence for an association between SAAR profile and phenotype has been reported.
The evolutionary process which leads to speciation in the genus Cryptosporidium is unknown. The parasitic life style of these species and the observation that certain Cryptosporidium species or genotypes appear to have a narrow host range, has led to the assumption that parasite populations infecting different host species have evolved separately and differentiated into genetically distinct populations and/or have co-evolved with the host (Garcia and Hayman, Reference Garcia and Hayman2016). The existence of Cryptosporidium species with distinct organ tropism, together with the recent expansion of good quality Cryptosporidium genome sequences, provides new opportunities to query genomes for polymorphisms which may reflect adaptation. Because of the evolutionary plasticity of SAARs and other types of repeats, as well as the extracellular location of glycosylated proteins, such as mucins, the comparative analysis of SAARs may shed light on Cryptosporidium speciation and on the emergence of the human pathogen Cryptosporidium hominis and of Cryptosporidium parvum genotypes which are thought to be transmitted predominantly among humans (Mallon et al. Reference Mallon, MacLeod, Wastling, Smith and Tait2003).
This study was initially motivated by the observation that S and T SAARs were much rarer and shorter in the newly sequenced genome of Cryptosporidium muris as compared with C. parvum and C. hominis. S and T-rich proteins may be extensively glycosylated and form mucins (Johansson et al. Reference Johansson, Sjovall and Hansson2013). The low abundance of C. muris mucins inferred from the initial analysis led to the hypothesis that the interaction of Cryptosporidium parasites with the host is mediated by different surface proteins, depending on the organ infected (stomach or small/large intestine) and that SAAR abundance and length in different Cryptosporidium species reflects adaptation to a different host environment. The analysis of SAARs in the genome of eight Cryptosporidium species presented here reveals a distinct SAAR profile in the avian parasite Cryptosporidium baileyi and a large difference in SAAR abundance between gastric and intestinal Cryptosporidium species.
Material and methods
Genomes and annotation
Annotated protein sequences from the following isolates were downloaded from CryptoDB.org (Heiges et al. Reference Heiges, Wang, Robinson, Aurrecoechea, Gao, Kaluskar, Rhodes, Wang, He, Su, Miller, Kraemer and Kissinger2006): C. parvum IOWA (Abrahamsen et al. Reference Abrahamsen, Templeton, Enomoto, Abrahante, Zhu, Lancto, Deng, Liu, Widmer, Tzipori, Buck, Xu, Bankier, Dear, Konfortov, Spriggs, Iyer, Anantharaman, Aravind and Kapur2004), C. hominis UdeaA01 (Isaza et al. Reference Isaza, Galvan, Polanco, Huang, Matveyev, Serrano, Manque, Buck and Alzate2015), C. muris RN66. Eimeria sequences were obtained from ToxoDB.org (Gajria et al. Reference Gajria, Bahl, Brestelli, Dommer, Fischer, Gao, Heiges, Iodice, Kissinger, Mackey, Pinney, Roos, Stoeckert, Wang and Brunk2008). Genomes for which the annotation was not available were annotated using Companion (Steinbiss et al. Reference Steinbiss, Silva-Franco, Brunk, Foth, Hertz-Fowler, Berriman and Otto2016). The C. muris RN66 genome was used as reference to annotate Cryptosporidium andersoni 30847. The C. parvum IOWA genome was used as reference to annotate C. hominis TU502_new, C. baileyi TAMU-09Q1, Cryptosporidium meleagridis UKMEL1 (Ifeonu et al. Reference Ifeonu, Chibucos, Orvis, Su, Elwin, Guo, Zhang, Xiao, Sun, Chalmers, Fraser, Zhu, Kissinger, Widmer and Silva2016) and Cryptosporidium ubiquitum 39726. Information on the Cryptosporidium genome projects is summarized in Supplementary Table S1.
Repeat analyses
Two methods were used to identify single-amino acid repeats. In the first methods Microsoft Excel was used to identify uninterrupted repeats ⩾5 amino acid residues in length. Line breaks were first removed from the annotated protein FASTA files using Fasta Width (FASTX toolkit; http://hannonlab.cshl.edu/fastx_toolkit/) in galaxy (Afgan et al. Reference Afgan, Baker, van den Beek, Blankenberg, Bouvier, Cech, Chilton, Clements, Coraor, Eberhard, Gruning, Guerler, Hillman-Jackson, Von Kuster, Rasche, Soranzo, Turaga, Taylor, Nekrutenko and Goecks2016). The sequences and corresponding gene IDs were imported into Excel one gene per row. Genes containing perfect repeats of ⩾5 residues were then identified using excel functions countif or search.
In the second method, perfect and imperfect SAARs were identified using the web interface of XSTREAM (Newman and Cooper, Reference Newman and Cooper2007). Except for Min Period = 1, Max Period = 1, Min Copy No. = 20 and Min Domain Length = 20 default values were used. With these settings, the program returned SAARs of a minimum length of 20 residues including imperfect repeats interrupted by insertions of one different amino acid. The same settings were used for all species. Except for the data presented in Fig. 2 below, the analyses are based on SAARs with a minimum length of 20 amino acids.
The cumulative repeat length was extracted from the XSTREAM output for each species and each SAAR type, i.e. repeats of S, repeats of T, etc.. Based on these data, the distance between pairs of species was calculated in GenAlEx (Peakall and Smouse, Reference Peakall and Smouse2012) using the SSR distance metric. The SSR distance is the sum of the squared difference in repeat length, summed over all the repeat types. For example, XSTREAM detected a total of 1128 T residues in SAARs ⩾20 amino acids long in the genome of C. baileyi, and 793 T residues is SAAR in C. meleagridis. The contribution of T repeats to the total SSR distance between these two species is, therefore (1128-793)2. The analogous calculations were performed to obtain SSR distances based on each repeat type. The distance between SAAR profiles is thus not based on a comparison of SAARs in orthologous genes.
The genetic distance between species was calculated from aligned 18S rRNA gene sequences approximately 1725 nucleotides (nt) in length. The following sequences, identified here using the NCBI accession number or CryptoDB gene ID, were included: C. muris, AF093497; C. parvum, AF093493; C. meleagridis, AF112574; C. ubiquitum, LRBP01000038; C. baileyi, AF093495; C. hominis, rrn016 and rrn022 (gene IDs from CryptoDB.org); C. andersoni AY954885 and AB089285. The distance value represents the proportion of divergent nucleotide positions.
The correlation between the abundance of each SAAR type across the eight Cryptosporidium genomes was visualized by principal components analysis (PCA). The analysis was run in CANOCO (Braak & Šmilauer, Reference Braak and Šmilauer2002) and plotted with the same program. For this analysis, SAAR data were centered and standardized across species, i.e. expressed in units of standard deviation. Principal coordinates analysis (PCoA) was used to visualize genetic distances or SAAR distances between pairs of species calculated as described in the section ‘Repeat analyses’ above.
Polymerase chain reaction (PCR) confirmation of C. parvum repeats
Because repetitive sequences increase the probability of genome miss-assembly, we PCR amplified two SAARs to test the accuracy of the genome sequence. We picked two genes, designated cgd5_450 and cgd8_1160 in the C. parvum IOWA genome, to verify the accuracy of the C. parvum IOWA and C. hominis TU502 genome sequence at these two repetitive loci. A portion of gene comprising the SAAR of interest was amplified on an MJ Research PTC-100 thermal cycler from DNA extracted from oocysts of C. parvum isolate MD (Okhuysen et al. Reference Okhuysen, Rich, Chappell, Grimes, Widmer, Feng and Tzipori2002) using Red Taq Mastermix (Sigma). The following primers were used: cgd5_450 primers 3F and 3R (GAAGGTCACACAGAAAATGGTG and GTGATGCCCACAACGTGTAA); cgd8_1160 primer 2F and 2R (AAGGACTCTAATGCCACCAC and TACTTGCTTCTTCCTGGGGAT). Amplicons were Sanger-sequenced in both directions. cgd8_1160 amplicons were cloned in a pCR2.1-TOPO plasmid using procedures recommended by Life Technologies for the TOPO TA Cloning kit.
Analysis of gene function
Cryptosporidium parvum orthologs of 61 C. baileyi genes with N SAARs ⩾20 were identified using companion (Steinbiss et al. Reference Steinbiss, Silva-Franco, Brunk, Foth, Hertz-Fowler, Berriman and Otto2016). Enriched cellular and molecular functions in 43 C. parvum orthologs were identified using the Gene Ontology Enrichment tool in CryptoDB.org. The Bonferroni and Benjamini-corrected significance threshold was set at 0.05. A similar analysis was performed with C. parvum genes containing uninterrupted T SAARs ⩾20 residues and S SAARs of the same length.
O-glycosylation prediction
Out of the 40 C. parvum genes with the longest uninterrupted T repeats, 17 had C. muris orthologs in OrthoMCL (Li et al. Reference Li, Stoeckert and Roos2003). The glycosylation prediction software NetOGlyc (Steentoft et al. Reference Steentoft, Vakhrushev, Joshi, Kong, Vester-Christensen, Schjoldager, Lavrsen, Dabelsteen, Pedersen, Marcos-Silva, Gupta, Bennett, Mandel, Brunak, Wandall, Levery and Clausen2013) was used to predict O-glycosylation sites on these 17 C. parvum – C. muris orthologous pairs. The program returns a glycosylation score ranging from 0 to 1 for each amino acid position. To avoid ascertainment bias, that could arise from the fact that C. muris genes were included in the analysis based on orthology to C. parvum genes with the longest T repeats, C. muris genes with the longest T repeats (⩾10 residues) were selected to run the analogous O glycosylation prediction analysis. The C. parvum and C. muris amino acid sequences were concatenated in the same order. Dot plots were created for these concatenated sequences using Gepard (Krumsiek et al. Reference Krumsiek, Arnold and Rattei2007). A 4-residue sliding window was used to visualize conservation of sequence motifs.
Results
Global analyses
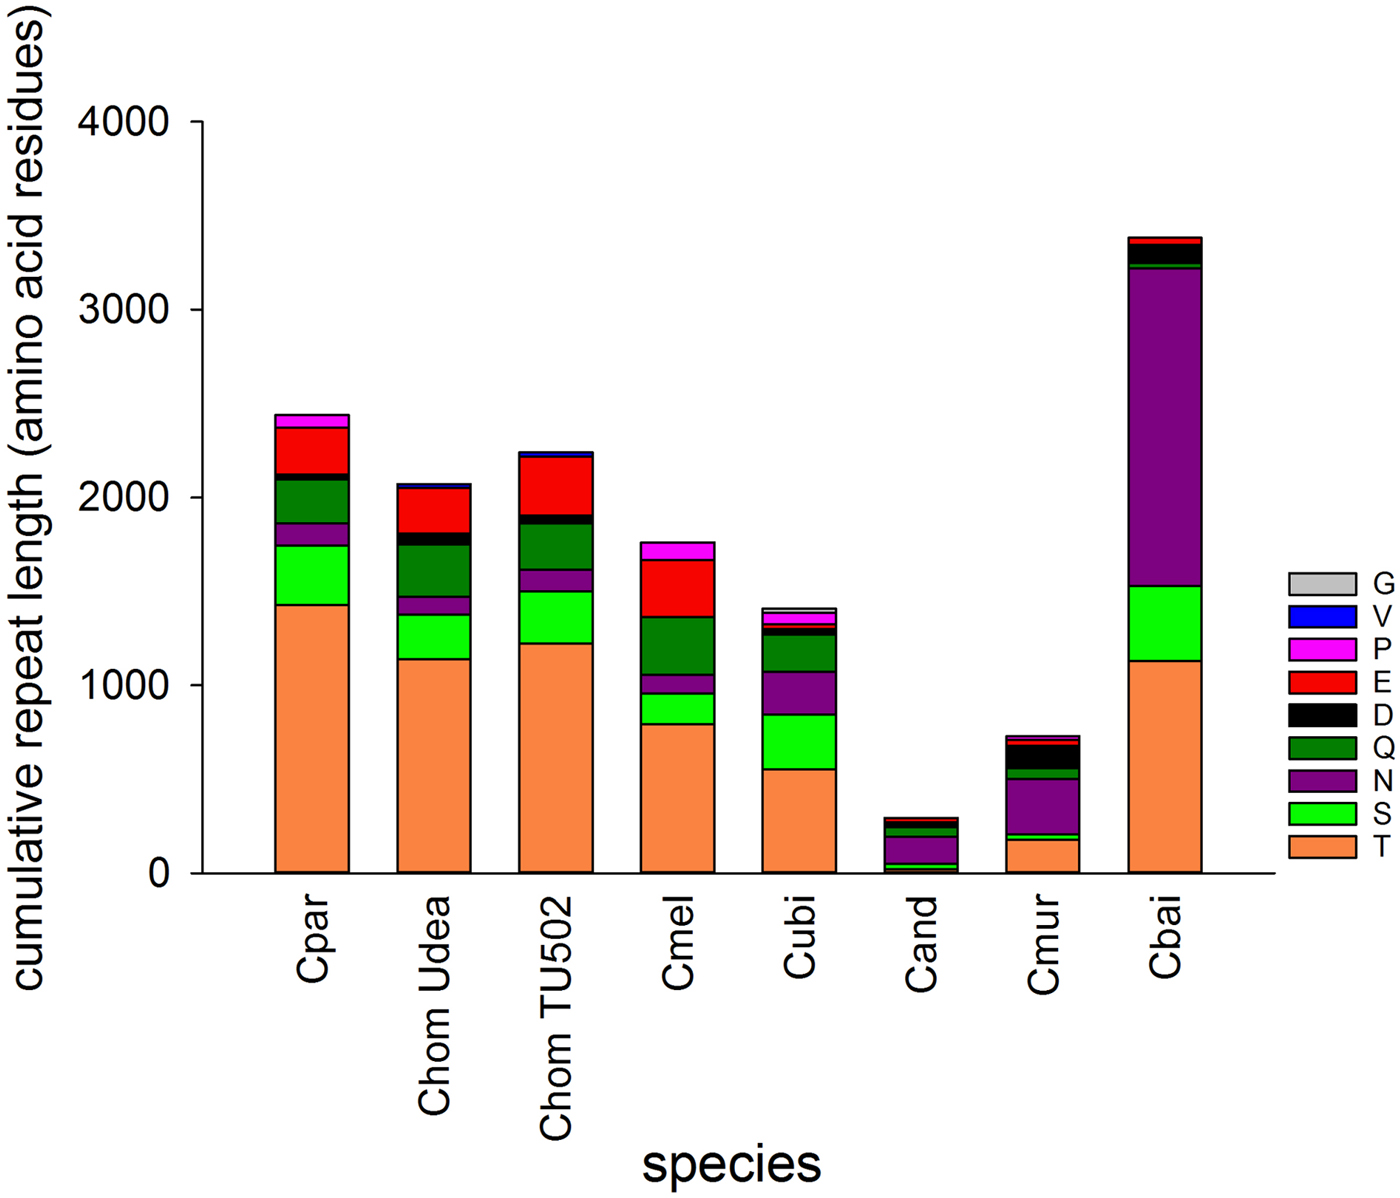
The genomes of seven Cryptosporidium species vary in SAAR abundance and length (Fig. 1). The two species belonging to the gastric clade included in the analysis, C. muris and C. andersoni, have a much smaller SAAR inventory. Cryptosporidium baileyi stands out for two reasons; its large cumulative SAAR length totaling 3383 amino acid residues, and the abundance of asparagine (N) repeats. I tested whether the cumulative length of SAARs is correlated to genome length or number of protein-coding genes. Repeat length and number of protein-coding genes were found to be negatively correlated (r = −0.78, n = 8, P = 0.02). A similar negative but non-significant correlation was also found between repeat length and genome size (r = −0.69, n = 8, P = 0.057). As expected, genome size and number of genes were positively correlated (r = 0.95, n = 8, P = 3.1 × 10⁻⁴). Thus, SAAR abundance is independent of genome length, but is lower in genomes encoding more genes. The negative correlation between the number of protein-coding genes and repeat length argues against the data being biased by genome coverage. The two variables would likely be positively correlated if the differences between species would have resulted from gaps in the sequence.

Fig. 1. Cumulative length of single-amino acid repeats by repeat type. Perfect and interrupted repeats longer than 20 amino acid identified with XSTREAM are included. Colours indicate amino acid as shown in key. C. muris (Cmur) and C. andersoni (Cand) infect the stomach and abomasum, respectively, whereas C. baileyi (Cbai) is found exclusively in birds. Two C. hominis (Chom) genomes were analysed to provide an estimate of within-species variation. Cpar, C. parvum; Cmel, C. meleagridis; Cubi, C. ubiquitum.
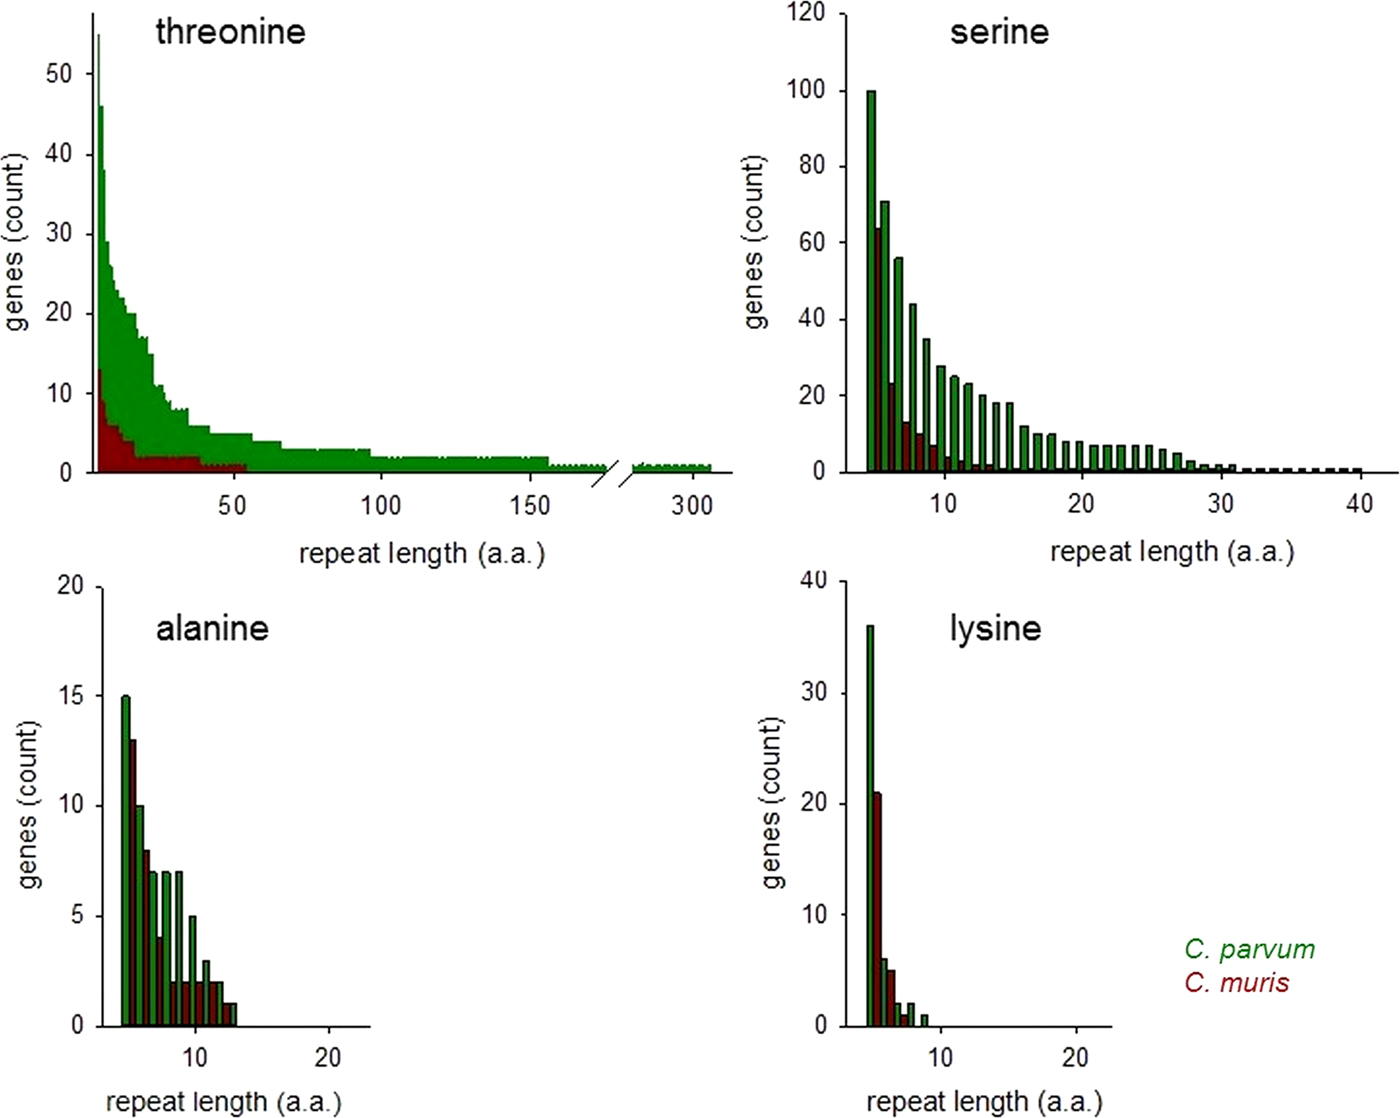
The histograms in Fig. 2 compare ranked abundances of four types of uninterrupted SAARs ⩾5 residues in C. parvum and C. muris. Because of the importance of O-glycosylated mucins for the interaction between Cryptosporidium parasites and the host (Petersen et al. Reference Petersen, Gut, Nelson and Leech1991; Barnes et al. Reference Barnes, Bonnin, Huang, Gousset, Wu, Gut, Doyle, Dubremetz, Ward and Petersen1998; Chatterjee et al. Reference Chatterjee, Banerjee, Steffen, O'Connor, Ward, Robbins and Samuelson2010; Bhalchandra et al. Reference Bhalchandra, Ludington, Coppens and Ward2013), this analysis is focused on T and S SAARs.

Fig. 2. Abundance of uninterrupted repeats in C. parvum and C. muris. Genes featuring SAARs of the length shown on the x-axis are plotted on the y-axis, ranked by abundance. Repeats of potentially O-glycosylated threonine and serine are more abundant in C. parvum than in C. muris. Repeats of other amino acids do not show the same difference as exemplified by A and L SAARs.
Consistent with the histogram shown in Fig. 1, the abundance of T and S SAARs is higher in C. parvum than in C. muris. The number of C. parvum genes with uninterrupted T and S SAARs ⩾5 residues (55 and 100 genes, respectively) is 4.2 and 1.6-fold, respectively, the C. muris gene count with such repeats (13 and 64 genes, respectively). The longest uninterrupted T SAAR in C. parvum IOWA is 307 residues long and is located in gene cgd3_720, which is annotated as probable mucin with signal peptide. In contrast, in C. muris the longest uninterrupted T repeat, located in CMU_014140, is 54 residues long. CMU_014140 and cgd3_720 are not orthologous; CMU_014140 is orthologous to C. parvum cgd7_4020, which is a mucin with signal peptide, and in the literature has been referred to as GP900 (Barnes et al. Reference Barnes, Bonnin, Huang, Gousset, Wu, Gut, Doyle, Dubremetz, Ward and Petersen1998). The uninterrupted T SAAR in cgd7_4020 is 155 residues long, the second longest in the C. parvum IOWA genome. The rank-abundance analysis (Fig. 2) was extended to alanine and lysine repeats to assess to what extent this observation also applies to SAARs unrelated to mucins. An excess of C. parvum over C. muris genes was also found for repeats of A and L ⩾5 residues long but, with 15% and 71%, the difference between the two species was smaller.
To explore whether the difference in SAAR profile originates primarily from gene loss or from differential SAAR evolution, I tabulated 19 C. parvum genes with perfect and imperfect T repeats ⩾20 amino acids in length and their C. muris orthologs (Table 1). Cryptosporidium muris orthologs were found for 11 (57%) of these genes. This ratio deviates significantly from the genome-wide expectation based on 3363 C. parvum genes with C. muris orthologs out of 3805 annotated genes (88%; χ 2 = 17.3; P < 0.001). For S SAARs, 11 C. parvum genes were found based on the same SAAR length threshold (Table 2); eight of these (72%) had C. muris orthologs. This proportion does not deviate significantly from the genome-wide expectation (χ 2 = 2.5; P = 0.11). Consistent with the global analysis shown in Fig. 1, in most C. parvum–C. muris orthologous pairs, C. muris SAARs are shorter or absent. This analysis points to shortening of SAARs in gastric species, or lengthening in intestinal species, and possibly to gene loss, as causes of the smaller C. muris SAAR inventory.
Table 1. Threonine SAAR repeat length in orthologous C. parvum and C. muris genes

a Minimum C. muris SAAR length = 6 residues.
Table 2. Serine SAAR repeat length in orthologous C. parvum and C. muris genes

a Minimum C. muris SAAR length = 6 residues.
PCR verification of SAARs
Highly repetitive sequences are prone to sequence errors and can be difficult to assemble. To ensure that SAAR length information obtained from the annotated Cryptosporidium genomes is accurate, PCR amplicons derived from long SAAR were Sanger-sequenced. The sequences were then aligned to the homologous genomic sequences downloaded from CryptoDB.org. Although the number of SAARs that can be analysed in this manner is small compared with the entire inventory, this analysis is adequate to detect a possible general bias. Such a bias could have resulted from the fact that different Cryptosporidium genomes were sequenced and assembled in different laboratories. A gel analysis of amplicons from genes cgd8_1160 and cgd5_450 spanning a 165-nt (55 amino acids) T SAAR and a 84-nt (28 amino acids) S SAAR, respectively, in the C. parvum IOWA genome is shown in Supplementary Fig. 1. The homologous loci were also amplified from oocyst DNA from a recent propagation of C. hominis TU502 isolate. The length of the cgd8_1160 amplicons in IOWA and TU502 predicted by the genome sequence is 457 nt and 411 nt, respectively. For cgd5_450, the genomic sequences predict amplicon sizes of 726 nt and 681 nt in IOWA and TU502, respectively. As seen in Supplementary Fig. 1, the gel analysis is consistent with the amplicon sizes predicted by the genome. Further confirming the accuracy of the C. parvum IOWA and C. hominis TU502 genome sequence at these loci, the cgd5_450 amplicon sequence encodes a 84-nt repeat encoding 28 S residues in IOWA and a 33-nt sequences encoding 11 S residues in TU502. Multiple attempts to sequence the cgd8_1160 amplicons failed, including attempts to sequence cgd8_1160 amplicons cloned in a pCR-TOPO plasmid. This observation suggests that the 165-nt T SAAR interferes with the sequencing reaction. The sequences of the cgd5_450 amplicon included a second, shorter S SAAR located 219 nt downstream. In the IOWA cgd5_450 amplicon, the repeat was identical to that found in the IOWA genome. In contrast, in C. hominis isolate TU502 a length polymorphism was detected. The sequence of the amplicon was two S residues longer than the reference TU502 genome sequenced in 2004 (Xu et al. Reference Xu, Widmer, Wang, Ozaki, Alves, Serrano, Puiu, Manque, Akiyoshi, Mackey, Pearson, Dear, Bankier, Peterson, Abrahamsen, Kapur, Tzipori and Buck2004) and one residue longer than the newly sequenced TU502 genome from 2012 (Ifeonu et al. Reference Ifeonu, Chibucos, Orvis, Su, Elwin, Guo, Zhang, Xiao, Sun, Chalmers, Fraser, Zhu, Kissinger, Widmer and Silva2016). In two additional C. hominis genome sequences (isolates UKH1 and 37999) the repeat sequences were identical as found in the amplicon sequenced here. These results indicate that no systematic bias is present in SAAR sequences in the genomes. Minor differences in SAAR length in C. hominis are consistent with intra-species sequence polymorphism (Widmer et al. Reference Widmer, Lee, Hunt, Martinelli, Tolkoff and Bodi2012; Ifeonu et al. Reference Ifeonu, Chibucos, Orvis, Su, Elwin, Guo, Zhang, Xiao, Sun, Chalmers, Fraser, Zhu, Kissinger, Widmer and Silva2016).
Correlation between genetic distance and SAAR distance
The phylogeny of the genus Cryptosporidium is defined by two distinct clades comprising species infecting the stomach and species infecting the intestine and colon, respectively (Slapeta, Reference Slapeta2013). Within the latter group, the avian parasite C. baileyi stands out for its divergence from species infecting mammals. The genome-wide SAAR analysis shown in Fig. 1 suggests that genetic distance and SAAR divergence are correlated. To further explore this apparent trend, the genetic and SAAR distances between eight genomes from seven Cryptosporidium species were quantified and visualized on separate PCoA plots (Fig. 3A and B). Both plots reveal a similar topology; C. baileyi does not cluster with any other species, whereas gastric and intestinal species fall into two distinct groups. Based on the phylogeny of the genus Cryptosporidium, the 18S topology was expected. The similar PCoA topology obtained with the SAAR data, indicates that divergence in SAAR length to some extent parallels divergence between species. However, the correlation between the two distance metrics (Fig. 3C and D) shows that pairwise SAAR distances between C. baileyi and the other species exceeds by a factor >3 what would be expected from the genetic distances. A numerical evaluation of pairwise 18S and SAAR distances confirms this observation. The mean 18S distance between C. baileyi and any other species equals 0.048 (n = 8), which is 1.2 times higher than the mean 18S distance for all other (excluding C. baileyi) pairwise comparisons (n = 28) of 0.040. In contrast, the analogous calculation for pairwise SAAR distances (SSR distance as defined in the section Materials and Methods) shows that the average SAAR distance between C. baileyi and any other species (2.88 × 10⁶, n = 7) is 4.3 times higher than the mean distance for all other pairwise comparisons (6.7 × 10⁵, n = 21). Compared with the 18S distances, C. baileyi’s SAAR distances to other species are thus in average more than three times larger. This observation indicates that C. baileyi SAARs have diverged at a faster rate than expected from the 18S genetic distance, suggesting that in C. baileyi selection favours longer repeats. Conversely, the data could also indicate selection for shorter SAARs in species other than C. baileyi. Supplementary Fig. 2 shows that the excess SAAR distance is driven primarily by N SAARs, as expected from Fig. 1. Whereas for T, Q and S genetic distance and SSR distance are strongly correlated, this is not the case for N, D and E SAARs.
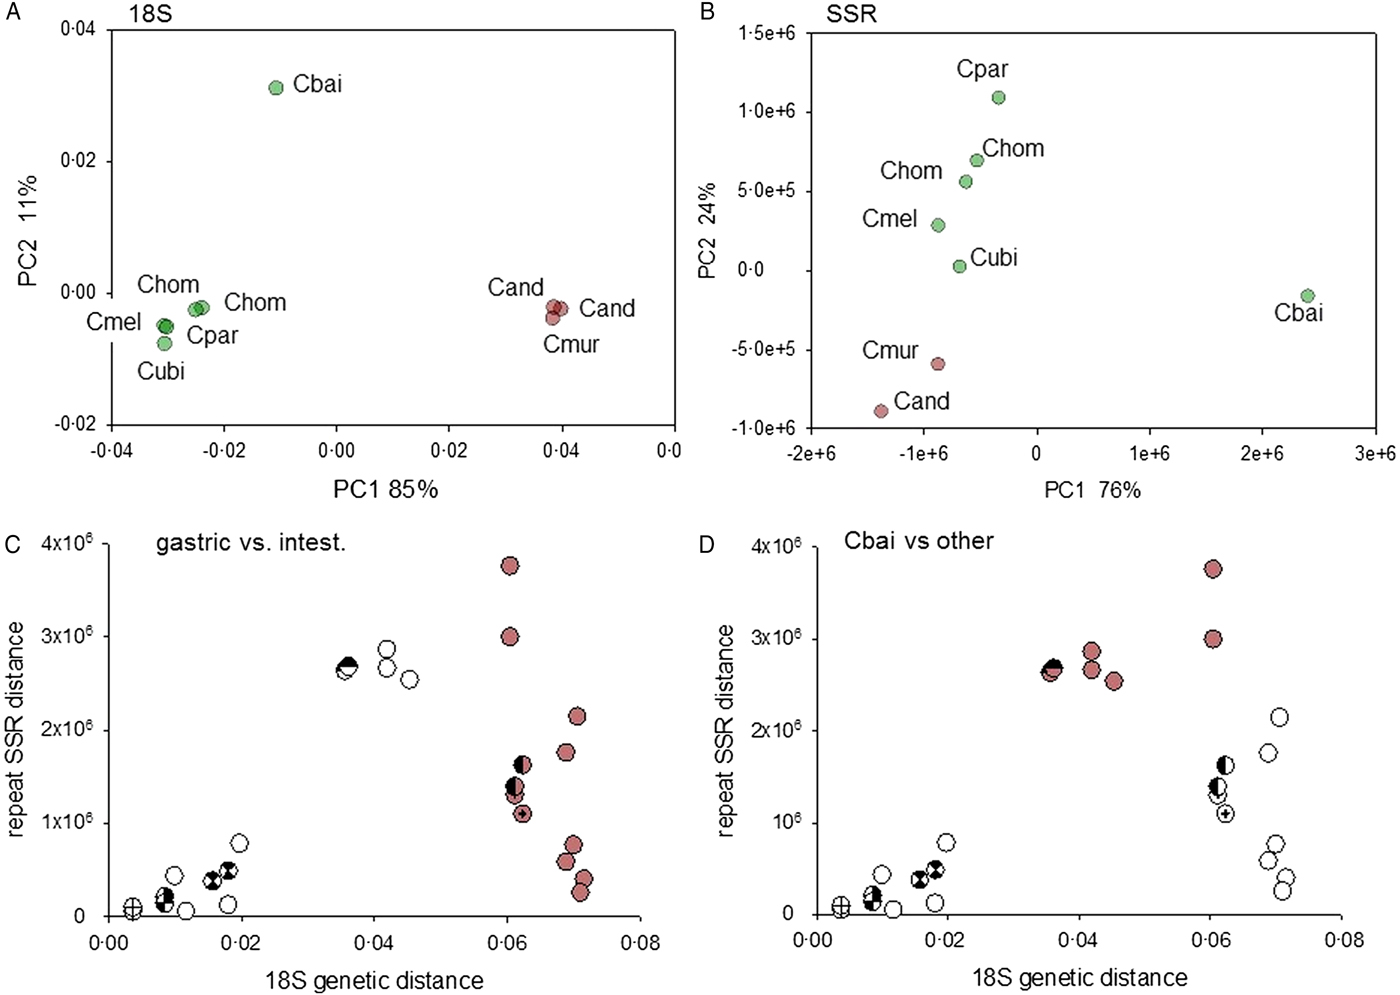
Fig. 3. Correlation between genetic distance and SAAR distance. (A) PCoA visualizing pairwise distances between 9 18S sequence pertaining to 7 Cryptosporidium species. The genetic distances were calculated from the aligned 18S rRNA sequence approximately 1725 nt in length. Intestinal species and gastric species are represented with green and brown data points, respectively. To provide a measure of intra-species distance, two C. andersoni (Cand) and two C. hominis (Chom) sequences were included. The accession numbers of the sequences are listed in the section Materials and Methods. (B) Analogous PCoA analysis as shown in panel A but based on pairwise distance between SAAR profiles. The distances were calculated using the SSR metric as described in Materials and Methods. As represented by modified symbols, two C. hominis datasets are included to visualize intra-species distance. (C, D) Correlation analysis of 18S and SAAR data shown in A and B reveals high divergence of C. baileyi SAARs. Colored symbols in panel C (n = 12) indicate distance between a gastric species, C. muris or C. andersoni, and one of the six genomes from intestinal species. The same data points are depicted in panel D, but in this panel colored symbols (n = 7) represent distances between C. baileyi the other species. Crossed, semi-filled and hourglass symbols show replicate distances obtained from the analysis of two C. hominis genomes (TU502 and Udea).
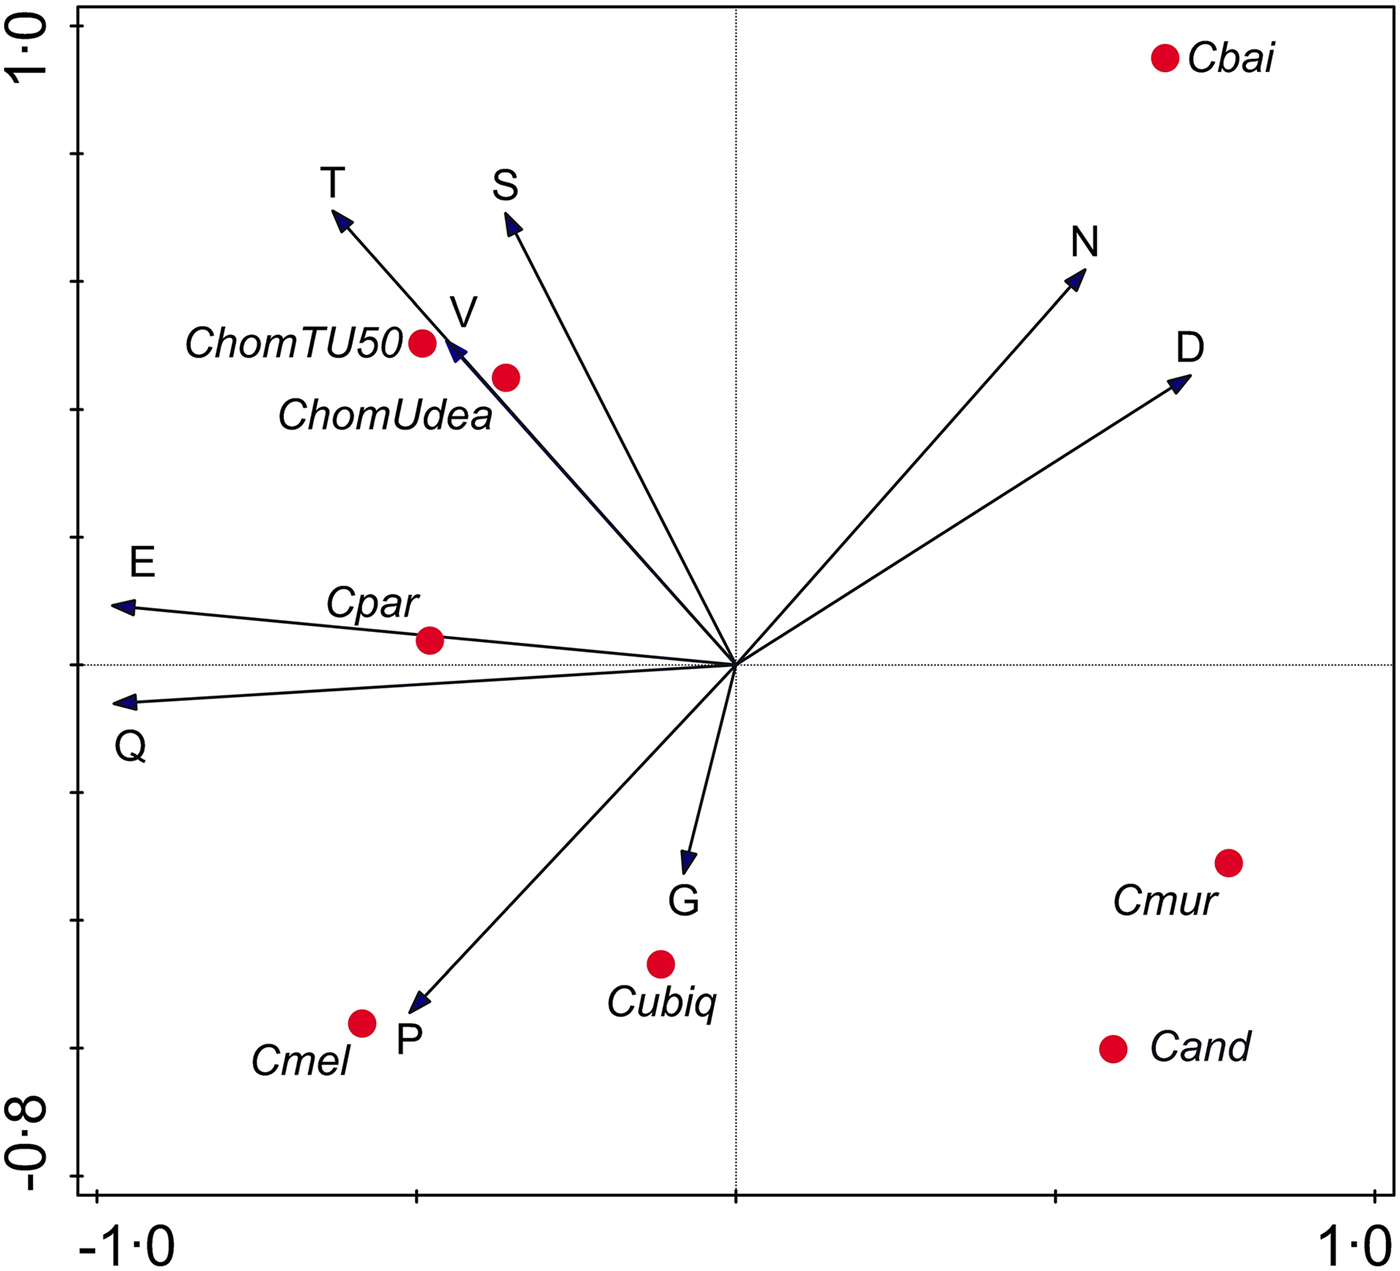
To gain further insight into evolutionary forces shaping Cryptosporidium SAARs, I analysed the correlation between SAAR length across seven Cryptosporidium species (Supplementary Table S2). A PCA focused on SAAR types was used to visualize the data (Fig. 4). As indicated in the biplot by a small angle between the S and T SAAR arrows, the two repeat types found in mucins are correlated across species; longer S SAARs tend to occur in species with longer T repeats. In contrast T and S repeat length across species are uncorrelated with N and D SAARs as indicated by the ~90° between T/S and N/D arrows. As expected from Fig. 1, the N SAAR arrow points in the direction of C. baileyi and in the opposite direction of C. meleagridis.

Fig. 4. Principal Components Analysis biplot representing SAAR length across species. SAAR arrows point in the direction of the steepest increase in SAAR length. The smaller the angle between arrows, the better the correlation between SAAR types across species. Projection of species symbols onto the arrow or their extension approximates the cumulative SAAR abundance in each species. Distance between species symbols approximates difference in SAAR profile, but the species topology in relation to the SAAR arrows only approximately corresponds to the histogram shown in Fig. 1 because the PCA is focused on SAARs. Horizontal and vertical ordination axis explain 41% and 25% of variance, respectively.
Gene-specific analysis: comparison of C. parvum–C. muris orthologs containing long T SAARs
As illustrated in Fig. 2, the difference in abundance and length of uninterrupted T and S in intestinal and gastric species is striking. For instance, the 10 longest T SAAR in C. parvum together total 840 residues, whereas in C. muris the total is 171 residues. To better understand the cause of the differences in amino acid sequence underlying this observation, 17 C. parvum genes with the longest T SAARs were aligned to orthologous C. muris genes. The concatenated amino acid sequence of these 17 pairs of orthologs was 32 766 residues long in C. parvum but only 22 515 residues in C. muris. A dot plot based on a 4 amino acid sliding window revealed one of the reasons for this difference. A ~650-amino motif is repeated eight time in C. parvum gene cgd3_720, but only once in C. muris homolog CMU_037990 (Fig. 5). As a result, C. parvum gene cgd3_720 encodes 11696 amino acids, but the C. muris ortholog is only 3523 amino acids long, i.e. 30% of the homologous C. parvum gene. As shown by the T frequency histograms in Fig. 5, many T-rich motifs present in C. parvum are absent from the C. muris homologs. Many of these repeats are predicted to be heavily O-glycosylated as shown by the O-glyc histograms in Fig. 5. To avoid ascertainment bias, the symmetric analysis starting with the 17 C. muris genes with the longest T SAARs was also performed (Supplementary Fig. 3). Even though the set of orthologous genes was different, this analysis gave similar results.
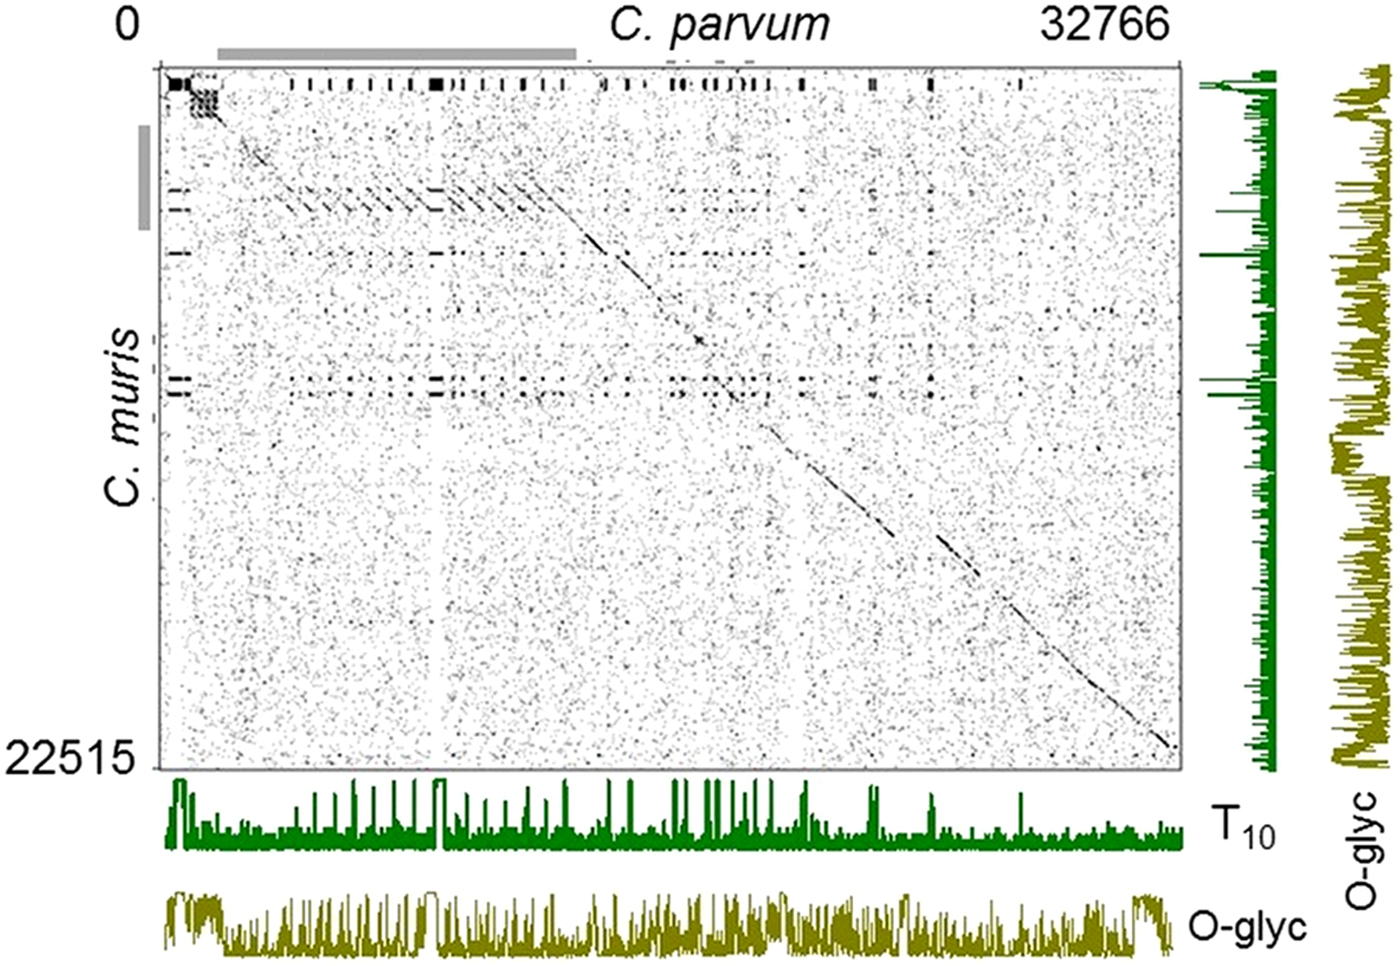
Fig. 5. Dotplot analysis of threonine-rich C. parvum–C. muris homologs. Seventeen C. parvum genes with the longest uninterrupted T SAARs, and for which C. muris homologs were found, were concatenated and compared to the homologous C. muris sequences arranged in the same order. Dots mark the coordinates of conserved 4-amino acid motifs present in both species. Long regions of sequence conservation between the species appear as an interrupted diagonal line. Cryptosporidium parvum gene cgd3_720 (coordinates 1941–13618 on the x axis) indicated with the horizontal grey bar is much longer than the C. muris homolog CMU_037990 due to the presence of a T-rich ~650 amino acid repeat present multiple times in C. parvum but only once in C. muris. The length of the concatenated C. parvum and C. muris amino acid sequences are indicated top right and bottom left, respectively. The number of Ts in a 10-residue running window is indicated for each species on the plots labelled ‘T10’. O-glycosylation prediction scores on a scale of 0-1 are shown in the lowermost and rightmost plots labelled ‘O-glyc’.
Functional analyses
A striking feature of the C. baileyi SAAR profile is the abundance of N repeats, and to a lesser extent repeats of aspartic acid (D) (Figs 1 and 5). Added together, N SAARs represents 1692 residues out of 3383 (50%) residues of the entire C. baileyi SAAR repertoire. In comparison, in the C. muris genome, the cumulative length of SAARs is 730 residues. Thus, added together, C. baileyi N SAARs are 2.3 times longer than all C. muris SAARs together. This observation prompted me to investigate the function of C. baileyi genes with long N SAARs. For this analysis, the 61 C. baileyi genes which encode uninterrupted N SAARs ⩾20 in length were selected. Because the C. baileyi genome has not been annotated, the C. baileyi genes were transformed by orthology to C. parvum using OrthoMCL (Li et al. Reference Escher, Bodmer-Glavas, Barberis and Schaffner2003). Orthologs were identified for 43 (70%) genes. An analysis of these genes for significantly enriched annotations was then performed. Significantly enriched molecular functions included ‘transcription factor activity’, ‘sequence-specific DNA binding’ and ‘nucleic acid binding transcription factor activity’. Fifteen out of 19 enriched cellular functions were related to regulation, such as ‘regulation of nucleic acid-templated transcription’, ‘regulation of RNA metabolic process’, ‘regulation of RNA biosynthetic process’, ‘regulation of transcription, DNA-templated’ or ‘regulation of gene expression’ (Supplementary Table S3).
Analogous analyses were run with C. parvum T and S SAARs ⩾20 and ⩾15 residues, respectively. T SAARs were picked because they are by far the most abundant in C. parvum (see Supplementary Table S2). As for T SAARs, S SAARs are important for their potential to form mucins and play an important role in the interaction of the parasite with the host. Among the 17 C. parvum genes with T homopolymers ⩾20 residues in length, 12 genes (70%) have a signal peptide. Among these 12 genes, seven (41%) also have transmembrane domains. The genome-wide proportion of C. parvum genes with the signal peptide is 683/3886 (18%) and with the signal peptide and transmembrane domains is 379/3886 (10%). The association between the presence of T SAAR and signal peptide is significant (χ 2 = 33.1, P < 0.0001). The same holds for the proportion of genes with the signal peptide and transmembrane domain (χ 2 = 19.2, P < 0.0001). A functional enrichment analysis for the 17 C. parvum genes revealed a single significantly enriched gene ontology (GO) term (0005576, extracellular region; Bonferroni-corrected P = 0.0044). No enriched molecular function terms were identified. In the analysis of C. parvum S SAARs, since only eight genes with uninterrupted repeats of ⩾20 residues were found, 18 C. parvum genes with S homopolymers ⩾15 residues were analysed. Two of the 18 genes have a signal peptide and the same two genes also possess ⩾1 trans-membrane domains. This number is not significantly different from the genome-wide proportion P = 0.47 and P = 0.8, respectively. However, ten significantly enriched metabolic processes and seven significantly enriched molecular functions were identified (Supplementary Table S4). Consistent with the predicted low proportion of proteins with signal peptide/trans-membrane domain in this group, all enriched metabolic processes are related to cytoplasmic pathways such as oligosaccharide/carbohydrate metabolism.
N SAARs in Eimeria species infecting birds
The difference between the repeat profile in C. baileyi and in non-avian intestinal Cryptosporidium species led me to investigate whether N SAAR abundance or SAAR abundance in general, is associated with species adapted to birds. As no other genome from avian Cryptosporidium species other than C. baileyi TAMU-09Q1 has been sequenced, I compared four Eimeria genomes downloaded from the ToxoDB database (Gajria et al. Reference Gajria, Bahl, Brestelli, Dommer, Fischer, Gao, Heiges, Iodice, Kissinger, Mackey, Pinney, Roos, Stoeckert, Wang and Brunk2008); Eimeria falciformis, Eimeria tenella, Eimeria maxima and Eimeria necatrix. Eimeria falciformis is a parasite of mice and the only non-avian species for which the genome was available. The results (Supplementary Fig. 4) show that cumulative SAAR length in the three species infecting birds exceeds that of the mouse parasite E. falciformis. However, N SAARs are not overrepresented, indicating that N SAARs are unlikely to represent an adaptation of enteric Apicomplexa to birds. Similarly, comparing Plasmodium gallinaceum, an avian malaria parasite to P. falciparum did not reveal a higher abundance of N SAARs in the former species (not shown). To the contrary, P. falciparum N SAARs total 9135 residues, or 91% of the total length of SAARs identified using XSTREAM as described in Material and Methods. In P. gallinaceum, N SAARs were much less abundant (3909 residues) and represented only 66% of the cumulative SAAR length (data not shown).
Discussion
The primary motivation for this study was to extend an initial observation showing that in the newly sequenced genome of C. muris S and T SAARs are fewer and shorter compared with C. parvum and C. hominis. S and T-rich proteins are potentially extensively glycosylated, forming mucins which play an important role in the interaction between host and Cryptosporidium parasites. Mucins may also be recognized by the immune response (Barnes et al. Reference Barnes, Bonnin, Huang, Gousset, Wu, Gut, Doyle, Dubremetz, Ward and Petersen1998; Cevallos et al. Reference Cevallos, Bhat, Verdon, Hamer, Stein, Tzipori, Pereira, Keusch and Ward2000; O'Connor et al. Reference O'Connor, Burns, Ha-Ngoc, Scarpato, Khan, Kang and Ward2009; Chatterjee et al. Reference Chatterjee, Banerjee, Steffen, O'Connor, Ward, Robbins and Samuelson2010). Intra-species polymorphism in SAAR length has been attributed to immune-mediated selection for antigenic diversity (Gatei et al. Reference Gatei, Das, Dutta, Sen, Cama, Lal and Xiao2007). The low abundance of mucins in gastric Cryptosporidium species, confirmed here by the analysis of the C. andersoni genome, led to the hypothesis that the parasite's interaction with the host in the stomach and the small intestine differs, and that SAAR abundance in different species reflects adaptation to different host environments. This putative adaptive process appears to have primarily led to a shortening of C. muris SAARs in relation to C. parvum, as opposed to selective C. muris gene loss. However, the results from the analysis of C. parvum–C. muris orthologs (see Tables 1 and 2) cannot exclude that C. muris genes orthologous to C. parvum genes with long T SAARs may have been lost following the branching into a gastric and an intestinal Cryptosporidium clade. To investigate a possible adaptive process, the SAAR analysis was expanded to other sequenced Cryptosporidium species and to other SAAR types, as new genomes sequence became available. Stark differences in SAAR profile between related species is not unique to the genus Cryptosporidium. Repeats of N are very abundant in P. falciparum and P. reichnowi, but are rare in other Plasmodium species (Muralidharan et al. Reference Muralidharan, Oksman, Iwamoto, Wandless and Goldberg2011; Muralidharan and Goldberg, Reference Muralidharan and Goldberg2013).
The functional significance of the small SAAR inventory in C. muris and C. andersoni is unknown. Since extracellular stages of gastric species are exposed to acidity in the stomach and abomasum, it is conceivable that a reduced SAAR inventory reflects adaptation to the extreme acidic environment. The mechanism selecting against long SAARs in these species, if it exists, remains unknown. Weighing the relative importance of SAAR adaptation vs random contraction/expansion during divergence between species requires the analysis of additional genomes. As no other apicomplexan protozoa are known to colonize the stomach, extending SAAR analyses to other genera inhabiting the same environment is not feasible, limiting our ability to identify mechanisms driving the evolution of SAARs in these species. In the genus Helicobacter, the species Helicobacter pylori infects the stomach, whereas other species multiply in other organs. The analysis of the genome of H. pylori and Helicobacter cineadi, an enterohepatic species, revealed no difference in SAAR abundance (data not shown). This comparison is far from ideal because SAARs in prokaryotes are rare (Sim and Creamer, Reference Sim and Creamer2002) and may be subject to very different evolutionary constraints. Also, in contrast to Cryptosporidium, Helicobacter species are primarily extracellular. Moreover, H. pylori may not be directly exposed to stomach acidity because it is known to neutralize the pH of the mucus in which the bacteria multiply. In spite of these differences, the limited analysis of Helicobacter suggests that SAAR contraction is not a feature shared by gastric pathogens.
In addition to revealing clear differences in the SAAR profile of gastric and intestinal Cryptosporidium species, the analyses presented here highlight unique and previously unknown features in the genome of the avian parasite C. baileyi. In comparison with other intestinal species, the C. baileyi genome has accumulated a large number of proteins with long N SAARs, and to a lesser extent, D SAARs. Three observations are consistent with an adaptive significance of the expansion of these types of SAARs; (1) repeats of other amino acids have not expanded in C. baileyi; (2) the divergence between the C. baileyi SAAR profile and that of other species exceeds the genetic distance estimated from the 18S rRNA gene (Fig. 3, Supplementary Fig. 2); (3) in terms of function, N-rich C. baileyi proteins are significantly enriched for regulatory functions (Supplementary Table 3). Interestingly, the latter observation also applies to the yeast proteome (Young et al. Reference Young, Sloan and Van Riper2000). Although Eimeria species infecting birds are more SAAR-rich (Supplementary Fig. 4), the difference between avian Eimeria and the murine parasite E. falciformis lies primarily in the abundance of glutamine (Q) repeats, not N repeats as in C. baileyi. A preliminary analysis of GO term enrichment in C. baileyi genes with N SAARs and E. tenella genes with Q SAARs, did however uncover a statistically significant number of shared enriched GO terms (data not shown). Arguing against a simple adaptive model driving N SAAR expansion in avian parasites is the observation that the SAAR profile of C. meleagridis, a species with a wide host range that includes birds (Slavin, Reference Slavin1955; Morgan et al. Reference Morgan, Monis, Xiao, Limor, Sulaiman, Raidal, O'Donoghue, Gasser, Murray, Fayer, Blagburn, Lal and Thompson2001), clusters with the intestinal species, rather than with C. baileyi. However, as only one avian Cryptosporidium genome and only one non-avian Eimeria genome have been sequenced to date, firmer conclusions on the adaptive significance of sequence repeats, and on the evolution of C. baileyi SAARs in particular, will require additional genome sequences. The analysis of additional genomes of C. baileyi and other Cryptosporidium genotypes infecting birds (Holubova et al. Reference Holubova, Sak, Horcickova, Hlaskova, Kvetonova, Menchaca, McEvoy and Kvac2016) is clearly warranted. In the meantime, selected loci with long SAARs in C. baileyi can be amplified from other avian Cryptosporidium isolates and sequenced to assess whether N SAARs are conserved among avian Cryptosporidium species and genotypes.
The genome of P. falciparum is rich in amino acid and nucleotide repeats. Repeats of N are the most common type (Singh et al. Reference Singh, Chandra, Bhattacharya, Akhouri, Singh and Sharma2004). Several interesting examples of malaria phenotypes linked to repeat length or repeat presence/absence have recently been reported (McHugh et al. Reference McHugh, Batinovic, Hanssen, McMillan, Kenny, Griffin, Crawford, Trenholme, Gardiner, Dixon and Tilley2015; Davies et al. Reference Davies, Thalassinos and Osborne2016; Cutts et al. Reference Cutts, Laasch, Reiter, Trenker, Slater, Stansfeld and Vakonakis2017). Some authors have suggested that SAARs in P. falciparum have an adaptive significance, such as favouring immune evasion (Hughes, Reference Hughes2004). However, this view is not universally shared (DePristo et al. Reference DePristo, Zilversmit and Hartl2006). Because of the tendency of SAARs, microsatellites and minisatellites to contract or expand, it has been proposed that variation in intragenic repeat length provides antigenic and functional diversity that, in fungi and other pathogens, allows rapid adaptation to the host environment and immune evasion (Ferreira et al. Reference Ferreira, Ribeiro, Tonon, Kawamoto and Rich2003; Verstrepen et al. Reference Verstrepen, Jansen, Lewitter and Fink2005). The observations by Verstrepen et al. also support the view that intragenic repeat number polymorphism affects cell surface properties in a quantitative manner. Another yeast phenotype modulated by the length of a T and S-rich mucin-like protein has been described (Fidalgo et al. Reference Fidalgo, Barrales, Ibeas and Jimenez2006). The length of a putatively O-glycosylated surface protein was found to be linked to cell buoyancy. The significant association in C. parvum proteins of a signal peptide or transmembrane domain with the presence of T SAARs is consistent with such repeats mediating the interaction between the parasite and the host cell. N repeats have attracted interest because of the potential of N-rich proteins to form amyloid and prions (An et al. Reference An, Fitzpatrick and Harrison2016). To what extent such structures may occur in C. baileyi, and what evolutionary significance they might have, is unknown. A practical implication of these observations is the possibility that depletion of intracellular N may inhibit C. baileyi multiplication without impacting the host. This is supported by reports on anti-tumour activity of asparaginase in mice (Capizzi et al. Reference Capizzi, Bertino and Handschumacher1970) and the in clinic (Koprivnikar et al. Reference Koprivnikar, McCloskey and Faderl2017). These observations raise the possibility that asparaginase may be useful to control cryptosporidiosis in birds. Plasmodium berghei without functional asparaginase displayed a delayed development in the mouse and mosquito (Nagaraj et al. Reference Nagaraj, Mukhi, Sathishkumar, Subramani, Ghosh, Pandey, Shetty and Padmanaban2015).
Other types of SAARs which have attracted attention due to their biological properties are Q repeats. PolyQ domains are found in eukaryotic transcription factors (Escher et al. Reference Escher, Bodmer-Glavas, Barberis and Schaffner2000). An analysis of human protein interactomes revealed that proteins with Q SAARs engage in more interactions with other proteins compared with proteins lacking such motifs. Expansion of Q repeats results in abnormal interactions and may favour protein aggregation. (Schaefer et al. Reference Schaefer, Wanker and Andrade-Navarro2012). As shown above (Figs 1 and 4), Q SAARs are more abundant in intestinal Cryptosporidium species, a species distribution which is almost completely opposite of that of D and N SAARs (Fig. 4). This observation again raises the possibility of SAAR profiles being shaped by selective pressure, possibly related to host range.
To provide an estimate of the variability of the SAAR profile within species, two C. hominis genomes were included in the analyses. The close similarity between the two C. hominis SAAR profiles (Figs 1, 3 and 4) indicates that the sequencing strategy (Supplementary Table S1) did not majorly impact the SAAR profile. The potential for sequencing and assembly artefacts to generate errors in repetitive sequences is a concern, particularly with short read sequencing. The two C. hominis projects used different sequencers and different assembly programs, MaSuRCA and NEWBLER, respectively. The data provide no evidence that SAAR polymorphism between species can be explained by the sequencing and assembly strategy. Moreover, Supplementary Table S1 shows no association between the predominance of short SAARs in gastric species and the use of a particular sequencing platform. The presence of different T and S codons within Cryptosporidium repetitive sequences would also be expected to reduce the likelihood of misassembly.
In conclusion, a global analysis of SAARs in eight genomes pertaining to seven Cryptosporidium species has revealed different SAAR signatures in species infecting the stomach, species infecting the small intestine and colon and the only sequenced avian species. The rapidly expanding volume of apicomplexan sequence data will support more comprehensive analyses and enable statistical tests which are not supported by the small number of genomes currently sequenced. More extensive analyses of rapidly evolving sequences such as simple repeats, micro- and minisatellites are expected to converge on explaining specific Cryptosporidium phenotypes, like host range and virulence.
Supplementary material
The supplementary material for this article can be found at https://doi.org/10.1017/S0031182018000112
Acknowledgements
I thank Julia Dilo for expert assistance with PCR analyses and Alex Grinberg for valuable comments and suggestions. Saul Tzipori and Donna Akiyoshi generously provided C. hominis oocysts. Rafaat Ras analysed the Helicobacter genomes.
Financial support
Financial support from the National Institute of Allergy and Infectious Diseases (grants R21AI125891, R15AI122152) is gratefully acknowledged.