


Introduction
The circumscription of species in lichen-forming fungi has largely been based on morphological or chemical characters. Especially in groups of foliose and fruticose lichens, characters of the vegetative thallus have been widely used in the distinction of taxa. However, there is a growing body of evidence from DNA-based studies that morphological and chemical characters do not reflect the real number of species in lichenized fungi (Crespo & Lumbsch Reference Crespo and Lumbsch2010). Cladoniaceae is a perfect example to illustrate the difficulties of species circumscriptions using phenotypic characters. Several phylogenetic studies have demonstrated a remarkable amount of phenotypic disparity in this family (Stenroos & DePriest Reference Stenroos and DePriest1998; Wedin et al. Reference Wedin, Döring and Ekman2000; Stenroos et al. Reference Stenroos, Hyvönen, Myllys, Thell and Ahti2002a, b; Zhou et al. Reference Zhou, Wei, Ahti, Stenroos and Högnabba2006; Lumbsch et al. Reference Lumbsch, Parnmen, Rangsiruji and Elix2010; Parnmen et al. Reference Parnmen, Rangsiruji, Mongulsuk, Boonpragob, Elix and Lumbsch2010). In fact, it is well known among lichenologists that species recognition within the core genus of the family, Cladonia, is not an easy task (Thomson Reference Thomson1968; Ahti & Sohrabi Reference Ahti and Sohrabi2006; Syrek & Kukwa Reference Syrek and Kukwa2008). Morphology-based species circumscriptions in Cladonia rely heavily on the secondary thallus, the so-called podetia, while the primary thallus is simpler and has been used to distinguish taxa only in a few instances (Ahti Reference Ahti2000). However, numerous species of Cladonia are morphologically variable (Ahti Reference Ahti2000; Kotelko & Piercey-Normore Reference Kotelko and Piercey-Normore2010), for example C. furcata (Huds.) Schrad. (Ahti & Hammer Reference Ahti, Hammer, Nash, Ryan, Gries and Bungartz2002), C. ramulosa (With.) J. R. Laundon (Ahti Reference Ahti2000; Burgaz & Ahti Reference Burgaz and Ahti2009) or C. squamosa Hoffm. (James Reference James, Smith, Aptroot, Coppins, Flechter, Gilbert, James and Wolseley2009). The situation is complicated by chemical variability that is often not clearly associated with morphological differentiation.
Phylogenetic studies employing molecular data to address species circumscription in Cladonia have helped to elucidate evolutionary relationships, and to determine the taxonomic relevance of the phenotypic characters in species delimitation. For instance, in the C. arbuscula group, a number of taxa had been described on the basis of different morphologies. However, molecular data suggest that these morphotypes belong to one morphologically variable lineage (Piercey-Normore Reference Piercey-Normore, Ahti and Goward2010). The chemical variability in the C. chlorophaea group could not be correlated with PCR-RFLP patterns found in studies which used ribosomal nuclear DNA (DePriest Reference DePriest1993, Reference DePriest1994). In the C. pyxidata and C. pocillum groups, neither species was found to be monophyletic, and the morphological variation was found to be determined by soil pH (Kotelko & Piercey-Normore Reference Kotelko and Piercey-Normore2010). In the cases of C. subulata (L.) F. H. Wigg. and C. rei Schaer., two morphologically and chemically variable species whose delimitation was disputed (Spier & Aptroot Reference Spier and Aptroot2007), the presence of different secondary metabolites was shown to be correlated with different clades identified in phylogenetic studies using molecular data (Dolnik et al. Reference Dolnik, Beck and Zarabska2010; Pino-Bodas et al. Reference Pino-Bodas, Burgaz and Martín2010).
This study focuses on the Cladonia cariosa group, defined by Culberson (Reference Culberson1969), Harris (Reference Harris1975) and Culberson et al. (Reference Culberson, Culberson, Johnson and Park1993) as consisting of C. brevis (Sandst.) Sandst., C. cariosa (Ach.) Spreng., C. polycarpia G. Merr., C. polycarpoides Nyl., C. sobolescens Nyl. ex Vain., C. subcariosa Nyl., C. subclavulifera Asahina and C. symphycarpa (Flörke) Fr. These species are characterized by a persistent primary thallus and ascyphose podetia. Nevertheless Cladonia brevis, C. polycarpia, C. polycarpoides, C. subcariosa, C. sobolescens and C. subclavulifera differ in their secondary metabolites (Evans Reference Evans1944; Culberson Reference Culberson1969; Park Reference Park1985; Huovinen et al. Reference Huovinen, Ahti and Stenroos1989; Culberson et al. Reference Culberson, Culberson, Johnson and Park1993), but not in morphology, and so Ahti (Reference Ahti2000) combined them in a single species, namely C. subcariosa. Consequently, the Cladonia cariosa group then consisted of C. cariosa, C. subcariosa and C. symphycarpa. Cladonia subcariosa was later shown to be distantly related to the C. cariosa group despite their morphological similarity (Kärkkäinen Reference Kärkkäinen2000). However, C. cariosa and C. symphycarpa constitute a monophyletic group along with C. acuminata (Ach.) Norrl. (Stenroos et al. Reference Stenroos, Hyvönen, Myllys, Thell and Ahti2002a). The latter differs morphologically from C. cariosa and C. symphycarpa in having sorediate podetia, unbranched or dichotomously branched near the tips (Ahti Reference Ahti2000). Hence, the Cladonia cariosa group currently includes C. acuminata, C. cariosa and C. symphycarpa, which are the focus of this study. These three taxa have production of the secondary metabolite atranorin and a calcareous substratum in common (Stenroos Reference Stenroos, Hyvönen, Myllys, Thell and Ahti2002a). The morphological characters used to distinguish C. cariosa from C. symphycarpa are subtle and variable and include squamule size and the amount of podetium fissures, which are more abundant in C. cariosa (Stenroos et al. Reference Stenroos, Ferraro and Ahti1992; Piercey-Normore Reference Piercey-Normore2003; Burgaz & Ahti Reference Burgaz and Ahti2009). Species identification is further complicated by the frequent lack of podetia in C. symphycarpa (Masselink & Sipman Reference Masselink and Sipman1985; Carlin & Larsson Reference Carlin and Owe-Larson1994). The chemical variation has been widely employed to distinguish C. cariosa from C. symphycarpa, but it was found that they share several chemotypes (Harris Reference Harris1975; Culberson et al. Reference Culberson, Culberson, Johnson and Park1993; Piercey-Normore Reference Piercey-Normore2003; Bültmann & Lünterbusch Reference Bültmann and Lünterbusch2008; Burgaz & Ahti Reference Burgaz and Ahti2009). Cladonia cariosa has seven chemotypes: atranorin only (the most common chemotype, including the type material); atranorin and fumarprotocetraric acid; atranorin and homosekikaic acid; atranorin and norstictic acid; atranorin and psoromic acid; atranorin and rangiformic acid or atranorin, fumarprotocetraric and rangiformic acids. Five chemotypes have been described for C. symphycarpa: atranorin only; atranorin and norstictic acid (the most common chemotype); atranorin, norstictic and stictic acids; atranorin and psoromic acid; and atranorin and fumarprotocetraric acid. The chemotype containing psoromic acid was described as C. dahliana (Kristinsson Reference Kristinsson1974), but some authors considered it as a synonym of C. symphycarpa, since they are morphologically indistinguishable (Ahti Reference Ahti1976; Randlane Reference Randlane1986; Ahti & Hammer Reference Ahti, Hammer, Nash, Ryan, Gries and Bungartz2002; Burgaz & Ahti Reference Burgaz and Ahti2009). The chemotype with stictic acidhas been found only in Tierra de Fuego (Stenroos & Ahti Reference Stenroos and Ahti1990; Stenroos et al. Reference Stenroos, Ferraro and Ahti1992). In specimens related to C. symphycarpa from Iceland and Andorra, bourgeanic acid was found (Culberson et al. Reference Culberson, Culberson, Johnson and Park1993; Azuaga et al. Reference Azuaga, Barbero and Gomez-Bolea2001), but the identity of this material has not been confirmed. Given the high chemical variability of C. cariosa and C. symphycarpa, and the fact that several chemotypes are present in both species, the secondary metabolites cannot be used as discriminant characters to tell them apart. Cladonia acuminata consists of three chemotypes that are morphologically indistinguishable (Huovinen et al. Reference Huovinen, Ahti and Stenroos1989): atranorin and norstictic acid; atranorin only; and atranorin and psoromic acid. The chemotype with psoromic acid was described as C. norrlinii Vain. or C. acuminata var. norrlinii Lynge Ahti (Reference Ahti2000) showed that the type material of C. acuminata var. norrlinii contains norstictic and not psoromic acid and consequently included this taxon in C. acuminata. In contrast, Harris (Reference Harris2009) described C. acuminans R. C. Harris as a different species from the psoromic acid chemotype, arguing that the distribution area of two chemical variants is different. Though both chemotypes coexist in North America, the one with psoromic acid is not present in Europe.
The aim of this study is to elucidate the species boundaries within the C. cariosa group and to examine whether the chemically variable taxa C. acuminata, C. cariosa and C. symphycarpa are correlated with phylogenetic lineages.
Materials and Methods
Taxon sampling
In this study we checked the identifications of 323 specimens of the following species: Cladonia cariosa (114 samples), C. symphycarpa (140 samples), C. acuminata (19 samples), C. subcariosa (49 samples) and C. latiloba Ahti & Marcelli (1 sample). The specimens are held in the herbaria B, BG, H, L, MACB, S and UPS, including the types of C. cariosa (H-ACH-1577) and C. symphycarpa (UPS). For the molecular study, specimens were chosen from different geographical origins, including most of the known chemical variability in the group (Table 1). The species were identified using morphological characters (squamule size and morphology of podetia), according to Ahti (Reference Ahti2000), Ahti & Hammer (Reference Ahti, Hammer, Nash, Ryan, Gries and Bungartz2002) and Burgaz & Ahti (Reference Burgaz and Ahti2009). Cladonia subcariosa and C. latiloba were used here as outgroup, based on Kärkkäinen (Reference Kärkkäinen2000) and on our data (Appendix 1). Though they do not belong to the C. cariosa group, Cladonia cariosa and C. latiloba are basal to it.
Table 1. List of taxa and specimens, locality, collection and GenBank accession numbers used in this study
DNA extraction, PCR amplification and DNA sequencing
Before DNA extraction, the secondary metabolites were extracted by soaking the specimens in acetone for two hours, and the liquid was then used for thin-layer chromatography (TLC). The DNeasy Plant Mini Kit (QIAGEN, Hilden, Germany) was used to extract DNA, according to the manufacturer's instructions. The DNA was dissolved in 200 µl of buffer included in the kit. The three following loci were amplified: nuclear ITS rDNA using primer ITS1F (Gardes & Bruns Reference Gardes and Bruns1993) and ITS4 (White et al. Reference White, Bruns, Lee, Taylor, Innis, Gelfand, Sninsky and White1990), rpb2 using two pairs of primers, RPB2-5F/RPB2-7R (Liu et al. Reference Liu, Whelen and Benjamin1999) and RPB2dRaq/RPB2rRaq (Pino-Bodas et al. Reference Pino-Bodas, Burgaz and Martín2010), and ef1α using CLEF-3F/CLEF-3R (Yahr et al. Reference Yahr, Vilgalys and DePriest2006). PCRs were carried out with Ready-to-Go-PCR Beads (GE Healthcare Life Sciences, UK). The volume of reaction was 25 µl for each tube, with 0·4 mM final concentration of primers. The volume of extracted DNA used for the PCR was 1 µl. The amplification programs were: 1) 94°C for 5 min; 5 cycles of 94°C for 30 s, 54°C for 30 s and 72 ºC for 1 min; and 33 cycles of 94°C for 30 s, 48°C for 30 s and 72°C for 1 min; with a final extension of 72°C for 10 min (Martín & Winka Reference Martín and Winka2000) for nuclear ITS rDNA, 2) initial denaturation at 94°C for 5 min; 40 cycles of 95°C for 1 min, 52°C for 30 s and 72°C for 2 min; with a final extension at 72°C for 10 min for rpb2 region, and 3) initial denaturation at 94°C for 5 min; 35 cycles of 95°C for 1 min, 55°C for 30 s and 72°C for 1 min; with a final extension at 72°C for 10 min for ef1α region. PCR products were purified using the QIAquick gel extraction Kit (QIAGEN, Hilden, Germany). The purified DNA was dissolved in 40 µl of buffer included in the kit. The sequencing reactions were done at Secugen S. L. (CIB, Madrid, Spain) and Macrogen (South Korea) service (www.macrogen.com), with the same primers used for the PCR.
Sequence alignment and phylogenetic analysis
The alignments were made manually with SE-AL v2.0a11 (Rambaut Reference Rambaut1996) for each locus separately. Eight ambiguous positions in the ITS rDNA matrix were removed, while the matrices of ef1α and rpb2 did not contain ambiguous positions. Each region was analyzed by maximum parsimony (MP) and maximum likelihood (ML). MP analyses were made using PAUP version 4.0.b.10 (Swofford Reference Swofford2002), using heuristic searches with 1000 random taxon-addition replicates with TBR branch swapping and MulTrees option in effect, equally weighted characters and gaps treated as missing data. For the confidence analysis the bootstrap was applied, with 10 000 replicates, using the fast-step option. Congruence among the different topologies inferred from the loci was tested following Lutzoni et al. (Reference Lutzoni, Kauff, Cox, McLaughlin, Celio, Dentinger, Padamsee, Hibbett, James and Baloch2004). Each clade with more than 75% bootstrap support in the single-gene analyses was scanned for conflict among loci. Since no incongruence was detected among loci, the datasets were combined. MrModeltest (Nylander Reference Nylander2004) was used for selecting the most appropriate nucleotide substitution model for each locus using the AIC criterion. The combined dataset was analyzed by ML and a Bayesian approach. The ML analysis was implemented using Tree-Puzzle 5.2 (Schmidt et al. Reference Schmidt, Strimmer, Vingron and Von Haeseler2002) assuming a GTR+I+G model. The Bayesian analysis was carried out using MrBayes 3.1.2 (Huelsenbeck & Ronquist Reference Huelsenbeck and Ronquist2001). The combined dataset was partitioned into seven sections: ITS rDNA, and each of three codon positions of ef1α and rpb2, respectively. The model SYM+G was applied to the ITS part and each partition of ef1α, while the K80+G model was used for all partitions of rpb2. The posterior probabilities were approximated by sampling trees using Markov Chain Monte Carlo (MCMC). The posterior probabilities of each branch were calculated by counting the frequency of trees visited during MCMC analysis. Two simultaneous runs with 20 000 000 generations, each starting with a random tree and employing 4 simultaneous chains, were executed. Every 1000th tree was saved into a file. The first 1 000 000 generations (i.e. the first 1000 trees) were deleted as the ‘burn in’ of the chain. AWTY (Nylander et al. Reference Nylander, Wilgenbusch, Warren and Swofford2008) was used to determine when the chains reached the stationary stage. The 50% majority-rule consensus tree was calculated using the ‘sumt’ command of MrBayes.
The pairwise fixation index FST (Weir & Cockerham Reference Weir and Cockerham1984) was calculated with DnaSP v. 5 (Librado & Rozas Reference Librado and Rozas2009) using the combined dataset. The FST was employed to estimate the differentiation among the clades following O'Brien et al. (Reference O'Brien, Miądlikowska and Lutzoni2009) and Leavitt et al. (Reference Leavitt, Johnson and St. Clair2011).
Morphology and chemistry
Microscopic measurements of the squamule thickness were carried out using hand-cut transverse sections. Three squamules of the primary thallus were measured for each specimen included in the molecular analyses (except when the material was scarce, in which case only one or two squamules were measured). The podetial squamules of C. acuminata were not studied. In addition, transverse sections of the squamules, cut with a Micron-ACP freezing microtome and stained with lactophenol blue solution, were made to study the cortex structure. The surfaces of the squamules were observed by Scanning Electron Microscopy (SEM) using a Hitachi S-3000N, and the specimens were prepared according to Hale (Reference Hale1973), vacuum-coated with gold-paladium and without critical-point drying. The statistical analyses of length, breadth, incision and thickness of the squamules, thickness of the cortex, the algal layer and the medulla were carried out with the STATGRAPHICS 5.1 software program. The Kolmogorov-Smirnov test was used to check normality, and Levene's test for equality of variances. All variables were normal and had homogeneous variances, hence we used one-way ANOVA to analyze the association of characters among the clades found in phylogenetic analyses, according to Wirth et al. (Reference Wirth, Printzen and Lumbsch2008), Murillo et al. (Reference Murillo, Albertazzi, Carranza, Lumbsch and Tamayo2009) and Rivas-Plata et al. (Reference Rivas-Plata, Hernandez, Lücking, Staiger, Kalb and Cáceres2011). The probability level for significance was set at P < 0·05. A Tukey HSD post-hoc test was performed to identify which differences among clades were significant.
The chemical composition was studied by TLC in 132 specimens following White & James (Reference White and James1985), using solvent systems A and B. Specimens studied by other researchers using TLC were not rechecked (unless they were used for the molecular study). Some old material not suitable for molecular studies was also not checked.
Results
Phylogenetic analyses
A total number of 97 new sequences was generated (Table 1) for this study (32 ITS rDNA, 32 rpb2 and 33 ef1α sequences). The combined data matrix contained 2154 characters (628 in the ITS rDNA, 628 in the ef1α and 898 in the rpb2 dataset), 1817 of which were constant, and 225 parsimony-informative (76 in the ITS rDNA, 54 in the ef1α and 95 in rpb2 dataset). MP analysis generated 24 equally parsimonious trees, 490 steps long, with CI = 0·747 and RI = 0·893. ML analysis yielded a tree with a likelihood value of LnL = −6393·86, while the mean likelihood of the Bayesian tree sampling was LnL = −6108·97.
The phylogenetic reconstructions of the combined dataset using MP, ML and Bayesian analyses yielded trees with similar topologies. Figure 1 shows the tree of the Bayesian analysis. The specimens of the C. cariosa group form a strongly supported monophyletic group in all analyses. Clade A gathers only C. cariosa s.str. specimens, and clade B includes only C. symphycarpa specimens. Cladonia acuminata specimens (clade C) form a monophyletic group. A fourth clade (clade D) includes specimens that were identified as C. cariosa or C. symphycarpa on the basis of morphology and chemistry. The pairwise FST values showed genetic differentiation among the clades. The values varied from 0·59 to 0·79 (Table 2).
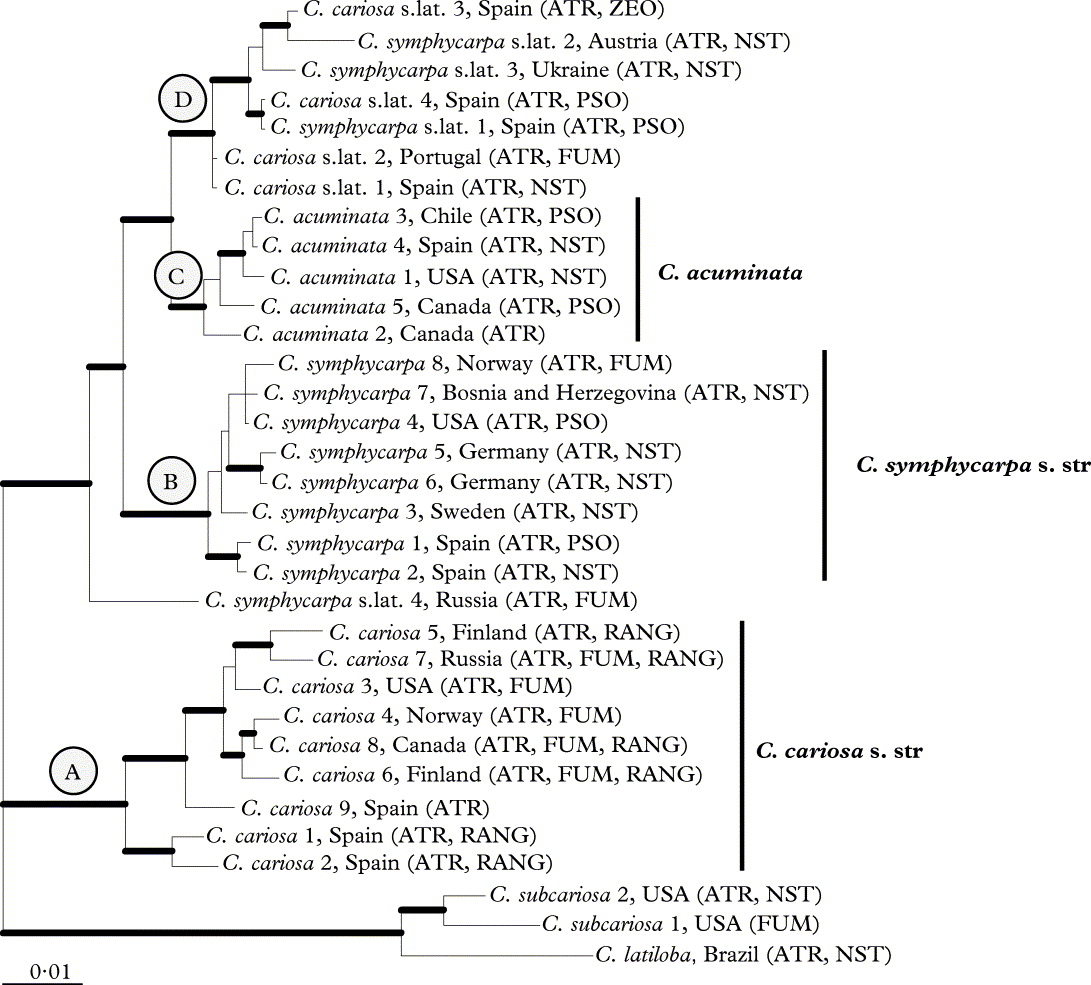
Fig. 1. Phylogeny of the Cladonia cariosa group based on a combined dataset (ITS rDNA, rpb2 and ef1α). This is a 50% majority rule consensus tree of a Bayesian analysis. Branches supported with posterior probability ≥ 0·95 and bootstrap > 70 % are indicated in bold. ATR = atranorin, FUM = fumarprotocetraric acid, NST = norstictic acid, PSO = psoromic acid, RANG = rangiformic acid.
Table 2. Pairwise FST values for combined dataset among clades
Morphological and chemical results
A re-examination of morphological characters revealed differences among the clades found in the phylogenetic analysis of the DNA sequence data. Clade A includes specimens with squamules significantly shorter than those in clades B and D and thinner than in clade B (Tables 3, 4). These squamules can be entire or have incisions that reach up to 30% of the entire squamule length. When observed using SEM, the surface of the squamules is smooth in some specimens, while in others it shows fissures and small cells that commonly do not exceed 10 µm in diameter (Fig. 2A). In transverse sections the cortex is smooth, and two layers can be distinguished within the upper cortex (Fig 2B). The outer cortex does not stain in lactophenol cotton-blue, indicating that this layer consists of dead mycobiont hyphal cells (i.e. an epinecral layer). Specimens in clade B usually have cracked squamules, which are significantly longer and thicker than those of clade A (Table 4). Their surface appears nearly smooth in SEM images, but with wide, shallow fissures (Fig. 2C). The cortex in clade B is thick and homogeneous and lacks an epinecral layer (Fig. 2D). Clade C includes specimens with squamules similar in size to those of clade B. The surface of the squamules is rough, with shallow cracks, showing an areolate-verrucose surface (Fig. 2E), and the cortex is homogeneous, without an epinecral layer (Fig. 2F). Squamules in clade D are similar in size to those in clades B and C. The squamule surfaces are strongly fissured, usually showing small cells about 5 µm in diameter, similar to those in clade A (Fig. 2G). Transverse sections of the cortex show a similar anatomy to those in clades B and C, lacking a well differentiated epinecral layer (Fig. 2H).
Table 3. Variation (mean ± standard deviation) of morphological and anatomical characters of squamules in comparison with phylogenetic pattern

* significant P values (< 0·05).
Table 4. Tukey's multiple comparison test for significant results of the ANOVA analyses
ns = not significant.

Fig. 2. Cladonia cariosa group, anatomy of the primary thallus in the different clades. A, C, E & G, SEM micrographs of squamule surfaces; B, D, F & H, transverse sections of squamules; A & B, clade A (e = epinecral layer); C & D, clade B; E & F, clade C; G & H, clade D. Scales: A, C, E & G = 100 µm; B, D, F & H = 50 µm. In colour online.
Table 5 summarizes the chemical results. The most frequent chemotype in C. cariosa is the one which contains atranorin alone, present in 18 specimens. In C. symphycarpa the most common is the chemotype with atranorin and norstictic acid. This chemotype is also the most frequent in C. acuminata. The chemotype of C. cariosa containing atranorin and homosekikaic acid, and the chemotypes of C. symphycarpa containing stictic acid and bourgeanic acid were not found among the specimens examined. The distribution of the different chemotypes in the clades, resulting from phylogenetic analyses, is shown in Figure 1 (which also shows the secondary metabolites found in the outgroup). Each clade included samples of several chemotypes.
Table 5. Chemical variation found in the Cladonia specimens examined
ATR = atranorin, FUM = fumarprotocetraric acid, NST = norstictic acid, PSO = psoromic acid, RANG = rangiformic acid and ZEO = zeorin.
Discussion
The diversity in this group falls into four strongly supported monophyletic lineages. The results of the Fst value estimations show low gene flow among these clades and support the separation of the distinct clades in the group. The use of Fst values to assess the gene flow and genetic differentiation, and to test species boundaries, follows Porter (Reference Porter1990). This author's method, known as Hybrid Zone Barrier, is especially useful in the recognition of species that have recently diverged (Shaffer & Thomson Reference Shaffer and Thomson2007). Subsequently, the Fst value has been applied to species delimitation in different organisms (Milankov et al. Reference Milankov, Ståhls, Stamenković and Vujić2008; Korczynska et al. Reference Korczyńska, Gajwska, Pilot, Czechowski and Radchenko2010; Mendonça et al. Reference Mendonça, Oliveira, Burgess, Coelho, Piercy, Gadig and Foresti.2011), including lichenized fungi (O'Brien et al. Reference O'Brien, Miądlikowska and Lutzoni2009; Leavitt et al. Reference Leavitt, Johnson and St. Clair2011).
Following a genealogical concordance phylogenetic species recognition concept (Taylor et al. Reference Taylor, Jacobson, Kroken, Kasuga, Geiser, Hibbett and Fisher2000), four species should be distinguished in the C. cariosa group instead of the three currently accepted. These four lineages are also supported by subtle morphological differences, such as squamule size, thickness and surface of the squamules, and the cortex structure. These characters had previously been proposed by someauthors to delimit the species within this group. The length, breadth and thickness of the primary squamules were used by Thomson (Reference Taylor, Jacobson, Kroken, Kasuga, Geiser, Hibbett and Fisher1983) and Ahti (Reference Ahti2000) to distinguish C. cariosa from C. symphycarpa, and by Merrill (Reference Merrill1909) to distinguish C. subcariosa from C. symphycarpa. Ahti (Reference Ahti2000) and Ahti & Hammer (Reference Ahti, Hammer, Nash, Ryan, Gries and Bungartz2002) noticed that squamule surfaces of C. symphycarpa were papillose-maculate when squamules reached maturity. Based on these preliminary observations, we were encouraged to study the squamule surfaces in more detail. The SEM observations show the existence of some micro-morphological differences in the cortical surface of the different phylogenetic lineages that were previously unnoticed. The taxonomic value of the cortex surface was noted in Alectoria and Cornicularia (Hawksworth Reference Hawksworth1969) and in other Parmeliaceae (Hale Reference Hale1973). In contrast to subtle morphological characters, our study clearly demonstrates that presence or absence of secondary metabolites is of limited taxonomic value in the C. cariosa group, as previously suggested (Bültmann & Lünterbusch Reference Bültmann and Lünterbusch2008; Burgaz & Ahti Reference Burgaz and Ahti2009). A number of lineages include different chemotypes, and these chemotypes are largely shared among lineages. This is consistent with studies in some other groups of lichenized fungi, such as Bryoria in which the sections did not correlate with chemical characters (Myllys et al. Reference Myllys, Velmala, Holien, Halonen, Wang and Goward2011) or Xanthoparmelia, in which lineages consisted of different chemotypes (Leavitt et al. Reference Leavitt, Johnson and St. Clair2011).
Below, we attempt to clarify the identity of the clades found in our phylogenetic analyses, referring them to the current species and examining the appropriate type materials. Clade A contains specimens characterized by a small primary thallus (Table 2) and branched podetia, with many lengthwise fissures along them (Fig. 3A). As mentioned above, the chemistry of this clade is variable: atranorin only; atranorin and fumarprotocetraric acid; atranorin, fumarprotocetraric and rangiformic acids; and atranorin and rangiformic acid, but psoromic acid or norstictic acid are never present. The morphological characters of these specimens are similar to those of the Cladonia cariosa lectotype and we consider that this clade represents Cladonia cariosa s.str. Additional characters for this taxa have been found, such as the presence of a thick epinecral layer above the cortex in the primary thallus and a smooth or fissured surface (Fig. 2B).

Fig. 3. Morphology of Cladonia species studied. A, Cladonia cariosa (lectotype); B, C. cariosa s. lat. (MACB 93018); C, C. acuminata (T. Ahti 63278); D, C. symphycarpa (MACB 101124). Scales = 5 mm. In colour online.
The specimens within clade B have large squamules, often prostrate and cracked. The podetia (present only in two of the studied samples) are corticate, with areolate zones, and slightly fissured (Fig. 3D). The chemical variability of this clade includes: atranorin only; atranorin together with norstictic acid; atranorin and fumarprotocetraric acid; atranorin and psoromic acid. The morphology of these specimens is similar to the neotype of C. symphycarpa, and the four chemotypes described for C. symphycarpa (Huovinen et al. Reference Huovinen, Ahti and Stenroos1989) are present in this clade. We consider clade B as being C. symphycarpa s.str. Additional taxonomically useful anatomic characters have been found. The squamule surface is smooth in young parts, while in older zones (middle and inferior zone of the squamules) some wide, shallow fissures can be observed using SEM (Fig. 2C). The specimens containing psoromic acid do not form a monophyletic clade, which is consistent with a taxonomic concept that includes C. dahliana as a chemotype within C. symphycarpa.
Clade C included all specimens identified based on morphology as C. acuminata, supporting that this species is monophyletic. The specimens have large squamules and sorediate, mostly unbranched podetia, that can be rarely dichotomously branched near the tips (Fig. 3C), as already described for this species (Ahti Reference Ahti2000; Ahti & Hammer Reference Ahti, Hammer, Nash, Ryan, Gries and Bungartz2002). The three chemotypes found for this taxon are present in our sampling. The three C. acuminata chemotypes form a single monophyletic group. This clade includes specimens originating from North America with the three chemotypes, along with a European sample which contains atranorin and norstictic acid. Consequently, we interpret C. acuminans as a synonym of C. acuminata. Additionally, C. acuminata differs from the other species in the areolate-verrucose cortical surface (Fig. 2E). A specimen from Spain that only had a primary thallus is included in this clade. The squamules of this sample are morphologically and anatomically similar to those of the other samples in the clade. This specimen extends the range in Europe of C. acuminata, the southern limit of which in Europe was in Tyrol (Nimis Reference Nimis1993).
Clade D includes specimens with a primary thallus consisting of large squamules, similar in size to those of C. symphycarpa, but with podetia (Fig. 3B) similar to those of C. cariosa (with many fissures). Chemically this clade is also variable. It includes the following chemotypes: atranorin and norstictic acid; atranorin and psoromic acid; atranorin and fumarprotocetraric acid; and atranorin and zeorin. The specimens in this clade are an intermediate morphotype between C. cariosa and C. symphycarpa. This putative species has squamule surfaces that are strongly fissured (Fig. 2G) and lacking an epinecral layer. Furthermore, while the other species occur on calcareous substrata, these samples are found on acid substrata at an altitude above 1000 m. No taxonomic conclusion is made here concerning this clade because Vainio (Reference Vainio1887) described several taxa in the group and the type materials of these names need to be examined before taxonomic conclusions can be drawn.
One specimen (Cladonia symphycarpa sp.lat. 4) could not be assigned to any of the four major clades (Fig. 1) and may represent another species in the group. Additional studies including more samples of this group are needed to evaluate the taxonomic status of this specimen. In these future studies we will try to include more specimens andthe chemotype of C. cariosa, containing atranorin and homosekikaic acid that was described from North America and Greenland (Harris Reference Harris1975; Bültmann & Lünterbusch Reference Bültmann and Lünterbusch2008).
This study suggests that the C. cariosa group contains a greater number of species than was traditionally recognized, and that there are subtle morphological differences among them.
We are grateful to Professor Teuvo Ahti, who kindly sent us material of C. acuminata, and the curators of the herbaria B, BG, H, L, S and UPS for loans of specimens. Fátima Durán is thanked for technical help. The study was supported by the Spanish Ministry of Science and Technology (project CGL2007-66734-C03-01/BOS) and Universidad Complutense–Comunidad de Madrid (Research Group 910773). R. P-B was supported by a predoctoral grant from the Spanish Ministry of Education.
Appendix. The phylogenetic relationships of Cladonia subcariosa and C. latiloba with the C. cariosa group
A matrix of ITS rDNA with 102 sequences from species included in the supergroup Cladonia (Stenroos et al. Reference Stenroos, Hyvönen, Myllys, Thell and Ahti2002) was constructed to infer phylogenetic relationships of C. subcariosa and C. latiloba with the C. cariosa group. Maximum Parsimony and Bayesian analyses were performed. The Bayesian analysis was carried out using the GTG+I+G model (this model was selected in MrModeltest as the best-fitting evolutionary model using the AIC criterion). The posterior probabilities of each branch were calculated by counting the frequencies of trees that were visited during the course of the MCMC analysis. Model parameters were estimated in each analysis for 10 000 000 generations sampled in 4 simultaneous chains, and every 1000th was saved into a file. The initial 1000 trees were discarded as burn-in. Using the “sumt” command of MrBayes, the 50% majority-rule consensus tree was calculated from 18 000 trees sampled after reaching likelihood convergence to calculate the posterior probabilities of the tree nodes.
The matrix contained 587 characters, 186 of them parsimony informative. MP analyses generated 1000 equally parsimonious trees, 795 step long, CI = 0·4579, RI = 0·7810 and RC = 0·3576. The Bayesian analysis yielded a tree with a likelihood value of Ln = −5435·17. Cladonia subcariosa and C. latiloba are not closely related to the C. cariosa group (Fig. A1). Cladonia subcariosa appears to be closely related to C. caespiticia with high support, while the relationship of C. latiloba is not resolved.
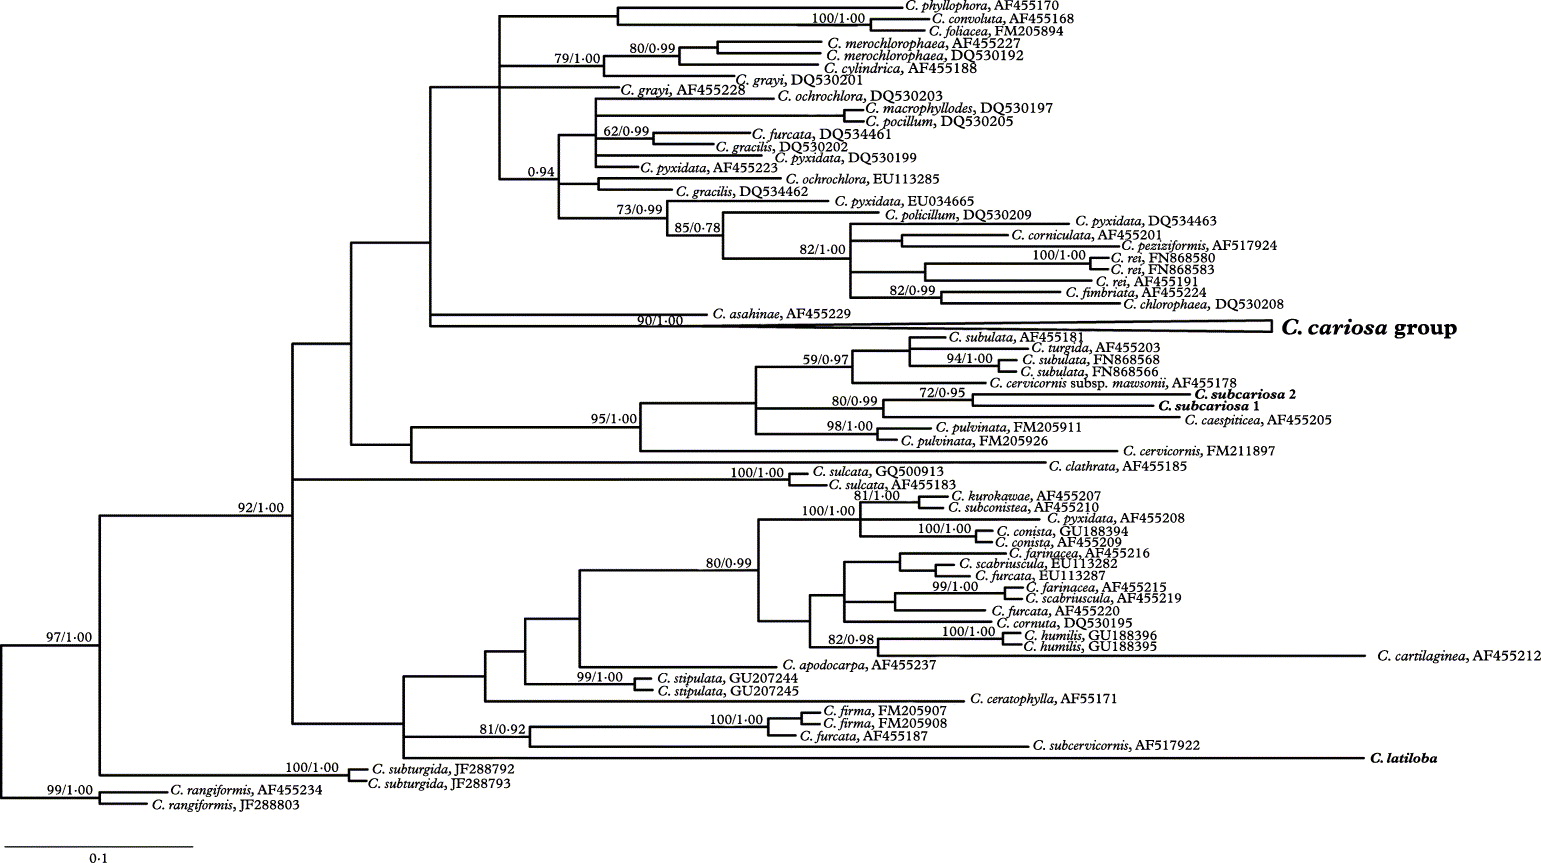
Fig. A1. Phylogenetic placement of Cladonia subcariosa and C. latiloba in the supergroup Cladonia. The 50% majority-rule consensus tree from a Bayesian analysis based on ITS rDNA. The boostrap values of MP analysis and posterior probability of Bayesian analysis are indicated on the branches.


