


Studies show evidence for the key role of self-regulation in health and in successful academics, work or other employment (De la Fuente & Eissa, Reference De la Fuente and Eissa2010; Karoly, Boekaerts, & Maes, Reference Karoly, Boekaerts and Maes2005). However, the theory of self-regulation presents conceptual differences in the different spheres where it is used: education, health, work and organizations (Karoly et al., Reference Karoly, Boekaerts and Maes2005). Researchers are interested in the processes and characteristics of self-regulation that are common across the domains and spheres of psychology. Zimmerman (Reference Zimmerman1998), analyzed aspects of self-regulation common to writers, athletes, musicians and expert students. Years later, Karoly et al. (Reference Karoly, Boekaerts and Maes2005) reviewed studies from the main areas of applied psychology (the areas of work and organizations, health and education). They concluded that there are conceptual and methodological differences, but they defended the existence of a “metatheoretical convergence” (Karoly et al., Reference Karoly, Boekaerts and Maes2005, p. 301), where they highlighted the common components of self-regulation across these areas: goal selection, goal setting, feedback sensitivity, discrepancy (error) monitoring, self-evaluative judgment, self-corrective instrumental action and the emergence of efficacy beliefs.
Based on the theory proposed by Kanfer (Reference Kanfer, Neuringer and Michael1970), self-regulation is a set of learned strategies that can be grouped into three stages: self-observation, self-assessment and self-reinforcement. Finding support in this theory, Miller and Brown (Reference Miller, Brown, Heather, Miller and Greely1991) seek for a better explanation for change in addictions. Brown (1998, p. 62) defines self-regulation as one’s “capacity to plan, guide and monitor one’s behavior flexibly in the face of changing circumstances”. Self-regulation as studied by these authors refers to general self-regulation of behavior. Brown, Miller, and Lawendowski (Reference Brown, Miller, Lawendowski, Vandecreek and Jackson1999) designed the Self-Regulation Questionnaire (SRQ), composed of 63 items, to assess the seven dimensions of self-regulation proposed by Miller and Brown (Reference Miller, Brown, Heather, Miller and Greely1991). Later on, other authors’ analyses of the psychometric properties revealed different factor solutions at universities in the United States (Carey, Neal, & Collins, Reference Carey, Neal and Collins2004; Neal & Carey, Reference Neal and Carey2005) and in South Africa (Potgieter & Botha, Reference Potgieter and Botha2009). Carey et al. (Reference Carey, Neal and Collins2004) showed a single factor solution (31 items) that allowed these authors to propose a short version of the SRQ. The new version, Short Self-Regulation Questionnaire (SSRQ) was also subjected to evaluation by Neal and Carey (Reference Neal and Carey2005), and by Potgieter and Botha (Reference Potgieter and Botha2009). In the first study, the psychometric characteristics of the SSRQ showed a two-factor solution of 21 items: impulse control and goal setting. Potgieter and Botha (Reference Potgieter and Botha2009) studied both the psychometric properties of the SSRQ in 385 students at the North-West University (in South Africa), and the relationship between self-regulation and the psychology of well-being. They obtained a factor solution with seven factors: Monitoring, Decision Making, Learning from Mistakes, Mindful Awareness, Perseverance, Creativity, and Self-Evaluation. Item selection was based more on theoretical than on statistical reasons, thus, two items (16 and 25) from the self-evaluation factor showed greater saturation in the decision making factor. Internal consistency was acceptable for all factors except self-evaluation and creativity.
Brown et al. (Reference Brown, Miller, Lawendowski, Vandecreek and Jackson1999) constructed a questionnaire that measures self-regulation as described in this theoretical model (Miller & Brown, Reference Miller, Brown, Heather, Miller and Greely1991). The instrument has been used mainly in relation to substance use (Carey et al., Reference Carey, Neal and Collins2004; Neal & Carey, Reference Neal and Carey2005; Reference Neal and Carey2007), but it has also been used in a variety of life domains: psychological well-being (Potgieter & Botha, Reference Potgieter and Botha2009), dispositional happiness (Okun, Levy, Karoly, & Ruehlman, Reference Okun, Levy, Karoly and Ruehlman2009), depressive symptoms (Kogan & Brody, Reference Kogan and Brody2010) and career adaptability (Creed, Fallon, & Hood, Reference Creed, Fallon and Hood2009; Yousefi, Abedi, Baghban, Eatemadi, & Abedi, Reference Yousefi, Abedi, Baghban, Eatemadi and Abedi2011). Similarly, the instrument is used in education (De la Fuente, Sánchez, & Roda, Reference De la Fuente, Sanchez and Roda2009; Potgieter & Botha, Reference Potgieter and Botha2009). The psychometric characteristics of the instrument have been studied on several occasions (Carey et al., Reference Carey, Neal and Collins2004; Neal & Carey, Reference Neal and Carey2005; Potgieter & Botha, Reference Potgieter and Botha2009). Nonetheless, there is still a need for studies that analyze its factor structure on more diverse samples (Neal & Carey, Reference Neal and Carey2005).
Studies have shown that a contribution of self-regulation, as studied in the psychology of health, is also found in different areas of psychology. For example, Creed et al. (Reference Creed, Fallon and Hood2009) showed a significant contribution from Miller and Brown’s self-regulation in the self-regulation model proposed by Savickas in 1997 for career adaptability. Nevertheless, there is not much research on the relation between general self-regulation of behavior and academic performance. This study takes place in an academic context, and is interested in general self-regulation of behavior (SR), referring to the ability to change an expected behavior in daily life, for example, to quit smoking or to lose weight (Miller & Brown, Reference Miller, Brown, Heather, Miller and Greely1991). In addition, we analyze self-regulation specific to learning (SRL), defined as a student’s activity geared toward planning and managing of time and effort throughout an academic subject (De la Fuente, Justicia, & Berbén, Reference De la Fuente, Justicia, Berbén, Justicia, Fernández and Pichardo2007).
In the past years, research has shown that academic performance is related to self-control, in other words, to the ability to inhibit a dominant, maladaptive response in order to execute an adaptive subdominant response (Duckworth & Kern, Reference Duckworth and Kern2011). “Self-control is a quintessential feature of self-regulatory behavior” (de Ridder, Lensvelt-Mulders, Finkenauer, Stock, & Baumeister, Reference de Ridder, Lensvelt-Mulders, Finkenauer, Stock and Baumeister2012, p. 77). Duckworth and colleagues examined the effects of self-control and IQ on secondary students’ academic performance. They concluded that self-control had a bigger effect on academic performance than did intellectual talent (Duckworth & Seligman, Reference Duckworth and Seligman2005), and that self-control predicted changes in report card grades over time better than IQ (Duckworth, Quinn, & Tsukayama, Reference Duckworth, Quinn and Tsukayama2012).
Based on prior evidence, we examined the relation between SR (Miller & Brown, Reference Miller, Brown, Heather, Miller and Greely1991) and SRL (De la Fuente et al., Reference De la Fuente, Zapata, Martínez-Vicente, Cardelle-Elawar, Sander, Justicia and Berbén2012), and between SR and grades (Duckworth & Seligman, Reference Duckworth and Seligman2005; Okun et al., Reference Okun, Levy, Karoly and Ruehlman2009). The purpose of this study was to examine the extent to which the Spanish Self-Regulation Questionnaire assesses the same factors as the original from of the questionnaire (Brown et al., Reference Brown, Miller, Lawendowski, Vandecreek and Jackson1999) and to construct the short version of the SRQ. Based on analysis of the SRQ, we predicted that the SRQ in the Spanish context would confirm the two-factor structure of the SSRQ (Neal & Carey, Reference Neal and Carey2005). Finally, we predicted that SR (Miller & Brown, Reference Miller, Brown, Heather, Miller and Greely1991) would show both internal consistency and be related to SRL and the student’s grade.
Method
Participants
A total of 834 students participated in the study, from the universities of Almería (49.5%; n = 413) and Granada (50.5%; n = 421) in southern Spain. The mean age of participants was 22.05 (SD = 4.01) with an age range from 17 to 48 years. Participants were female (86%; n = 717) and male (14%; n = 117) and were enrolled in subjects from the Department of Developmental & Educational Psychology. The participants were students of Psychology (33.3%; n = 278), Education (43.4%; n = 362) and School Psychology (23.3%; n = 194).
The complete sample was randomly divided for confirmatory factor analysis into two samples: an exploratory sample (n = 417) and a confirmatory sample (n = 417). Finally, it should be noted that the analyses pertaining to correlations (self-regulated learning and the student’s grade) used a lower number of participants than the total. 81.17% (n = 677) of students obtained a grade for their class subject, and only 58.76% (n = 490) of the participants completed the two instruments used in this study.
Instruments
Data was collected using two instruments and the reports of students’ final grades. Grade reports show participants’ performance for a semester-long subject, and can range from 0.1 to 10; zero is a lost value (did not attend class). The instruments were the Spanish version (De la Fuente, Reference De la Fuente2003) of the Self-Regulation Questionnaire (SRQ, Brown et al., Reference Brown, Miller, Lawendowski, Vandecreek and Jackson1999), and Scale 6 from the Scales for Interactive Assessment of the Teaching-Learning Process, student version (IATLP scale 6, De la Fuente et al., Reference De la Fuente, Zapata, Martínez-Vicente, Cardelle-Elawar, Sander, Justicia and Berbén2012).
The SRQ measures seven dimensions of SR: (a) informational input, (b) self-monitoring current progress toward a personal goal, (c) motivation for change, (d) commitment to reach the change goal, (e) development of a plan to reach the personal goal, (f) work according to the plan, and (g) re-evaluation of the plan. Each dimension is composed of 9 items, making up a total of 63 items scored on a Likert-type scale from 1 to 5 (1 = strongly disagree and 5 = strongly agree). Items are worded in both a negative and positive direction, with results being inverted for analysis (Brown et al., Reference Brown, Miller, Lawendowski, Vandecreek and Jackson1999).
For the assessment of SRL, the IATLP Scale 6 (De la Fuente et al., Reference De la Fuente, Zapata, Martínez-Vicente, Cardelle-Elawar, Sander, Justicia and Berbén2012) was used, which is composed of 16 items that are grouped into three elements that make up SRL: planning (6 items, e.g., “Before beginning any learning activity or task, I organize what I have to do, telling myself: ‘first I have to do this, then I have to do that’…”), thoughtful learning (5 items, e.g., “When learning, I like to relate it to my own experience and my life”) and study techniques (5 items, e.g., “I usually make notations when learning new material”). Participants respond to the items on a Likert scale from 1 (strongly disagree) to 5 (strongly agree). Initial analyses of IATLP Scale 6 showed a factor structure with adequate fit indices GFI = .912; AGFI = .881; CFI = .913; SRMR = .071; RMSEA = .060; 90% CI of RMSEA = .052–.069) and adequate internal consistency (IATLP Scale 6: α = .87; planning: α = .82; thoughtful learning: α = .82; study techniques: α = .79).
Procedure and Data Analyses
A variety of statistical techniques were required in order to meet study objectives. First, we analyzed the data fit to the proposed models with the exploratory sample and we used structural equation modelling (SEM). Second, after finding a poor fit to the proposed models, two exploratory factor analyses were performed following the procedure common to prior studies (Carey et al., Reference Carey, Neal and Collins2004; Neal & Carey, Reference Neal and Carey2005; Potgieter & Botha, Reference Potgieter and Botha2009): principal component analysis with promax rotation of the 63 and 18 items of the SRQ for factor extraction, eigenvalues (greater than one) and scree plot for factor selection and loading value (greater than .40) per item. In selecting both factors and items, we took into account the theoretical assumptions of self-regulation (Miller & Brown, Reference Miller, Brown, Heather, Miller and Greely1991) at all times. Later, the resulting factor models were subjected to confirmatory factor analysis with the exploratory sample, and finally, the fit to the resulting model was analyzed with the confirmatory sample.
This study used first order confirmatory factor analysis. The multivariate normality study showed distancing from normal in all confirmatory models (Mardia’s coefficient ranged from 442.65 in the original model to 41.55 for the SSRQ with Spanish sample). Consequently, we used maximum likelihood estimation of confirmatory models with Satorra-Bentler robust corrections on standard and statistical errors and fit index (Hu & Bentler, Reference Hu, Bentler and Hoyle1995). Specifically, the indices used to evaluate model fit were the CFI, GFI and AGFI, which indicated good fit with values of .9 or greater; error quantity was measured with the RMSEA, including 90% CI and the SRMR, these being acceptable for values less than .08. In addition, the AIC was used to compare the models (Kaplan, Reference Kaplan2000).
A hierarchical multiple regression analysis was carried out in order to determine how much SR contributes to SRL, on one hand, and to the final grade, on the other. To improve linearity between predictors and the outcome variable, and also to increase normality (Cohen, Cohen, West, & Aiken, Reference Cohen, Cohen, West and Aiken2003), the outliers were eliminated (n = 444) and we used the Tau34-squared test: a normality test based on L-skew and L-kurtosis and an elliptical rejection region on an L-moment ratio diagram (Harri & Coble, Reference Harri and Coble2011). For internal consistency, Cronbach’s alpha was calculated for each factor. Finally, correlations were carried out between the total scores on the original SRQ (63 items) and the short SRQ for Spanish samples.
Results
Analysis of the internal structure of the proposed models
The confirmatory factor analysis of the original model of the SRQ revealed a lack of data fit. The single dimension model (SSRQ, 31 items) also showed poor fit. Of the three American models, the one that showed best fit was the two-dimensional structure of 21 items. Finally, the seven-factor model and 28 items in the South African context required a modification in order to meet analysis requirements (Hu & Bentler, Reference Hu, Bentler and Hoyle1995); it was necessary to eliminate the seventh factor since it contained only two items shared by two factors. In the end, the confirmatory factor analysis was done with six factors and 24 items (Table 1).
Table 1. Goodness of fit for the factorial models proposed in the different versions of the SRQ

Note: Original = Brown et al. (Reference Brown, Miller, Lawendowski, Vandecreek and Jackson1999); 31 items = Carey et al. (Reference Carey, Neal and Collins2004); 21 items = Neal and Carey (Reference Neal and Carey2005); 24 items = Potgieter and Botha (Reference Potgieter and Botha2009); all Chi-square tests significant at p < .001.
Internal structure of the SSRQ with a Spanish sample
Exploratory analysis of the questionnaire in the Spanish context was done with the “exploratory sample” (Table 2). The principal components method, with Kaiser criteria, extracted 18 factors that explain 59.98% of the variance. Examination of the scree plot revealed an abbreviated structure of three factors (eigenvalues: 9.74, 4.48, 2.48). The factorial structure of the short SRQ, extracted from the exploratory analysis of the 63 items, is composed of three factors and 18 items (all of them with loading greater than .40). A new factor analysis of the SSRQ (18 items) showed a factor loading different from the initial one: the items loaded in four factors that explained 53.84% of the total variance, and item 3 loaded below .40.
Table 2. Assumptions for data factorization

Note: All Chi-square tests significant at p < .001.
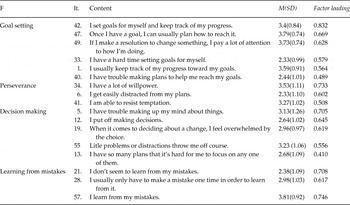
In summary, the model proposed for the short SRQ in a Spanish sample is composed of 17 items and four factors: Goal setting, Perseverance, Decision Making and Learning from Mistakes (Table 3), where these also have a theoretical foundation. The factors used in the model correspond with those proposed by the authors in previous studies. The factor Learning from Mistakes is parallels Neal and Carey’s scale (2005) called Impulse Control. Potgieter and Botha (Reference Potgieter and Botha2009) also extract the factor Learning from Mistakes in the same terms proposed here, as well as the factors of Goal Setting (Latham & Locke, Reference Latham and Locke1991; Neal & Carey Reference Neal and Carey2005); Perseverance, and Decision Making (Potgieter & Botha, Reference Potgieter and Botha2009).
Table 3. Factor (F); original numbering and content of the 18 items from exploratory analysis including: Mean (M), Standard deviation (SD), and factor loadings
Confirmation of the short SRQ model was performed at the item level by reducing the number of items and factors that were most independent from each other. The four-factor model and 17 items were evaluated using the exploratory sample (ES). Although the indices and statistics showed a good fit (Table 4), we proceeded to establish a relation between the errors of items 33 and 40 because they were written in a negative sense. Later, the modified model was analyzed using the exploratory sample (ESm); both the fit indices and statistics show that the modified model fits better than the initial one.
Table 4. Goodness of fit for the Spanish Short Self-Regulation Questionnaire (SSSRQ) model

Note: All the chi-square tests significant at p < .001; ES = exploratory sample; CS = confirmation sample; m = modifications in the model.
Finally, the modified model was evaluated using the confirmation sample. Results were satisfactory (Table 4), with indices greater than .90 and errors around .05. Likewise, the AIC showed a value in the modified model using the confirmation sample than in the initial model with the exploratory sample.
Internal consistency, and relation between versions of the SRQ, self-regulated learning and grades
Internal consistency was acceptable for the total of questionnaire items (α = .86) and for the factors: Goal Setting (α = .79), Decision Making (α = .72) and Learning from Mistakes (α = .72). However, the Perseverance factor (α = .63) showed low consistency. Finally, correlations between the original version and the version evaluated with a Spanish sample were r = .85, p < .001 for the short version.
A study of the relations between SR, SRL and the grade received for a class subject was carried out with the total sample. Results showed that SR is significantly related to SRL (r = .40, p < .01) and to grade (r = .15, p < .01).
On the other hand, a hierarchical multiple regression analysis was carried out for two dependent variables: Self-regulated learning in one case, and grade in the other. In both regression equations the factors of the SSRQ were included as predictors. The regression analysis with grade showed no contribution from SSRQ factors. When the dependent variable was self-regulated learning, the SSRQ in a Spanish sample [R 2 = .198, F(4, 439) = 28.363, p < .001] did contribute to self-regulated learning. However, only two factors contributed significantly in the models: Goal Setting and Learning from Mistakes (Table 5).
Table 5. Hierarchical Regression Models for Predicting Self-regulated Learning (n = 444)

Note: GS: Goal setting; DM: Decision Making; LM: Learning from Mistakes; P: Perseverance; *p < .001.
Discussion
Results from this study show differences between the proposed models, with both the original SRQ (Brown et al., Reference Brown, Miller, Lawendowski, Vandecreek and Jackson1999) and with the short version (Carey et al., Reference Carey, Neal and Collins2004; Neal & Carey, Reference Neal and Carey2005; Potgieter & Botha, Reference Potgieter and Botha2009). Consequently, the main hypothesis of this study is rejected; however, certain similarities with previous studies are found, and the resulting models with a Spanish sample are theoretically consistent.
The short version of the SRQ with a Spanish sample (the Spanish Short Self-regulation Questionnaire, SSSRQ) has proven to be a plausible alternative to the complete version. Data reflect good fit to the structure of 17 items grouped into four factors (Goal setting, Perseverance, Decision Making and Learning from Mistakes), where these are theoretically supported to the same extent as the factors from the complete version. The resulting internal structure is not shared with the North American studies (Carey et al., Reference Carey, Neal and Collins2004; Neal & Carey, Reference Neal and Carey2005); however, the fit and error indices of the 31-item version, with a Spanish sample, are better than in the study by Neal and Carey (Reference Neal and Carey2005). Even so, the South African structure (Potgieter & Botha, Reference Potgieter and Botha2009) is the most similar: It is the model that best fits the Spanish sample, and that has the most similarities between factors. One explanation of these concurrences may be that both cultures share a collectivistic context (Kanfer, Reference Kanfer, Neuringer and Michael1970; Potgieter & Botha, Reference Potgieter and Botha2009). There is also a high percentage of women in the two studies; in the Spanish sample, this results from the greater proportion of women that pursue the degree programs analyzed here (Grañeras, Boix, Savall, & Vaillo, Reference Grañeras, Boix, Savall and Vaillo2009).
The SSSRQ possesses good internal consistency, being equal to that obtained by Neal and Carey (Reference Neal and Carey2005). Factor reliability was slightly less than for Neal and Carey’s factors (2005) and similar to Potgieter and Botha’s factors (2009); in general, factor consistency values were acceptable. Finally, the high correlation between the short SRQ and the original SRQ also supports the utility of the short version.
The short version helps predict self-regulated learning, but not grades. As proposed by the DEDEPRO Model (for more information, see De la Fuente & Justicia, Reference De la Fuente and Justicia2007), it may be that there is a direct effect of SR on SRL, and an indirect effect on grades, in other words, SRL may be a modulatory variable between SR and Grades. Unlike studies that show that self-control (Duckworth & Seligman, Reference Duckworth and Seligman2005; Duckworth et al., Reference Duckworth, Quinn and Tsukayama2012) or SRL (Boekaerts, Pintrich, & Zeidner, Reference Boekaerts, Pintrich and Zeidner2000; De la Fuente & Eissa, Reference De la Fuente and Eissa2010; Zimmerman & Schunk, Reference Zimmerman and Schunk1989) has an impact on academic performance, the SSSRQ did not contribute toward explaining grades. Notwithstanding, some SR factors contributed to SRL, such as Goal setting and Learning from Mistakes. These results can offer evidence for the “metatheoretical convergence” of the study of SR in different spheres as proposed by Karoly et al. (2005, p. 301). After reviewing studies from the main areas of applied psychology (the areas of work and organizations, health and education), they concluded that there were conceptual and methodological differences, but defended the existence of a metatheoretical convergence, where they highlighted the common components of self-regulation across these areas: goal selection, goal setting, feedback sensitivity, discrepancy (error) monitoring, self-evaluative judgment, self-corrective instrumental action and the emergence of efficacy beliefs. Along these lines, SR measured by the SSSRQ contributes to the explanation of SRL (Goal setting and Learning from Mistakes), while remaining different from it (Grades), since this type of self-regulation is more closely connected to daily life than to the academic context.
In summary, the SSSRQ shows good internal consistency and is a plausible alternative to the complete version in Spanish context (reliability and validity), although other studies must confirm these findings and then generalize them to other spheres. Furthermore, caution is advised because of study limitations, especially those referring to the low variability of the sample: The study analyzes only university students from Granada and Almeria, from the schools of Education and Psychology (with an imbalance between men and women), and does not use a sampling method that allows generalization of results. Finally, one must take into account the limitations from using exclusively self-report questionnaires, and consider other methods of assessment in future studies (Torrano & González, Reference Torrano and González2004; Zimmerman, Reference Zimmerman2008).
This research was partially supported by grants from the Spanish Ministerio de Innovación, Ciencia y Tecnológía and the Spanish Ministerio de Ciencia e Innovación. References: BSO2003–064494, SEJ2007–66843 and EDU2011–24805.


