

Income Measurement in Cross-National Surveys
The comparability of responses in cross-national surveys has triggered significant methodological debates (King et al. Reference King, Murray, Salomon and Tandon2004; Stegmueller Reference Stegmueller2011). In this article, we address a question that should at least in theory be more easily comparable across different cultural contexts: household income. Income is a key explanatory variable for many prominent theoretical questions in political behavior (ranging from economic voting to post-materialist values) and represents a standard demographic control variable for most other analyses. Most theoretical approaches in comparative politics assume that income matters, that it shapes interests, values, ideologies, or capabilities.
Unfortunately, because of inconsistencies in how the questions are administered and coded, responses to household income questions are often not meaningfully comparable across different countries and time periods. While in the conclusion, we show that these problems also affect several other widely used cross-national surveys, we here focus primarily on the World Values Survey (WVS), an important source for cross-national public opinion analyses.Footnote 1 First, we document some of the inconsistencies in how household income was measured across surveys. Second, we discuss the implications of these measurement choices cross-national survey analyses and illustrate some of the ways in which the variable has been improperly used and interpreted in previous studies. In the final section, we propose three alternative cross-nationally comparable income measures, describe the methodological approaches for calculating them, and explain how scholars can use our data to conduct more empirically sound tests of their theories. A few researchers have noted measurement and coverage problems with the WVS income variable (Layard, Mayraz and Nickell Reference Layard, Nickell and Mayraz2008) and others have opted not to use the WVS income question at all and have instead relied either on alternative individual-level survey questions like social class to capture relative income (Andersen and Fetner Reference Andersen and Fetner2008) or on country-level gross domestic product (GDP)/capita to capture cross-country income differences (Pop-Eleches and Tucker Reference Pop-Eleches and Tucker2012). However, none of the critiques have focused on the problem posed by uneven distributions of income scales across countries and, more importantly, none have provided a systematic solution to facilitate the valid analysis and meaningful interpretation of the cross-country effects of household income.
The WVS income question is administered in three forms. The standard approach, which is similar to other surveys, including the International Social Survey Programme (ISSP), the European Social Survey (ESS), and the Eurobarometer, is to give respondents a showcard with ten income brackets, each labeled with a letter, and to ask them to place themselves in one of the brackets.Footnote 2 The income brackets (in the local currency) are defined by the country’s principal investigators (PIs), and are intended to represent the deciles of the household income distribution. This approach was followed and the values of the bracket cut-points are available for 152 of the 245 surveys included in the cumulative file of the five-wave WVS. The top right panel of Figure 1 shows a typical result from this approach. Egyptian respondents from the 2000 survey are spread across all the income brackets, and while none of the categories match 10 percent exactly and at least two of them are significantly different, most come close. The flaws could be caused by poor sampling, poor response rates, or a misspecification of the income brackets.Footnote 3
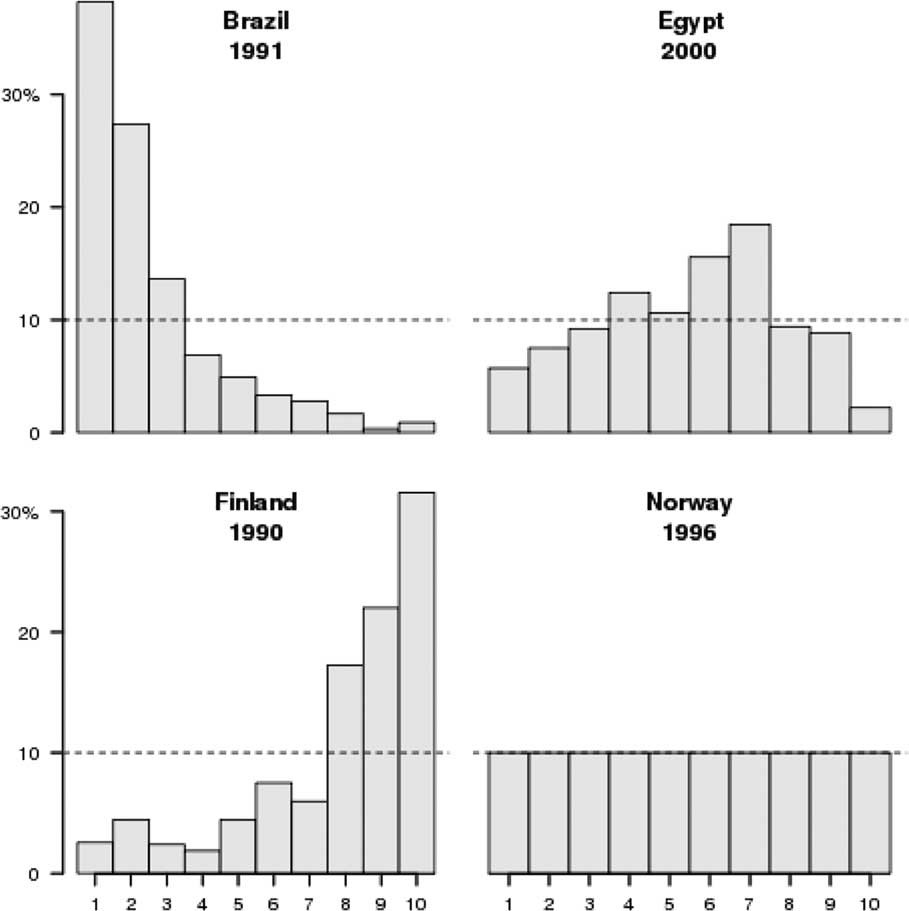
Fig. 1 Weighted distribution of incomes in four World Values Survey
The second approach (used in Norway in 1996 and Romania in 2005) is to ask respondents to write in their household income, and to recode this into brackets later.Footnote 4 The bottom right panel in Figure 1 shows the resulting income distribution in one such survey.
The third approach asks respondents to rank their household’s income on a scale from 1 to 10 but without providing specific income bands.Footnote 5 Despite the similarity in question wording, this approach yields a measure with a very different interpretation, since it taps subjective rather than objective income assessments. Given these fundamental differences, we argue that the income measures from these surveysFootnote 6 should not be merged into a unified WVS income measure but rather treated as a separate subjective income indicator.Footnote 7 Besides the use of subjective incomes and the lack of documentation for some country-waves, there is a substantial problem with many surveys that asked the income question in the standard format. While the PIs were instructed to choose brackets that correspond to income deciles, it appears that some organizers used other criteria for choosing brackets or relied on faulty (perhaps outdated) income distribution data. Therefore, as illustrated by the Brazilian and Finnish survey in Figure 1, income distributions often deviate substantially from the deciles envisioned by the WVS research design.
Analytical Challenges
The 10-point income scale reported by WVS cannot be interpreted as a straightforward indicator of household income in a cross-national regression context for several reasons. First, to the extent that we are interested in cross-national comparisons of income levels, the 10-point scale corresponds to very different income intervals in different countries: thus, a US citizen in category 4 has a significantly higher income than a Moldovan respondent with the same rating on the 10-point WVS income scale. Nor do these problems disappear in fixed-effects models given that an income shift from 2 to 4 in the United States corresponds to a much greater increase in household income than a corresponding shift in Moldova.
Even among countries with similar income levels the differences between categories is likely to be affected by differences in income inequality. To draw meaningful inferences about income levels, we would need to either restrict our analysis to a single country or to countries with very similar income levels and income distributionsFootnote 8 or—better yet—transform the survey-specific income intervals into a common cross-nationally and cross-temporally comparable income scale (as proposed in the following section). The choice of scale—relative or absolute, logged or otherwise transformed—should be theory driven.
Even if we are interested in the effects of a respondent’s income relative to her compatriots, the interpretation of the WVS income measure is not straightforward. Most studies have used the original WVS 10-point scale as a continuous measure and have interpreted it as capturing income deciles (Mishler and Rose Reference Mishler and Rose2001; Beramendi and Anderson Reference Beramendi and Anderson2008; Inglehart et al. Reference Inglehart, Foa, Peterson and Welzel2008). Some analysts have collapsed deciles into quintiles (Solt Reference Solt2008) or have used a three-category income measure which combines varying combinations of the 10-point income scale into low- middle-, and high-income groups approximating terciles (Alesina and Giuliano Reference Alesina and Giuliano2009; Donnelly and Lefkofridi Reference Donnelly and Lefkofridi2014).Footnote 9 The problem with this interpretation is illustrated most starkly by the income distribution from the Brazilian and Finnish surveys in Figure 1: a respondent in the fifth income category is relatively well off in the Brazil 1990 survey (88.6 percentile) but rather poor in the Finland 1991 survey (13.5 percentile). Even for less extreme examples many of the income categories do not come close to capturing actual deciles, which means that even for fixed-effects models a one-unit change is not a meaningful metric across surveys. Indeed, we find that the vast majority of WVS do not have the uniform distribution necessary to interpret them as deciles: running a set of weighted χ 2 tests, we failed to reject the null that the income scale is uniform—that is, that the categories represent deciles and respondents are sampled randomly from the population—in only seven of the 241 surveys in the WVS cumulative file.Footnote 10
While this problem could be addressed by using the 10-point scale to calculate the cumulative distribution of incomes in a given survey and thereby determine the relative position of respondents in their country’s income distribution, only one of the studies we surveyed used this approach.Footnote 11 Such an approach is useful for analyzing how relative income affects attitudes and behavior—for example, with respect to redistribution—but it is less useful for capturing the impact of overall income differentials. To address the challenges inherent in the multiple interpretations of income, in the next section we provide a menu of options to allow researchers to choose the most appropriate approach for testing their particular theory.
Solutions
Our first step toward creating cross-nationally comparable income measures is to select country-waves where documentation on income brackets is complete. This is the case in 137 of the 241 surveys of the first five waves of the WVS. Using International Monetary Fund (IMF) data on exchange rates, purchasing power parity (PPP) conversion factors, and inflation, we calculate the value of each bracket cut-point for every country-wave. After assigning the first nine categories their respective midpoints and assigning those in the tenth category (whose upper bound is infinite) a value based on the size of the ninth category and the value of the lower bound of the tenth,Footnote 12 we can assign a PPP (or exchange rate) income in 2005 US dollars. To test the plausibility of our calculations, we estimated the PPP and exchange rate average household incomes for each country-wave, divided by an estimate of the average household size, and compared it with GDP/capita as measured by the World Bank. Figure 2 shows that while our measurements are not the same as those calculated from aggregate economic data, they are closely related. Since household monetary income ignore business and in-kind benefits, it is unsurprising that the points generally fall below the 45° line. We have also calculated the correlations between the Gini index based on our data and Solt’s (Reference Solt2009) measure and between economic growth between successive rounds as calculated from our data and that of the IMF. These correlations, while weaker, remain reasonably strong (0.74 and 0.45, respectively).

Fig. 2 Relationship between GDP/capita and the per capita household income in the World Values Survey Note: PPP=purchasing power parity.
To calculate income levels for surveys where data on income brackets was not available in the WVS documentation, we devised an imputation approach that uses the empirical cumulative distribution, per capita GDP, and income inequality data to generate estimates of the income of individuals at a particular point in the income distribution.
The inequality data from the World Development Indicators (World Bank 2011) consist of estimates of the share of national income held by the top and bottom deciles and each of the quintiles. This provides us with an approximation of the cumulative distribution of income in those country-years. We can then map an estimate of the individual’s place in the income distribution (based on a weighted ranking of the sample) onto a PPP income distribution. Our technique requires minimizing the distance between the distribution implied by the WDI income shares and a lognormalFootnote 13 distribution by manipulating the lognormal distribution’s location and scale parameters. We do this by calculating
 $$\left( {{\rm }\mu ^{{\rm {\asterisk}}} ,{\rm }\sigma ^{{\rm {\asterisk}}} } \right){\equals}\mathop{{{\rm argmin}}}\limits_{{\mu ,\sigma }} \sqrt {\mathop \sum\limits_{i{\equals}1}^6 \left( {q_{i} {\minus}{\rm }F^{{{\minus}1}} (p_{i} ,{\rm }\mu ,{\rm }\sigma )} \right)^{2} } ,$$
where q is a vector of the six percentiles for which the income shares are available from the WDI (10, 20, 40, 60, 80, 90), p a vector of those corresponding cumulative probabilities, and F −1 the inverse cumulative distribution function (CDF) of the lognormal distribution.Footnote 14 We then use the distribution that minimizes this function—that is, the lognormal “shape” that best fits the WDI data—to calculate incomes corresponding to each percentile and divide the country’s per capita GDP by the mean of the implied distribution to give the factor by which the income should be multiplied to estimate the true incomes of individuals at every percentile.
The parameters of the lognormal resulting from Expression (1) allow us to map from any given income percentile to an estimated income by inflating the value of the distribution corresponding to each percentile by a factor defined by the following:
 $${{GDPpc_{{cy}} } \over {\mu ^{{\asterisk}} {\plus} {\raise0.7ex\hbox{${\sigma ^{{{\asterisk}2}} }$} \!\mathord{\left/ {\vphantom {{\sigma ^{{{\asterisk}2}} } 2}}\right.\kern-\nulldelimiterspace}\!\lower0.7ex\hbox{$2$}}}},$$
where the denominator is the standard formula for the mean of a lognormal distribution, and the numerator is GDP/capita of country c in year y.Footnote 15
After imputing estimates for the income of individuals at 11 points in the income distribution, we calculate the ratio between the imputed and actual income for all surveys where income brackets were included in the WVS documentation. We then regress this ratio on a set of country dummies and several country characteristics (such as household size, GDP/capita, and income inequality) and the particular percentile being estimated.Footnote 16 We use those regressions to predict the same ratios in those country-waves for which brackets are missing. In other words, we use information from the survey-based income measure, the lognormal income measure, and macroeconomic data to estimate the survey-based income measure for surveys in which the income categories are unknown.
From these regressions, we obtain income-level predictions for all of the country-waves in our data set, and assign the appropriate income level (in 2005 PPP US$) to each survey respondent.
The individual-level correlation between our imputed income measure and the survey-based income (for respondents from surveys where we have the WVS documentation on the income bands) is 0.918. This correlation is generally stronger within country-waves, dropping below 0.9 in only one survey (Malta, Wave 1). It is also strong within each band on the 10-point scale, ranging from 0.82 to 0.89. We consider this a sufficiently strong relationship to justify using the imputed measure for many applications.
Using the Data
To facilitate the appropriate use of World Values income data, we provide, in the online appendix, a data file containing information on the income measure for each country-wave. This information includes a mapping from the original income codes to the PPP-adjusted income levels as measured from the survey and a similar mapping for the distribution-based incomes. We also provide income percentiles and ratios corresponding to each income code. Users will be able to merge these data into the WVS and include any of these measures in their analyses. We suggest that users carefully consider which measure best tests their theory, using percentiles when the focus is on a respondent’s rank in society, ratios when the relative magnitudes of income matter, and levels when the absolute differences between respondents are of concern.
Conclusion
In this article, we have identified several factors that limit the interpretability of the household income measure in the WVS, one of the largest and most widely used set of cross-national and cross-temporal public opinion surveys. The problems include the inconsistent implementation of the income question, and the large variations in the shares of respondents in the ten categories of the WVS income scale, which questions the validity of its widespread interpretation as representing income deciles. Therefore, we have argued that a valid cross-national and cross-temporal analysis of the effects of income on political attitudes using WVS data requires the creation of a new set of variables that allow for meaningful comparison across countries and time periods, and we have proposed and implemented three alternative income measures that capture different facets of income differences: levels, ratios, and percentiles.
These challenges are not unique to the WVS. Designing income categories is difficult, especially in a cross-national setting. Thus, many of the most widely used cross-national surveys have at least some cases where income variables deviate significantly from the uniform distributions that would be necessary to interpret them straightforwardly as interval scales. For instance, the ESS’s sixth round (2012–2013) in Ireland uses carefully documented categories, adjusted for inflation, yet they produce the distribution displayed in Figure 3. It shows an undoubtedly skewed distribution, which cannot be interpreted meaningfully as capturing deciles. We found similarly non-uniform income distributions in other cross-national surveys with income scales designed to capture deciles, as in the ISSP and the Candidate Countries Eurobarometer, or quintiles, as in the Comparative Study of Electoral Systems.Footnote 17

Fig. 3 Examples of income distributions from different cross-national surveys Note: ESS=European Social Survey; ISSP=International Social Survey Programme; CSES=Comparative Study of Electoral Systems; CCEB=Candidate Countries Eurobarometer.
All of this suggests is that users of cross-national surveys should carefully check their income measures and use the techniques we describe (or an alternative solution) to adjust the data such that it is consistent and substantively meaningful across countries and/or time periods. The alternatives—using questions about social class, financial satisfaction, or possession of major consumer products—will be useful in some cases, but will prevent scholars from testing some of the key questions in comparative politics.
The choice between the three versions of the household income measure proposed in this article—or for that matter of variations of these solutions (e.g. non-logged versions of absolute income) —needs to be driven primarily by the particular theoretical question to be tested. For example, percentiles are most appropriate for analyzing the effects of an individual’s relative position on her country’s socioeconomic ladder, while ratios also incorporate the magnitude of the income differences within a given survey, and levels further capture absolute differences across time and space, and are thus more relevant for scholars interested in the broader cross-national differences in household incomes. Clearly, the broad comparative scope of the income-level measure also means that its use requires the acceptance of the broader set of assumptions that we had to make in order to construct this measure.
Acknowledgement
The authors gratefully acknowledge useful comments Chris Achen, Michael Becher, Bryn Rosenfeld, Fred Solt. They also thank seminar participants at Princeton University, the European University Institute, and the University of Iowa, as well as three anonymous reviewers. Finally, Jaime Diez-Medrano, Ron Inglehart, and the Principal Investigators from many of the World Values Survey participating organizations offered help with the documentation.


