I. INTRODUCTION
We have recently proposed a method to remove CuKα 2 and CuKβ peaks and step structure caused by NiK-absorption edge in the powder diffraction data measured with a system equipped with a Cu-target X-ray source and a Ni filter (Ida et al., Reference Ida, Ono, Hattan, Yoshida, Takatsu and Nomura2018a), by extending application of a previously proposed deconvolution method (Ida and Toraya, Reference Ida and Toraya2002). The method is based on deconvolution of a realistic spectroscopic profile model of the source X-ray and convolution of simplified CuKα 1 profile model on the appropriately transformed scale (χ = ln sinθ). When the method was applied to the powder diffraction data of standard LaB6 powder (NIST SRM660a), the observed structures caused by CuKα 2 and CuKβ emissions and NiK-edge absorption have certainly been removed.
However, it has been found that some unidentified small peaks still remain in the LaB6 data after the deconvolution–convolution treatment. We have also found that similar unidentified peaks appear in the powder diffraction data of standard Si powder (NIST SRM640c). The small unidentified peaks are more pronounced in the Si data, because the main diffraction peaks of Si for CuKα emission are sparser and the intensities of the unidentified peaks are stronger than in the LaB6 data set.
In this study, we have investigated the patterns of the appearance of the unidentified small peaks, and propose a method to remove those peaks by a method based on a deconvolution–convolution treatment.
II. ANALYSIS OF EXPERIMENTAL DATA
A. Experimental and data processing
Powder diffraction data of standard LaB6 (NIST SRM660a) and Si (NIST SRM640c) powder were collected with a powder diffraction measurement system (PANalytical, X'Pert PRO MPD) of θ–θ type goniometer equipped with a micro-focus Cu-target sealed tube (PANalytical EMPYREAN TUBE, Type 9430-033-7310) with the effective focal width of W S = 0.04 mm operated at 45 kV and 40 mA, and a one-dimensional Si strip detector (PANalytical X'Celerator) at the distance of R = 240 mm from the rotation axis of the goniometer.
Fixed-angle divergence slit of 0.5° and a couple of Soller slits with the open angle of 0.04 rad were used. A Ni foil of 0.02 mm in thickness, used as a Kβ filter, was inserted into the diffracted beam path at the distance of about 227 mm from the rotation axis of the goniometer. The one-dimensional powder diffraction intensity data were created by an automatic measurement/data processing program (PANalytical, Data Collector) from the integration of five iterations of continuous scans for the diffraction angles ranging from 10 to 145° with the nominal step interval of 0.0167° and nominal measurement time of 10.16 s per step. Further details about the experimental conditions are described elsewhere (Ida et al., Reference Ida, Ono, Hattan, Yoshida, Takatsu and Nomura2018a, Reference Ida, Ono, Hattan, Yoshida, Takatsu and Nomurab).
The observed data are processed by a whole-pattern deconvolution–convolution treatment for the removal of CuKα 2 and CuKβ peaks and NiK-edge structures, and for correction of the peak shift and asymmetric deformation of peak profile caused by the instrumental aberrations (Ida et al., Reference Ida, Ono, Hattan, Yoshida, Takatsu and Nomura2018a, Reference Ida, Ono, Hattan, Yoshida, Takatsu and Nomurab).
B. Analysis of Si (SRM640c) data
1. Characterization of unidentified peaks
Figures 1–3 plot the background profile of observed and deconvolution–convolution treated diffraction intensity data (DCT data) around the locations of Si 111, 220 and 311 reflections, respectively, for CuKα emission. The CuKα 2 peaks observed in the source data have effectively been removed in the DCT data, as demonstrated in our previous paper (Ida et al., Reference Ida, Ono, Hattan, Yoshida, Takatsu and Nomura2018a). The peak locations calculated for CuKα 1, CuKβ, NiK-edge, NiKβ, NiKα 1, NiKα 2, WLα 1, WLα 2, WLβ 1 and WLβ 2 are indicated by arrows on the top margins of the graphs. The photon energy and wavelength assumed in the calculation are listed in Table I. The locations of unidentified small peaks are also marked by vertical arrows labeled by (a), (b), (c), and (d) in Figures 1–3.
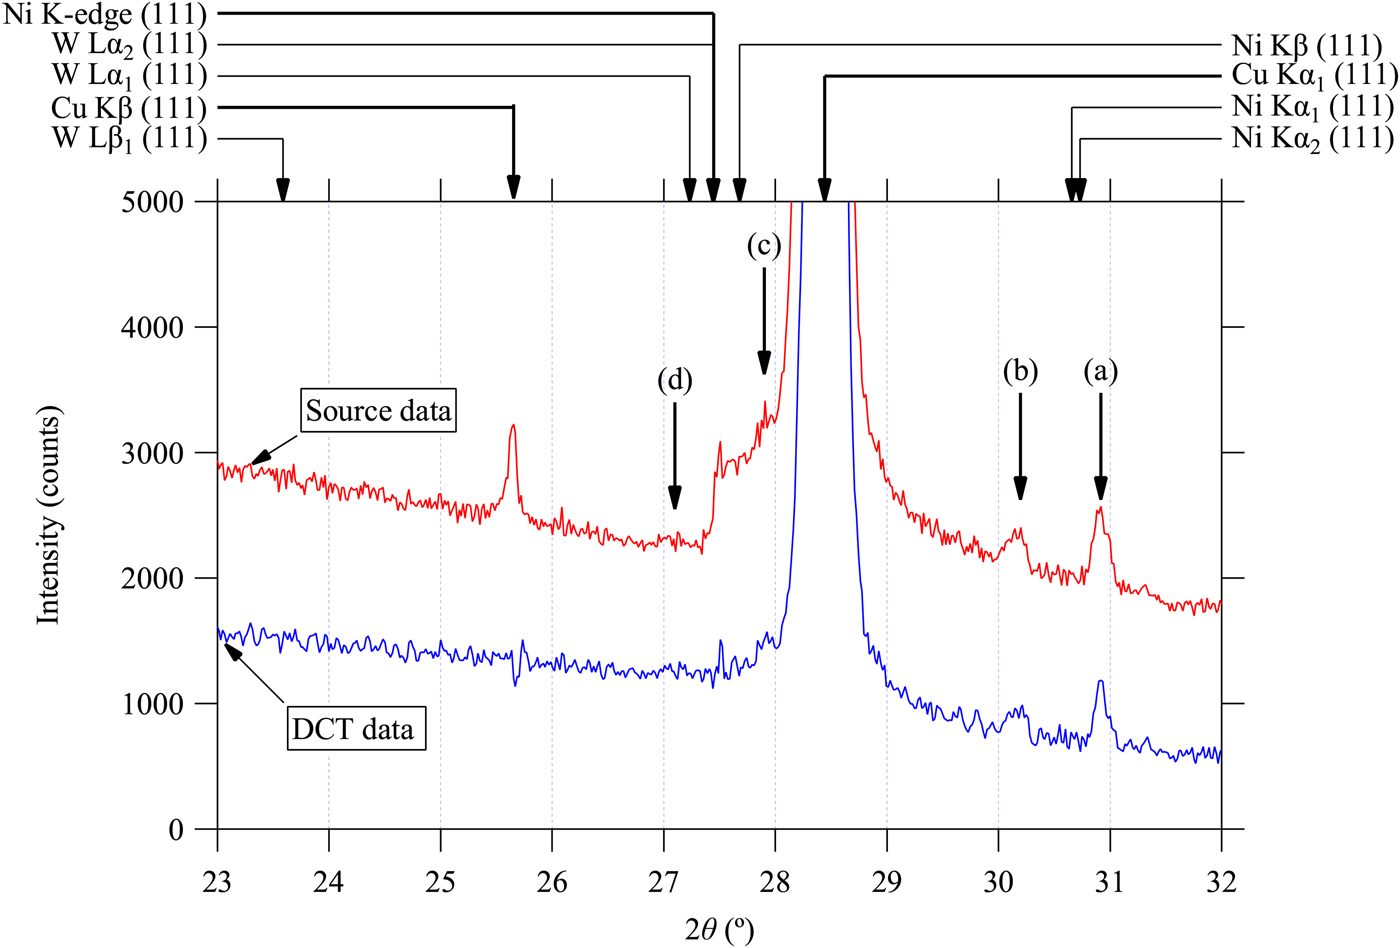
Figure 1. (Color online) Observed powder diffraction data of Si powder (SRM640c) around the 111-reflection and the data processed by a deconvolution–convolution treatment for the removal of CuKα 2, CuKβ peaks and NiK-edge structure, peak shift and asymmetric deformation caused by instrumental aberrations (Ida et al., Reference Ida, Ono, Hattan, Yoshida, Takatsu and Nomura2018a, Reference Ida, Ono, Hattan, Yoshida, Takatsu and Nomurab). Peak positions calculated by the Bragg's law are marked by arrows on the top margin. A thick or thin arrow indicates that the corresponding structure is detected in the observed intensity data or not. The locations of unidentified small peaks (a), (b), (c), and (d) are also marked by arrows.
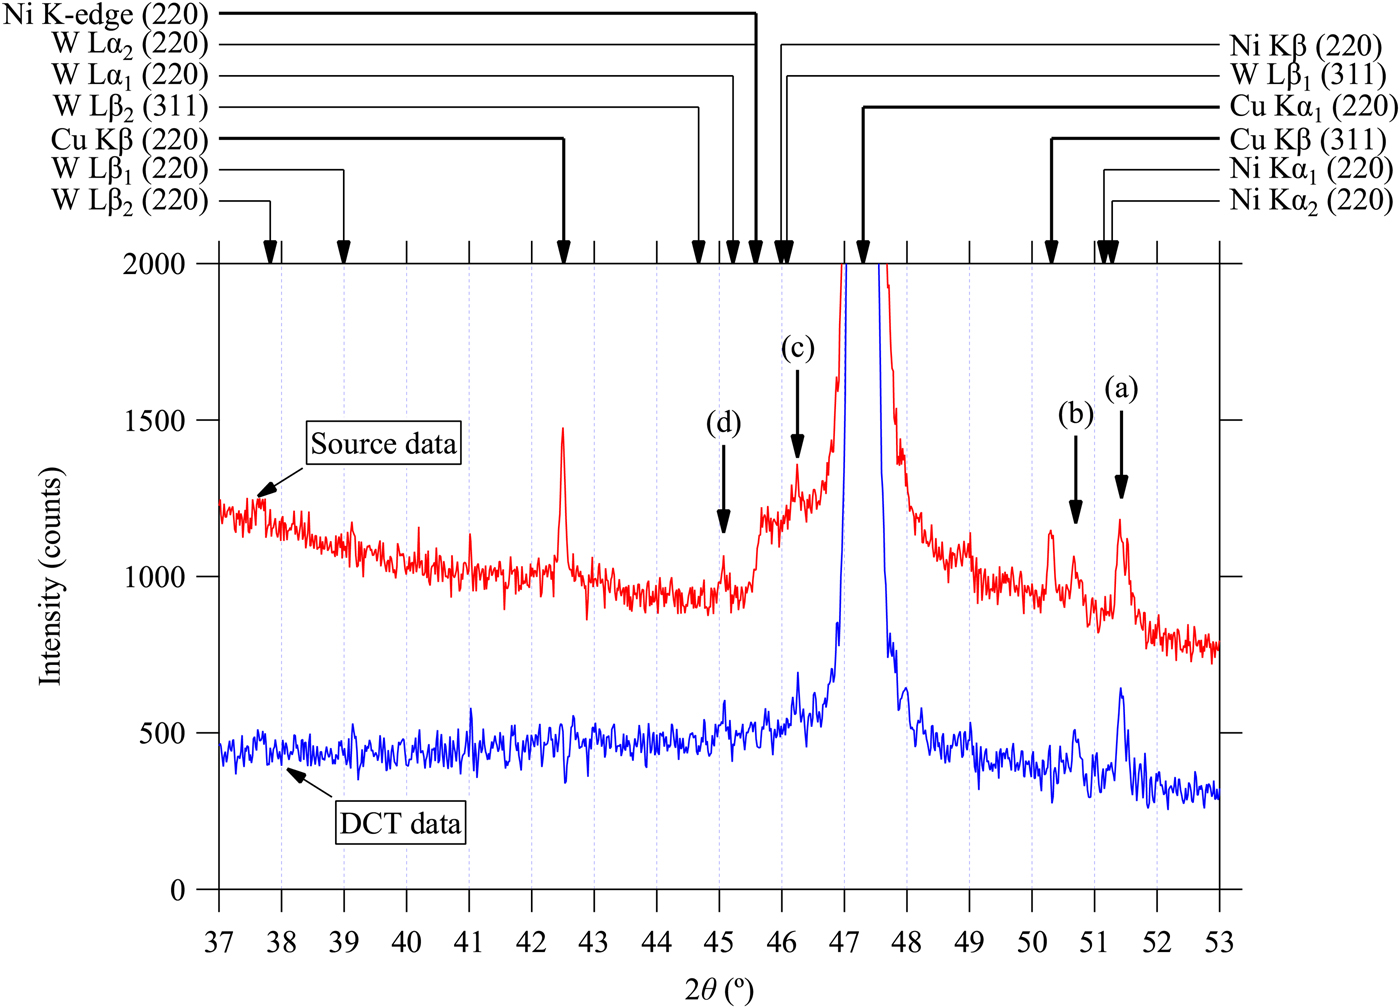
Figure 2. (Color online) Observed powder diffraction data of Si powder (SRM640c) around the 220-reflection and the data processed by a deconvolution–convolution treatment. See the caption of Figure 1 for further details.

Figure 3. (Color online) Observed powder diffraction data of Si powder (SRM640c) around the 311-reflection and the data processed by a deconvolution–convolution treatment. See the caption of Figure 1 for further details.
Table I. Photon energy (E) and wavelength (λ) assumed on the calculation of peak positions in Figures 1–3. The values of the natural logarithm of the relative wavelength to that of CuKα 1, given by ε* = ln(λ/λCu Kα1) are listed on the last column.

The locations and relative intensities of the unidentified peaks (a)–(d) are in accordance with the main peaks of CuKα 1 111, 220, and 311-reflections. It indicates that they are originated from the diffractions of Si for X-ray photons with energies different from that of CuKα 1 emission. It is likely that emissions from Wehnelt electrode or contamination of tungsten sputtered from the cathode filament onto the Cu anode plate in the sealed X-ray tube may be the sources of those parasite peaks. The observed locations of the peaks (a), (b), and (c) are clearly deviated from the calculated peak positions, as can be seen in Figures 1–3.
The values of nominal wavelength calculated from the peak locations of CuKα 1 and parasite peaks (a)–(d) assigned to Si 111, 220, and 311-reflections by the following equation are plotted in Figure 4.
 $$\lambda {\rm ^{\prime}} = \displaystyle{{2a\sin \theta _{{\rm obs}}} \over {\sqrt {h^2 + k^2 + l^2}}} \;, $$
where a is the lattice constant of Si, we here assume to be 5.431195 Å, (h, k, l) the index of reflection, and 2θ obs the observed locations of the parasite peaks (a)–(d). The error bars in Figure 4 are drawn for the error of 0.01° on the estimation of peak location, which should be comparable to the possible errors except the position of the weak and possibly broadened parasite peak (d) assigned to Si 111-reflection. The variation of the calculated values of the nominal wavelength are clearly larger than the error bars for the peaks (a)–(c), while the values calculated from the locations of CuKα 1 and (d) peaks show small deviations. It is concluded that the apparent locations of the peaks (a)–(c) do not satisfy the Bragg's law, while no clear deviation is detected for peak (d).

Figure 4. Nominal wavelength calculated by the Bragg's law from Si 111, 220, and 311-peak positions for CuKα 1 and parasite peaks (a), (b), (c), and (d).
2. Modeling the locations of parasite peaks
Even if the locations of the parasite peaks (a)–(c) do not satisfy the Bragg's law, they could still be removed by the whole-pattern deconvolution method, if such an artificial scale transform of abscissa is available that makes the separation of the parasite and the corresponding main CuKα 1 peaks constant.
We here examine the following formula of scale transform,
 $$\chi = \ln (\beta + \sin \theta ),$$
where β is an adjustable parameter. If the separation of one of the parasite peaks and the main CuKα 1 peak is given by a constant ε on the scale of χ, the peak locations of the parasite peak 2θ obs are connected with the corresponding CuKα 1 peak locations 2θ CuKα1 by the following equations,
 $$2\theta _{{\rm obs}} = 2\sin ^{ - 1} [\exp (\chi _{{\rm obs}} ) - \beta ],$$
 $$\chi _{{\rm obs}} = \chi _{{\rm Cu}K\alpha 1} + \varepsilon, $$
 $$\chi _{{\rm Cu}K\alpha 1} = \ln (\beta + \sin \theta _{{\rm Cu}K\alpha 1} ).$$
The results of fitting of the above formula to the observed peak positions of type (a) series of 111, 220, 311-parasite peaks are shown in Figure 5. The two adjustable parameters are optimized to be β = 0.026 and ε = 0.0736 for the type (a) parasite peaks. The optimized values of β and ε for type (b)–(d) peaks are listed in Table II.

Table II. Parameters to remove parasite peaks, peak location parameters β and ε, relative intensity parameter ρ, and broadening parameter w.

All the parameters are dimensionless.
3. Removal of parasite peaks by multiple deconvolution
It is assumed that the profile of a parasite peak is expressed by the convolution of the Lorentzian profile with the main CuKα 1 peak profile on the transformed scale. The function f P(χ) to be deconvolved for removal of the parasite peaks is then expressed by
 $$f_{\rm P} (\chi ) = \delta (\chi ) + \rho f_{\rm L} (\chi - \varepsilon ;w),$$
 $$f_{\rm L} (x;w) = \displaystyle{2 \over {\pi w}}\left( {1 + \displaystyle{{4x^2} \over {w^2}}} \right)^{ - 1}, $$
where δ(x) is the Dirac delta function, ρ the relative intensity of the parasite peak, and w the full width at half maximum of the Lorentzian component.
The Fourier transform of the function f P(χ) is simply given by
 $$F_{\rm P} (\xi ) \equiv \int \limits_{ - \infty} ^\infty f_{\rm P} (\chi )e^{2\pi {\rm i}\xi \chi} d\chi = 1 + \rho e^{ - \pi w\left \vert \xi \right \vert + 2\pi {\rm i}\varepsilon \xi}. $$
Since the computation time for the deconvolution–convolution treatment applying the fast Fourier transform algorithm is quite short, the values of relative intensity ρ and broadening w have manually been adjusted in a try-and-error way for each of the parasite peaks in this study. It will be necessary to provide a method to adjust the relative intensity parameter of the parasite peaks ρ in practical use, because the parameter ρ should be dependent on the history of the operation of an X-ray tube, even though it may be treated as an instrumental constant as well as the parameters β, ε, and w in the daily usage. The values of the parameters to provide an acceptable result for the diffraction data of Si powder, shown in Figure 6, are listed in Table II.
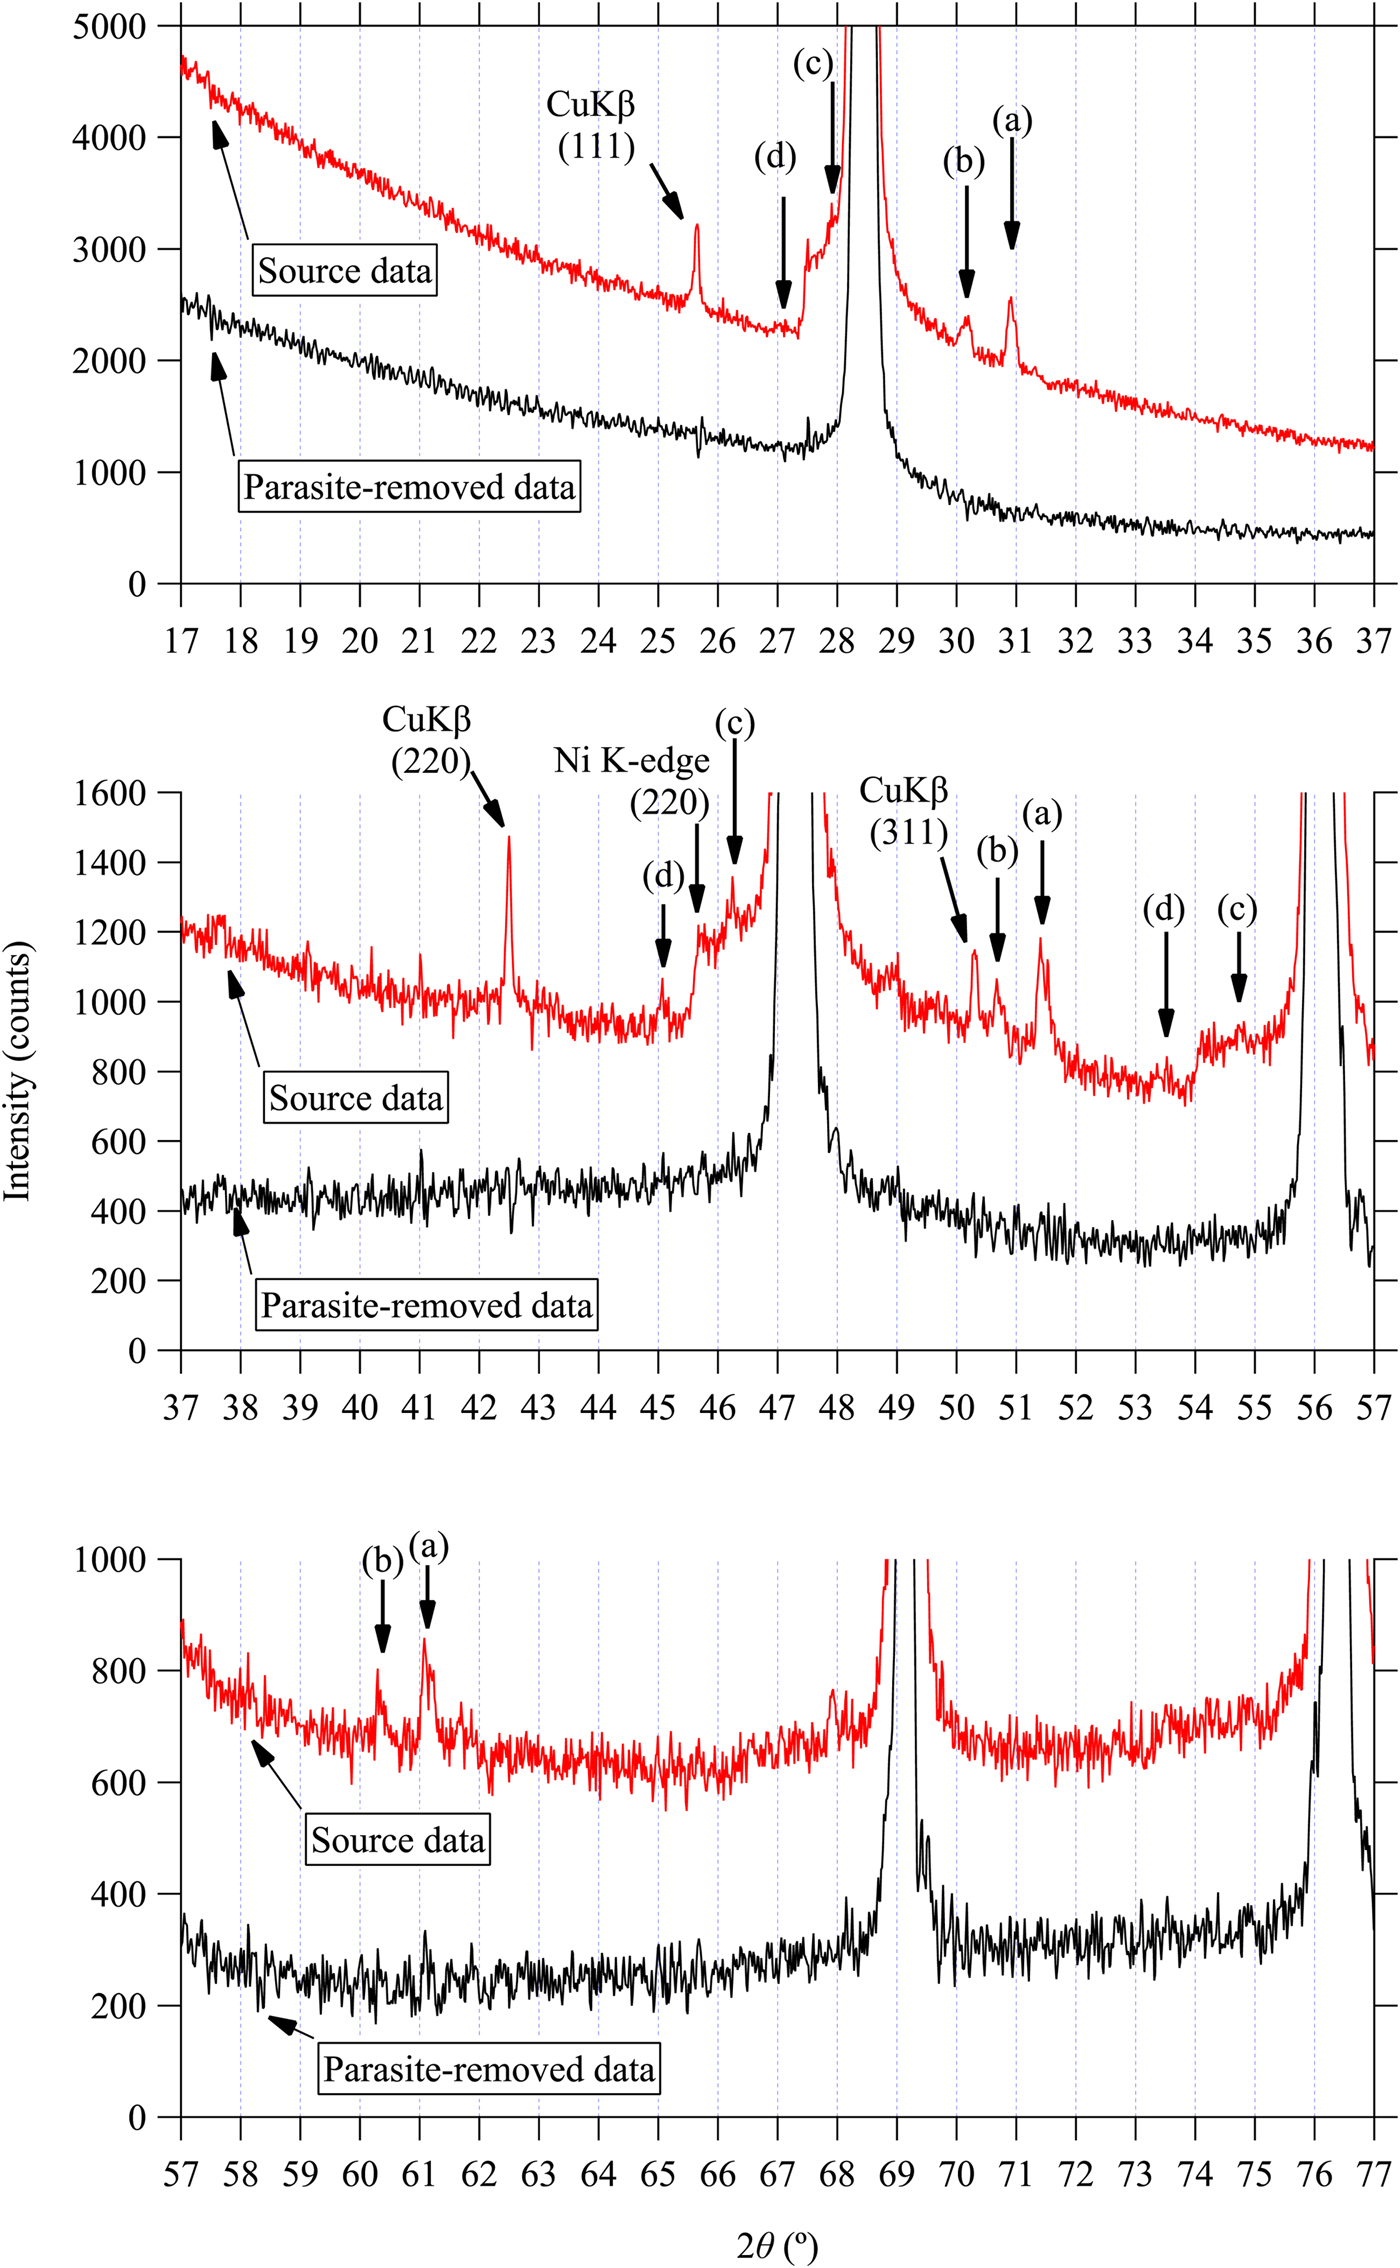
Figure 6. (Color online) Observed powder diffraction data of Si powder (SRM640c) and the data treated by the deconvolution–convolution method [Ida et al., submitted (1), (2)] and the multiple deconvolution for removal of parasite peaks. Upper, middle, and lower panels display the data in the 2θ ranges shown in Figures 1–3, respectively.
The values of the logarithm of relative wavelength to that of CuKα 1, given by ε* = ln(λ/λ Cu Kα1) are listed on the last column of Table I. The values of ε optimized to remove type (a) and (b) peaks, 0.0736 and 0.0751, are close to the values of ε* calculated for NiKα 1 and NiKα 2 emissions, which are estimated at 0.07342 and 0.07573, respectively. The values of relative intensity ρ to remove the parasite peaks (a) and (b), 0.0030 and 0.0015, respectively, may also appear to suggest that the parasite peaks (a) and (b) may be corresponded to Kα 1 and Kα 2 emissions, the intensity ratio of which should be about 2:1, but we here label them as Kα(a) and Kα(b), because it is more likely that the deviations of the peak positions are caused by the difference in the locations of the radiant points in the X-ray tube. It is not definitive, but the profile of type (a) parasite peak for Si 311-reflection shown in Figure 3 suggests that it is composed of two peaks of 2:1 intensity ratio, and the separation is close to that of the expected NiKα 1 and NiKα 2 emissions.
Although we have not found any definite theoretical basis to justify that the parameter ε in the formula in Eqs. (3)–(5) could be corresponded to the value of ε* at this moment, but this assumption will clearly make the adjustment of parameters easier.
The value of ε optimized at −0.0261 for the peak (c) is also close to the value ε* = −0.02659 for NiKβ emission, while the apparent peak positions are slightly deviated from the locations predicted by the Bragg's law as can be seen in Figures 1–3. The parasite peak (c) is then naturally assigned to the diffraction for NiKβ emission.
Finally, the value of ε estimated at −0.0455 for the peak (d) is close to the value ε* = −0.04254 for WLα 1 emission. Smaller absolute value of the shift parameter β = 0.008 for the parasite peak (d) than those of other parasite peaks (a)–(c) supports that the location of the radiant point of this emission is close to the face of the Cu target, and it can be assigned to a normal Bragg reflection of Si for WLα 1 emission. The parameters β and ε may be fixed to β = 0 and ε* = −0.04254, respectively, or included in the spectroscopic profile model in the deconvolution–convolution process (Ida et al., Reference Ida, Ono, Hattan, Yoshida, Takatsu and Nomura2018a). Tungsten Lα 2 line should also be emitted from the same X-ray tube, even though the theoretical intensity ratio of Lα 1:Lα 2 is 9:1 (Allison and Armstrong, Reference Allison and Armstrong1925). Since the peak location of WLα 2 emission is close to the NiK-absorption edge, it is not clear whether the diffraction for WLα 2 emission should be taken into account, but it looks negligible in the current observed data.
C. Application of the method to LaB6 (SRM660a) data
The whole-pattern deconvolution–convolution (Ida et al., Reference Ida, Ono, Hattan, Yoshida, Takatsu and Nomura2018a, Reference Ida, Ono, Hattan, Yoshida, Takatsu and Nomurab) and the method described in II.B.3 with the parameters listed in Table I are applied to the powder diffraction data of LaB6 (NIST SRM660a) measured under the same experimental conditions as the Si (NIST SRM640c) sample. Figures 7–9 show the results of the treatment. All the parasite peak positions assigned to the diffraction of LaB6 for CuKα 1 and CuKβ emissions, NiK-absorption edge, WKα 1, NiKα (a), NiKα (b), and NiKβ emissions are marked by arrows in Figures 7–9. Note that we can now correctly predict the locations of the diffraction peaks of LaB6 for NiKα (a), NiKα (b), and NiKβ emissions from Eqs. (3)–(5) and parameters in Table I. As can be seen in Figures 7–9, most of the predicted parasite peaks are certainly detectable in the observed source data, while none of them can clearly be detected in the data treated by the current method intended for the removal of parasite peaks.
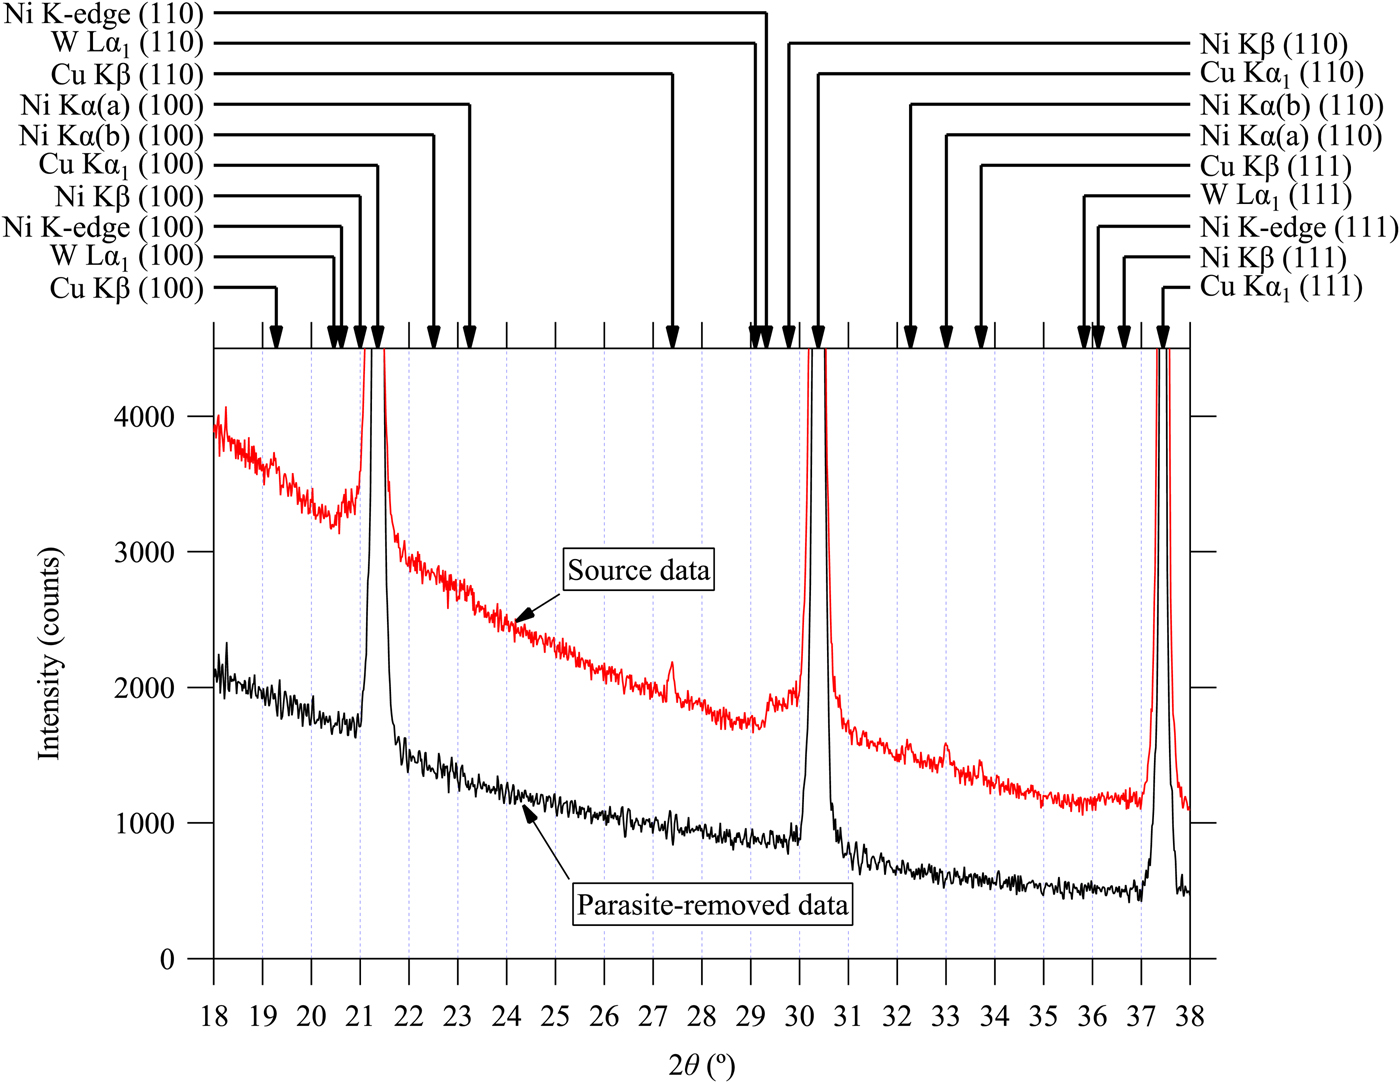
Figure 7. (Color online) Observed powder diffraction data of LaB6 powder (SRM660a) and the data treated by multiple deconvolution for the removal of parasite peaks in the 2θ range from 18 to 38°. The arrows on the top margin indicate the diffraction peak positions of LaB6 predicted by the formula proposed in the current study. Note that predicted NiKα (a), NiKα (b), and NiKβ peak positions are different from those calculated by the Bragg's law.
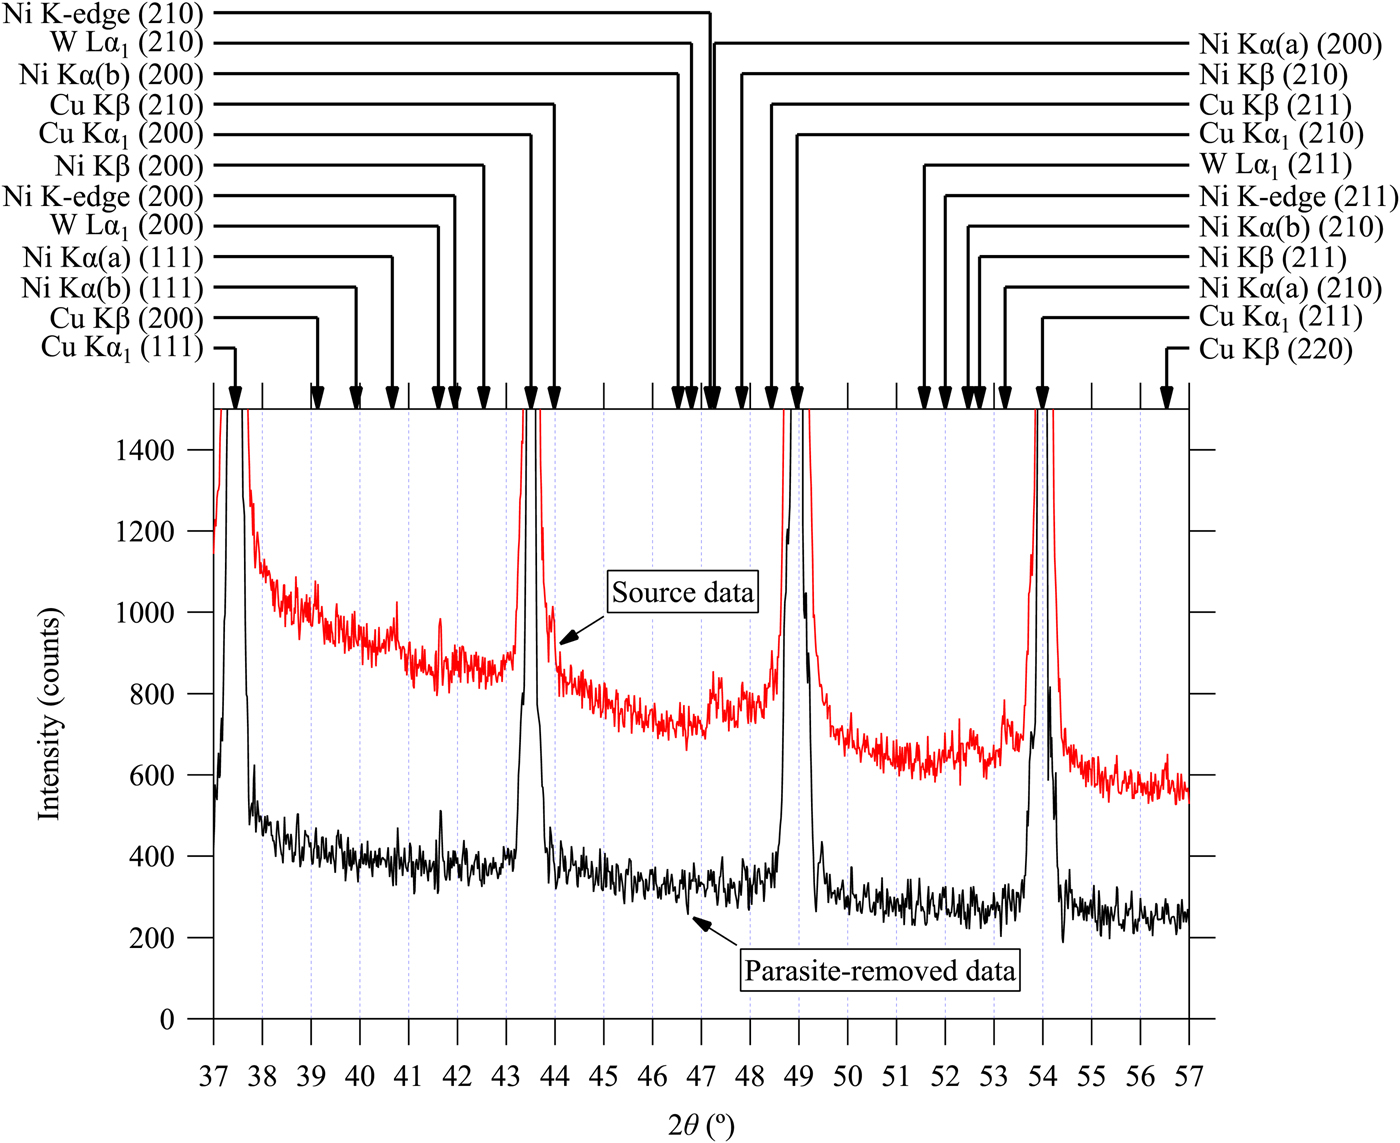
Figure 8. (Color online) Observed powder diffraction data of LaB6 powder (SRM660a) and the data treated by multiple deconvolution of parasite peak in the 2θ range from 37 to 57°. See the caption of Figure 7 for further details.
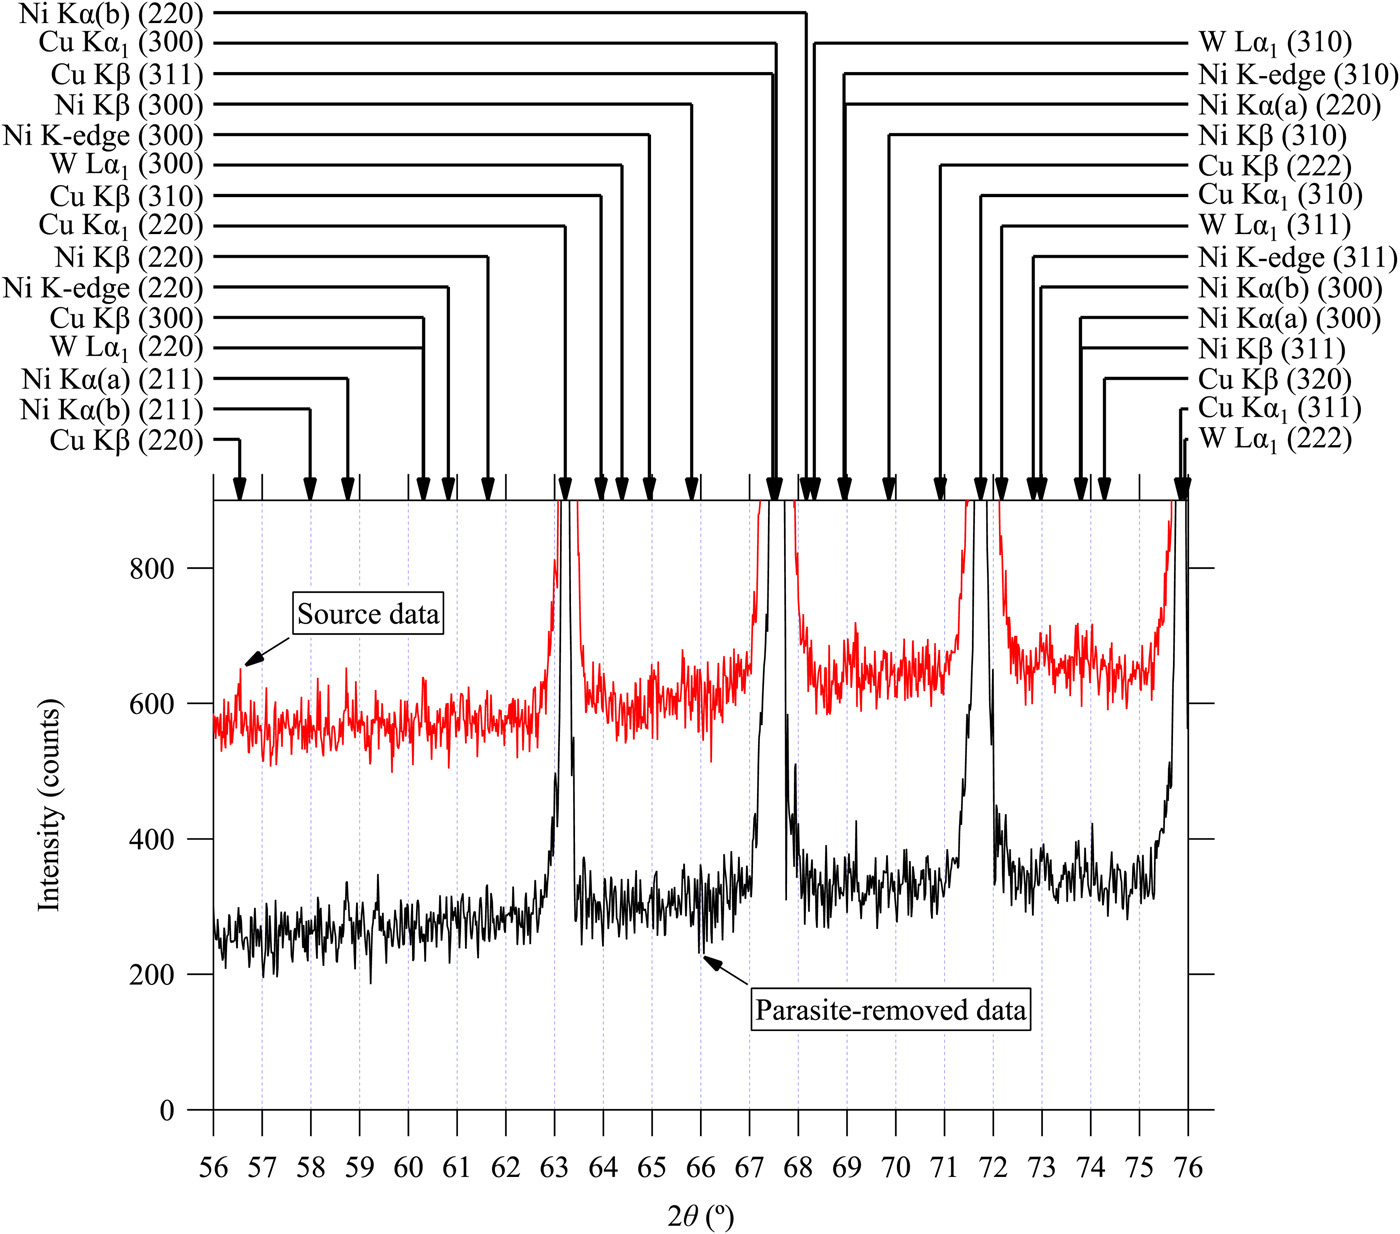
Figure 9. (Color online) Observed powder diffraction data of LaB6 powder (SRM660a) and the data treated by multiple deconvolution of parasite peak in the 2θ range from 56 to 76°. See the caption of Figure 7 for further details.
The authors would like to emphasize that all the marked peak positions in Figures 7–9 are assigned to the diffraction of LaB6, which is the main component of the sample powder. The interpretation of the data treated by the current method should be much easier, because no peak other than the diffractions for CuKα 1 emission is detected. The method will particularly be useful for qualitative analysis to detect trace amount of impurities in unknown samples. It should be noted that the intensity of the smallest parasite peak (d) is estimated at 0.07% of the intensity of the main CuKα 1 peak, as listed in Table II.
III. CONCLUSION
Small diffraction peaks for NiKα (a), NiKα (b), NiKβ, and WLα 1 emissions are detected in the data measured with a Cu-target X-ray tube, a Ni filter on the diffracted beam side and a one-dimensional Si strip detector in the Bragg–Brentano geometry. The observed peak locations for the emissions of Ni are deviated from those expected by the Bragg's law, but can be modeled by an empirical formula. A method to reduce the intensities of the small peaks has been proposed. The method is based on multiple deconvolution with the appropriate scale transform of abscissa for each of the empirical formulas of small peaks. The observed small peaks in the diffraction data of standard powder samples of Si and LaB6 have effectively been removed by the method with the common instrumental parameters.