


I. INTRODUCTION
Oxides of the A 2BO 4 type with A = lanthanides, B = 3d transition metals possessing K2NiF4-type structure have been extensively studied in recent years because of their catalytic activities and electrical and magnetic properties. A unique set of these properties makes them useful as electrode materials in different electrochemical devices. Further investigations on these oxides have been conducted to find appropriate compositions with the best set of necessary properties. In fact, La1.85Ba0.15CuO4, the barium-doped analogue of La2CuO4 was the first high-T c oxide discovered with T c at 30 K (Bendorz and Müller, Reference Bendorz and Müller1986).
Many authors have reported studies on nickel oxides having the same structure. In particular, extensive investigations have been conducted on the structural, magnetic and electrical properties of La2−xSrxNiO4−δ (Gopalakrishnan et al., Reference Gopalakrishnan, Colsmann and Reuter1977; Sreedhar and Rao, Reference Sreedhar and Rao1990; Takeda et al., Reference Takeda, Kanno, Sakano, Yamamoto, Takano, Bando, Akinaga, Takita and Goodenough1990) and Nd2−xSrxNiO4−δ (Brian et al., Reference Brian, Ramanujachary, Zhang and Greenblatt1990; Takeda et al., Reference Takeda, Nishijima, Imanishi, Kanno, Yamamoto and Takano1992) solid solutions. We are more interested in the mixed oxides based on neodymium rare earth, and have previously studied the series NdSrNi1−xCuxO4−δ, 0 ≤ x ≤ 1 (Chaker et al., Reference Chaker, Roisnel, Potel and Ben Hassen2004, Reference Chaker, Roisnel, Cador, Amami and Ben Hassen2006). A systematic substitution of Ni by Cr in the NdSrNiO4 parent compound was reported in our previous works, and we have synthesized new compounds in the NdSrNi1−xCrxO4−δ, with 0 ≤ x ≤ 1 by the solid state method (Chaker et al., Reference Chaker, Roisnel, Ceretti and Ben Hassen2010) and by the modified sol gel method and subsequent annealing in 1 atm of Argon gas flow (Jammali et al., Reference Jammali, Chaker, Cherif and Ben Hassen2010). Therefore, we realized that experiments in the fully oxygenated atmosphere to prepare an oxygen-deficient compound (Ln0.33Sr1.67Ni0.8Cu0.2O4−δ), always produce multiphase samples, but the preparation under 1 atm of argon gas flow resulted in the formation of the pure compound.
A study of the Ln2−xSrxNiO4−δ system with smaller Y3+ cation leads to the phase YSr5Ni3O11 (James and Attfield, Reference James and Attfield1993). In one of our previous investigations (Chaker et al., Reference Chaker, Roisnel, Ceretti and Ben Hassen2007) of the quaternary system Ln2O3–SrO–NiO–CuO, we have determined similar phases of LnSr5Ni2.4Cu0.6O11 that form with the small lanthanides Ho, Er, and Dy. We have described the electrical properties and crystal structures of Dy0.33Sr1.67Ni0.8Cu0.2O4−δ (Hamdi et al., Reference Hamdi, Ouni, Chaker, Rohlicek and Ben Hassen2011b) and HoSr5Ni2.4Cu0.6O11 (Chaker et al., Reference Chaker, Roisnel, Ceretti and Ben Hassen2007), all of them experiencing a high-temperature semiconductor. To the best of our knowledge, there are no reports on the preparation, crystal structure or physical properties of Er0.33Sr1.67Ni0.8Cu0.2O4−δ. In the present work, we describe the synthesis of the new compound Er0.33Sr1.67Ni0.8Cu0.2O4, along with the structural characterization and the resistivity measurements at high temperature.
II. EXPERIMENTAL
A. Synthesis
The Er0.33Sr1.67Ni0.8Cu0.2O4−δ (ErSr5Ni2.4Cu0.6O11) sample was prepared in a polycrystalline form using the conventional solid state method. Before use, Er2O3 (Aldrich 99.99%) was calcined at 1373 K for 9 h in air to remove any carbonate and bicarbonate impurities. NiO and CuO (Aldrich 99.99%) were used as obtained. Stoichiometric amounts of Er2O3, SrCO3, NiO and CuO were thoroughly ground together and calcined at 1223 K for 36 h. The obtained powder sample was pelleted, then sintered in a tube furnace at 1423 K under flowing oxygen to maximize the oxygen content for 48 h and then cooled slowly to room temperature. The sample is repelletized and reheated several times for the same period until no further changes in the X-ray diffraction pattern were observed.
B. Data collection and electrical measurements
To identify the phase composition and to refine the unit cell parameters, the sample was examined by X-ray diffraction using BRUKER AXS D8 ADVANCE diffractometer with a monochromatic CuKα 1 radiation (λ = 1.540 56 Å) obtained with an incident-beam curved germanium monochromator. Data were collected at each 0.0078° step width for 1.7 s over a 2θ range from 8.0000° to 120.0063°. Pattern matching and Rietveld refinement were performed using FullProof software (Rodriguez-Carvajal, Reference Rodriguez-Carvajal1990).
Electrical direct current resistivity measurements were performed on sintered pellets using a Lucas Labs 302 four point probe with a Keithley 2400 digital Source Meter (Keithley Instruments Inc., Cleveland, Ohio). Measurements were performed in the temperature range of 320–540 K.
The oxygen content of the compound was indirectly determined at room temperature after calculation of the valence average of the transition metal ions obtained by iodometric titration under flowing nitrogen gas taking into account that Ni3+ and Cu3+ can be present in the sample with Ni2+ and Cu2+. In fact, 60 mg sample was dissolved in a solution of 6 M HCl in the presence of an excess KI, leading to reduction of Ni3+ to Ni2+ and all the copper ions (Cu3+ and Cu2+), to Cu+ ions with the formation of iodine that was titrated with a Na2S2O3 solution using starch as an indicator. The sodium thiosulfate solution was standardized using pure copper wire.
III. RESULTS AND DISCUSSION
A. Crystal structural and oxygen stoichiometry
The exact temperature, the gas atmosphere, and the reaction time are considered essential to obtain a pure phase containing no traces of the starting materials. In fact the Er0.33Sr1.67Ni0.8Cu0.2O4−δ sample was successfully synthesized under flowing oxygen at 1423 K. Inspection of the X-ray patterns at intermediate stages of the synthesis appeared to indicate that an impurity phase identified as Er2SrO4 (PDF-00-046-60133) (ICDD, 1994) still persists even after a multitude of sintering. Therefore, a biphasic Rietveld refinement was applied for the Er0.33Sr1.67Ni0.8Cu0.2O4−δ sample. Quantitative X-ray analysis of the sample by FULLPROOF program, using Brindley's procedure (Brindley, Reference Brindley1949) indicates a proportion less than 1% of Er2SrO4. Hence, this impurity is considered to have a negligible effect on the stoichiometry of the material. The refinement showed a good fit between the observed and the calculated patterns and the cell dimensions obtained from this refinement are given in Table I.
TABLE I. Unit cell for Er0.33Sr1.67Ni0.8Cu0.2O4−δ.
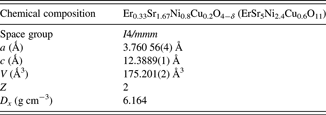
Profile analysis of X-ray diffraction pattern for Er0.33Sr1.67Ni0.8Cu0.2O4−δ compound was carried out on the basis of a tetragonal system (space group I4/mmm) by analogy with similar phases formed with Ho (Salwa et al., 2011) and Dy (Chaker et al., Reference Chaker, Roisnel, Ceretti and Ben Hassen2007). The background was fitted with a linear interpolation between 100 chosen points. The lattice parameters deduced from the X-ray powder diffraction profile refinement are found to be: a = 3.760 56(4) and c = 12.3889(1) Ǻ.
The stability of the Er0.33Sr1.67Ni0.8Cu0.2O4−δ compound having a K2NiF4-type structure can be discussed in terms of the tolerance factor value defined by Goldschmidt (Ganguly and Rao, Reference Ganguly and Rao1984), as:
 $$t\; =\; \displaystyle{{\displaystyle{{0.33r_{{\rm Er}^{3+} }+1.67r_{{\rm Sr}^{2+} } } \over 2}+r_{{\rm O}^{2 - } } } \over {\sqrt 2 \; \left[{0.8r_{{\rm Ni}^{3+} } 0.2r_{{\rm Cu}^{2+} } r_{{\rm O}^{2 - } } } \right]}}.$$
The K2NiF4-type structure is stable over the range 0.866 ≤ t < 1. The T (tetragonal) structure exists for 0.88 ≤ t ≤ 0.99 and the T/O (tetragonal/orthorhombic) structure is present for 0.866 ≤ t < 0.88. Based on Shannon's ionic radii (Shannon, Reference Shannon1976), (r Er3+ = 1.062 Å, r Sr2+ = 1.31 Å in a nine-fold coordination and r Ni3+ = 0. 56 Å, in a low spin case, r Cu2+ = 0. 73 Å and r O2− = 1. 4 Å in a six-fold coordination), the calculated tolerance factor for Er0.33Sr1.67Ni0.8Cu0.2O4−δ is t = 0.9465, this value is included in the tetragonal symmetry stability range.
Consequently, Rietveld refinement of Er0.33Sr1.67Ni0.8Cu0.2 O4−δ X-ray data was performed to confirm the K2NiF4-type structure. The structural refinement was carried out in the space group I4/mmm starting with atomic positions taken from Ho0.33Sr1.67Ni0.8Cu0.2O4−δ (HoSr5Ni2.4Cu0.6O11) (Chaker et al., Reference Chaker, Roisnel, Ceretti and Ben Hassen2007), with Er/Sr and O(2) atoms situated at special positions 4e with coordinates (0, 0, z). The Ni and Cu atoms are located at (0, 0, 0) in the 2a site, and the O(1) atoms at (0, ½, 0) in the 4c site. Atomic positions were refined for all atoms, together with scale factor and profile parameters. It is well known that in Rietveld refinements of heavy-atom structures, using X-ray diffraction data, much problematic intensity may be hidden in the thermal displacement factors of relatively light atoms (Hill, Reference Hill1992; Hamdi et al., Reference Hamdi, Amami, Hlil and Ben Hassen2011a, Reference Hamdi, Ouni, Chaker, Rohlicek and Ben Hassen2011b). That is why we undertook the refinement of oxygen atoms with fixed occupancies at 0.125 and thermal displacement factors fixed to values higher than those of heavy atoms. It was also impossible to refine the Ni/Cu ratio, owing to the similar X-ray scattering powers of these elements. Refinements of the physically sensible isotropic temperature factors were unstable, but good results were obtained by refinement of the overall isotropic displacement factor. Finally, refinement of the preferred orientation correction in the [001]-direction led to a significant decrease of χ 2, and a considerable improvement in the visual quality of the fit. A final refinement converged to R wp = 10.75%, χ 2 = 2.51, R p = 14.80%, R B = 4.77% and R F = 2.73%.
To determine the oxygen non-stoichiometry, we carried out an iodometric titration using the Na2S2O3 standard solution. The oxygen non-stoichiometry (δ) is directly correlated with the Ni3+ and Cu3+ content according to the formulation Er0.33Sr1.67(Ni3+1−τ Ni2+τ)0.8(Cu3+1−τ Cu2+τ)0.2O4−δ, with δ = 0.33 + (1/2)τ. The content (1 − τ) of the average of cations transition metals Ni3+ and Cu3+ was determined by iodometric titration. I− anions reduce Ni3+ to Ni2+ and all the copper ions (Cu3+ and Cu2+) to Cu+. The titration of the resulting I 2, by a solution of Na2S2O3 sodium thiosulfate led to determining the value τ = 0.28 and therefore δ = 0.47 after considering the average of cations transition metals Ni3+ and Cu3+. The obtained results indicate that the compound is oxygen deficient.
B. Structure description
The observed, calculated and difference profiles for the Rietveld refinement of Er0.33Sr1.67Ni0.8Cu0.2O4−δ compound are shown in Figure 1. An enlargement of the fit to the 2θ region between 26° and 46° 2θ is also presented in Figure 1. The structural refined parameters for Er0.33Sr1.67Ni0.8Cu0.2O4−δ are summarized in Table I.

Figure 1. Observed, calculated and difference profiles for Rietveld refinement of Er0.33Sr1.67Ni0.8Cu0.2O4−δ compound.
As shown in Figure 2, the structure can be described as an ordered intergrowth of alternating perovskite (Er/Sr)(Ni/Cu)O3 and rock salt (Er/Sr)O layers stacked along the tetragonal c-axis. The (Ni/Cu)O6 octahedra shares corners in the ab-plane forming a two-dimensional array of (Ni/Cu)–O–(Ni/Cu) bonds which is responsible for a variety of interesting physical phenomena, as for example, the anisotropic electrical transport and magnetic exchange interactions (Bassat et al., Reference Bassat, Odier and Gervais1987; Buttrey and Honig, Reference Buttrey and Honig1988).

Figure 2. Crystal structure of the Er0.33Sr1.67Ni0.8Cu0.2O4−δ sample with the tetragonal K2NiF4-type structure.
C. Electrical conductivity
To obtain dense ceramic pellets for electrical measurements, a powder sample of the material was grounded (in ethanol). A pellet (13 mm in diameter and 1.2 mm thick) was prepared by uniaxial pressing (100 MPa). It was then sintered at 1173 K for 4 h to obtain a disk with high density. The total electrical conductivity σ e of the sintered ceramic was determined, under air using the four-probe technique, in the temperature range of 320–540 K. The corresponding curve to σ e vs. 1000/T is reported in Figure 3. First, the conductivity increases with temperature to reach a maximum observed between 425 and 439 K then, above this temperature, the conductivity decreases, owing to the decrease of the oxygen content and correspondingly of the density of Ni3+ and Cu3+ carriers (Bassat et al., Reference Bassat, Odier and Loup1994; Boehm et al., Reference Boehm, Bassat, Dordor, Mauvy, Grenier and Stevens2005). We focus our study on the conduction mechanism only in the temperature range up to 439 K (where the maximum of conductivity is achieved). Figure 4 shows the relationship of Ln(σT) vs. 1000/T for the temperature range of 320–439 K. The increase of Ln(σT) with increasing temperature indicates that the compound has a p-type semiconductor behaviour over the chosen temperature range. To determine the conduction mechanism, we tried to use the thermally activated adiabatic small polaron hopping as a conduction model (Mott and Davis, Reference Mott and Davis1971; Long et al., Reference Long, Pollak and Shklovskii1991; Iguchi et al., Reference Iguchi, Nakatsugawa and Futakuchi1998; Tan et al., Reference Tan, Chen, Jin, Zhao and Luo2008):
 $$\sigma \; =\; \sigma _0 T^{ - 1} {\rm exp}\left({\displaystyle{{ - E_a } \over {k_{{\rm B}\; } T\; \; }}} \right)\comma \;$$
where E a is the activation energy (polaron formation and hopping energy), σ 0 is a constant related to polaron concentration and diffusion. In the analysis of the simulated curve: Ln(σT) = f(1000/T), we found that the convergence of curve fitting was achieved in the whole range of temperature. This suggests that the charge transport in Er0.33Sr1.67Ni0.8Cu0.2O4−δ ceramic, in the temperature range of 320–439 K, is described by an adiabatic small polaron hopping model, where activation energy, after fitting, is E a = 0.21 eV.

Figure 3. Thermal variation of electronic conductivity σe for the Er0.33Sr1.67Ni0.8Cu0.2O4−δ compound (320 ≤ T(K) ≤ 540).

Figure 4. Arrhenius relations of Ln(σT) vs. 1000/T for the Er0.33Sr1.67Ni0.8Cu0.2O4−δ.
IV. CONCLUSION
The Er0.33Sr1.67Ni0.8Cu0.2O4−δ (ErSr5Ni2.4Cu0.6O11) compound was successfully formed at 1423 K in an oxygen atmosphere. Rietveld refinement using powder X-ray diffraction data shows that the title compound crystallizes in the tetragonal K2NiF4-type structure in space group I4/mmm. Results obtained by iodometric titration indicate that the compound is oxygen deficient (δ = 0.47). The transport mechanism in Er0.33Sr1.67Ni0.8Cu0.2O4−δ was investigated. On heating, under air, first, the conductivity increases with temperature to reach a maximum at 439 K. Above this temperature, the oxide starts to lose oxygen; consequently holes concentration is decreased and resistivity increased. The fitting shows that the adiabatic small polaron hopping model describes the experimental data in the temperature range of 320–439 K.
ACKNOWLEDGEMENT
The authors gratefully acknowledge the ICDD for financial support (grant number: 09-04).


