Milk holds a complex protein system, basically classified into two groups, the caseins and the whey proteins. Proteomic studies, being more and more established, are used increasingly in food science, and a gel-based proteomic approach consisting of 2-DGE coupled to mass spectrometry (MS) analysis has been applied for defatted milk and dairy products (O'Donnell et al. Reference O'Donnell, Holland, Deeth and Alewood2004; Manso et al. Reference Manso, Léonil, Jan, Gagnaire and Jan2005). Pre-fractionation of milk samples or specific enrichment strategies are attractive approaches prior to 2-DGE analysis due to the great dominance of caseins with similarities in both molecular mass (M w) and isoelectric point (pI), as well as many proteins with low abundance and/or several molecular isoforms (Holland et al. Reference Holland, Deeth and Alewood2006; Wedholm et al. Reference Wedholm, Møller, Steensballe, Lindmark-Månsson, Karlsson, Andersson, Andrén and Larsen2008; Larsen et al. Reference Larsen, Wedholm-Pallas, Lindmark-Mansson and Andrén2010). Pre-fractionation methods include among others chymosin-induced separation, isoelectric precipitation and ultracentrifugation; all exploiting different physico-chemical properties of milk proteins to ensure separation.
In chymosin-induced separation, which is also the initial step in cheese manufacturing, milk is separated into rennet casein and sweet whey. Chymosin, being a neonatal gastric aspartic endoprotease, cleaves κ-casein with high specificity for the Phe105–Met106 peptide bond, dividing κ-casein into a hydrophobic para-κ-casein associated with the casein fraction, and a hydrophilic, soluble caseinomacropeptide (Hyslop, Reference Hyslop, Fox and McSweeney2003). This specific, limited proteolysis destabilises the casein micelles and leads to structural disintegration and curd formation. Normally the flocculation of rennet casein is initiated when about 60–70% of κ-casein has been hydrolysed (Lomholt & Qvist, Reference Lomholt and Qvist1997), and it is readily sedimented by low-speed centrifugation. Isoelectric precipitation, also called acid precipitation, is another classic milk separation method, which separates milk into acid casein and whey. Bovine milk has a pH of approximately 6·7, where the casein micelles have a net negative charge. Adjusting pH of milk to the pI of the caseins (pI ≈ 4·6) will neutralise the outer surface of the micelles, followed by irreversible denaturation of the micellar structure and precipitation of the caseins, which then can easily be sedimented by low-speed centrifugation (Fox, Reference Fox, Fox and McSweeney2003). A third widely used technique, ultracentrifugation, is a high speed centrifugation separation method that follows the sedimentation principle where centripetal acceleration causes more dense substances, such as the casein micelles, to separate out along the radial direction, resulting in pelleting of ultracentrifuged casein. Once casein is removed, all other proteins left in the milk preparation are by definition called whey proteins, also referred to as the milk serum proteins. Contrary to the other methods, the micelle structure is not destroyed during ultracentrifugation and can thus be re-dispersed with properties essentially similar to those of the original micelles (Fox, Reference Fox, Fox and McSweeney2003). Taken together, the casein and whey fractions prepared by the various methods differ, and while recent gel-based proteomic studies have examined milk proteins in some of these different fractions, e.g. in acid whey (Fong et al. Reference Fong, Norris and Palmano2008) or in rennet casein and sweet whey (Wedholm et al. Reference Wedholm, Møller, Steensballe, Lindmark-Månsson, Karlsson, Andersson, Andrén and Larsen2008; Larsen et al. Reference Larsen, Wedholm-Pallas, Lindmark-Mansson and Andrén2010), a comparative proteomic study using these different techniques has to our knowledge not been published.
A focal point when choosing the 2-DGE approach for analysing milk proteins is selection of an appropriate staining method in relation to both dynamic range, quantitative measurement of protein spot representations and MS compatibility (Harris et al. Reference Harris, Churchward, Butt and Coorssen2007). Particularly the casein fraction characterised by having a high abundance of the four casein gene products, represented within a narrow range of M w and pI, stresses the importance of choosing a proper staining method to ensure successful spot identification.
The objective of this study was thus to compare and choose between different 2-DGE staining strategies (colloidal Coomassie Blue G-250, silver staining and the newer fluorescent Flamingo Pink staining), followed by a comparative study of casein and whey 2-DGE profiles obtained after different pre-fractionation methods, that is, chymosin-induced separation, isoelectric precipitation and ultracentrifugation, aiming at characterising variations in protein composition that occur as a consequence of the different fractionation techniques and enzymatic cleavages. Emphasis was given to the proteolytic fragmentation pattern found in the rennet casein fraction.
Materials and Methods
Milk samples
Morning tank milk from Holstein–Friesian cows was collected on four consecutive days from the experimental herd at Research Centre Foulum, Faculty of Science and Technology, Aarhus University, Denmark, essentially as described earlier (Wedholm et al. Reference Wedholm, Larsen, Lindmark-Månsson, Karlsson and Andrén2006; Larsen et al. Reference Larsen, Wedholm-Pallas, Lindmark-Mansson and Andrén2010) and representing four biological replicates. The samples were placed on ice for transport to the laboratory.
Milk fractionation
On the same day as the sample collection, fresh milk samples were defatted by centrifugation (at 2643 g, 4 °C, 30 min). Hereafter each defatted milk sample was divided into three aliquots each subjected to one of the three different fractionation methods: chymosin-induced separation, isoelectric precipitation and ultracentrifugation, resulting in a total of 12 whey and 12 casein fractions. For chymosin-induced separation, chymosin (2 ml/l of Chy-Max Plus, 190 International Milk Clotting Units/ml, Christian Hansen A/S, Hørsholm, Denmark) was added to defatted milk samples preheated to 30 °C, then further incubated at 30 °C for 10 min, centrifuged (1500 g, 5 °C, 10 min) and subsequently collection of the supernatant containing the sweet whey fraction was carried out. The rennet casein pellet was washed twice in cold water, re-centrifuged, and dissolved in 0·1 m tri-sodium citrate buffer, pH 8·9, to original milk volume. For isoelectric precipitation, defatted milk was adjusted to pH 4·6 at 4 °C using 1 N acetic acid, and the samples were incubated for 2 min to ensure casein precipitation, followed by addition of 1 N sodium acetate in an amount equal to the acetic acid addition. After centrifugation (1500 g, 5 °C, 10 min), the supernatant containing acid whey was collected. The remaining acid casein pellet was washed and resuspended as described above. For ultracentrifugation, defatted milk was fractionated using an Optima™ L-80 XP ultracentrifuge (100 000 g, 4 °C, 1 h; Beckman Coulter Inc., Brea, CA, USA). The non-sedimented whey proteins were retained in the supernatant. The casein pellet was recovered, washed and resuspended as described above. All fractions were stored at −20 °C until used for proteomic 2-DGE analysis.
2-DGE analysis
Initially, acid casein and the corresponding acid whey from one sample of acid-precipitated milk samples were run separately on 2-DGE gels to investigate the suitability of three different staining methods (silver staining, colloidal Coomassie Blue G-250 or fluorescent Flamingo Pink stain) for the visualisation of casein and whey spots, thus representing a gel set of six gels (2 milk fractions × 3 staining methods). After thorough visual evaluation of the staining methods, all casein and whey fractions from the three separation methods were analysed on separate 2-DGE gels in a new gel set of four biological replicates (four tank milk samples), giving a total of 24 gels (4 biological replicates × 2 milk fractions × 3 separation methods). For the first dimension, immobilised 11-cm immobilised pH gradient (IPG) strips (pH 4–7, BioRad, Hercules, CA, USA) were used, and precast 8–16% gradient Criterion gels (BioRad, Hercules, CA, USA) were used for the second dimension. A volume of each sample corresponding to 50 μg protein as determined by the Bradford assay (BioRad, Hercules, CA) was dissolved 1:10 v/v in lysis buffer containing 6 m urea, 2 m thiourea, 1·5% v/v pharmalyte (pH 4–7, GE Healthcare, Uppsala, Sweden), 0·8% w/v CHAPS, 1% w/v DTE. The samples were incubated overnight at room temperature, allowing passive absorption of the samples into the IPG strips. Running conditions for the 2-DGE gels were essentially as described earlier using reducing conditions (Larsen et al. Reference Larsen, Wedholm-Pallas, Lindmark-Mansson and Andrén2010). Gels were stained with Flamingo Pink™ Fluorescent Gel stain (BioRad, Hercules, CA, USA) according to the manufacture, with colloidal Coomassie Blue G-250 (Serva, Heidelberg, Germany) as previously described (Kang et al. Reference Kang, Gho, Suh and Kang2002) or with silver staining (Wedholm et al. Reference Wedholm, Møller, Steensballe, Lindmark-Månsson, Karlsson, Andersson, Andrén and Larsen2008). Gels stained with fluorescent stain were over-stained with colloidal Coomassie Blue G-250 if used for MS analysis.
Image and statistical analysis
Gels stained with silver and colloidal Coomassie Blue G-250 dye were photographed using a Viber Lourmat digital camera (ImageHouse, Copenhagen, Denmark), whereas gels stained with fluorescent stain were visualised using a Bio-Rad Criterion Stain Free™ Imager.
Gel spots were detected and quantified using PDQuest 2-D Analysis software (vers. 8.0; Bio-Rad, Hercules, CA, USA). After automatic spot detection, the annotated spots were manually edited. For a spot to be valid, it had to be present in all four replicates within each separation method, and spots missing between the methods were verified as not being the result of technical error and assigned a value of zero (Grove et al. Reference Grove, Hollung, Uhlen, Martens and Færgestad2006). Relative spot volumes were calculated (dividing the spot volume of the individual spots on a gel with the total spot volume of all spots on that gel) for each separate gel to overcome gel-to-gel variations in spot intensities and sample loadings. Regions of the gels displaying unique spots in relation to treatment were selected for further MS identification.
In-gel digestion, desalting and concentration of protein spots
Protein spots were subjected to in-gel tryptic digestion, essentially as described by Jensen et al. (Reference Jensen, Larsen and Roepstorff1998). Custom-made chromatographic columns were used for desalting and concentration of the peptide mixture prior to MS analysis as described by Lametsch et al. (Reference Lametsch, Roepstorff and Bendixen2002). For matrix-assisted laser desorption time-of-flight (MALDI-TOF) tandem MS analysis, the peptides were eluted using 0·5 μl matrix solution consisting of 10 g/l α-cyano-4-hydroxycinnamic acid (Sigma Aldrich, St. Louise, MO, USA), 1% formic acid and 70% acetonitrile directly onto a MALDI target plate. For liquid quadrupole time-of-flight (Q-TOF) tandem MS analysis, the peptides were eluted in 0·5 μl 70% acetonitrile.
Identification of milk proteins by mass spectrometry
Mass spectra were obtained using an Ultraflex MALDI-TOF mass spectrometer (Bruker Daltonics, Bremen, Germany) or a hybrid Q-TOF mass spectrometer (Bruker Daltonics, Bremen, Germany) connected to an Ultimate nano-HPLC system (LC Packings, Amsterdam, the Netherlands) mounted with a vented-column setup, as described by Wedholm et al. (Reference Wedholm, Møller, Steensballe, Lindmark-Månsson, Karlsson, Andersson, Andrén and Larsen2008).
Proteins were identified by use of an in-house Mascot database search engine (Matrix Science, Boston, USA) using the SwissProt or the NCBInr database (May 2007). Tandem MS search parameters had a mass accuracy of ±0·025 Da. Methionine oxidation, serine and threonine phosphorylation, and carbamidomethyl were allowed as variable modifications. Cleavage specificity was specified as semi-tryptic to validate any sequence processing. Significant protein identifications (protein scores above 75 (P < 0·05), a minimum of two unique peptides identified) were reported.
Results
Comparison of staining methods
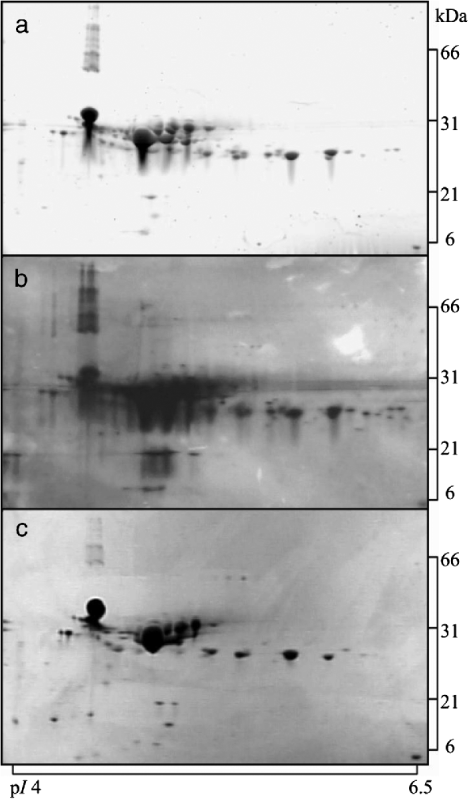
Initially, a subset consisting of 2-DGE gels analysing acid casein and whey fractions from one tank milk sample was stained using either the fluorescent stain Flamingo Pink, silver staining, or colloidal Coomassie Blue G-250. This analysis was carried out in order to select the most suitable staining method for visualisation of the proteomic profiles of fractionated milk. The result is shown in Fig. 1 for acid casein. After visual inspection of all gels, of both acid casein and acid whey (results not shown), the fluorescent staining method was found to be comparable in sensitivity to silver staining, both being superior to that of colloidal Coomassie Blue G-250. However, it was also apparent that silver staining appeared with more background, and therefore judged less suitable for quantification. Based on this study, the fluorescent dye was chosen as staining reagent in the subsequent study.

Fig. 1. 2-DGE gels analysing acid casein stained using different reagents: (a), fluorescent Flamingo Pink; (b), silver staining; (c), colloidal Coomassie Blue G-250. Samples were focussed using pH 4–7 IPG strips and electrophoresed on 8–16% gradient polyacrylamide gels. The same amount of protein was loaded on all gels (50 μg).
Proteomic profiles of casein and whey
Fractionation of defatted milk using chymosin-induced separation, isoelectric precipitation and ultracentrifugation resulted in effective separation into casein and whey fractions, allowing for proteomic analysis of 2-DGE gels.
2-DGE proteomic maps of the casein fractions obtained by the three separation methods are shown in Fig. 2a–c. A characteristic 2-DGE fingerprint was obtained from each casein type. In general, the protein spots observed in all casein types (labelled by name in Fig. 2a) comprised the mature full-length αs1-casein, αs2-casein monomer and β-casein, along with minor amounts of whey proteins, that is, β-lactoglobulin (β-lg) and α-lactalbumin (α-la), all previously identified using MS (Larsen et al. Reference Larsen, Wedholm-Pallas, Lindmark-Mansson and Andrén2010). Image analysis of the casein gels included annotation of a total of 81 individual protein spots, and of these, 36 spots were unique (present or absent) to a specific fragmentation method in specific regions of the gels. Chymosin-induced casein separation resulted in a markedly changed proteomic profile of especially the proteins located within two gel areas (spots 1–25; located within two marked boxes in Fig. 2a). Also spot 26 had a higher intensity in chymosin-induced casein compared with the other two methods. Contrary to that of chymosin-induced separation, the 2-DGE profile from isoelectric precipitation and ultracentrifugation gave a different spot pattern in these regions on the gels, though similar to each other, where spots were annotated to both acid and ultracentrifuged casein (spots 27–36; Fig. 2b). Unexpectedly, the gel of ultracentrifuged casein appeared to contain less protein than the gels displaying the other two casein fractions, despite that the same amount of protein was loaded. Increasing the protein load (×2, ×5 or ×10) of the ultracentrifuged casein onto the IPG strips did not, however, result in an expected marked increase in protein staining on the gels (data not shown). Hence, the lysis buffer containing 6 m urea apparently was not enough to completely destroy the micelle structure, affecting the protein uptake by the IPG strips.

Fig. 2. Comparative analysis of casein fractions. 2-DGE proteomic profile of the casein fraction from three separation methods: (a), chymosin-induced separation; (b), isoelectric precipitation; (c), ultracentrifugation. The same amount of protein was loaded on all gels (50 μg), and gels were stained using fluorescent stain. The major protein spots are labelled; αS1-CN = αS1-casein, αS2-CN = αS2-casein, β-CN = β-casein, β-lg = β-lactoglobulin, α-la = α-lactalbumin. Two boxes in each gel mark the location of spots unique to rennet casein, and protein spots identified by mass spectrometry are indicated by ID numbers.
Likewise, the concomitant sweet whey, acid whey and ultracentrifuged whey fractions were analysed using 2-DGE, and the result is shown in Fig. 3a–c. Gel fingerprints were obtained from each whey fraction, where the profiles exhibited a high degree of similarity, dominated by a limited number of major whey proteins, i.e. bovine serum albumin (BSA), lactophorin, β-lg, and α-la (marked by name in Fig. 3a). Using image analysis, 67 protein spots were annotated. Only the 2-DGE profile of ultracentrifuged whey could be distinguished from the other methods by a small number of unique spots (spots 37–43; Fig. 3c).

Fig. 3. Comparative analysis of whey fractions. 2-DGE profile of whey fraction from three separation methods: (a), chymosin-induced separation; (b), isoelectric precipitation; (c), ultracentrifugation. The same amount of protein was loaded on all gels (50 μg), and gels were stained using fluorescent stain. The major protein spots are labelled by name; BSA = bovine serum albumin, β-lg = β-lactoglobulin, α-la = α-lactalbumin. Three boxes in each gel mark the location of spots unique to ultracentrifuged whey, and protein spots identified by mass spectrometry are indicated by ID numbers.
MS analyses
Distinctive proteins spots of the rennet casein fraction (spots 1–26) were excised and subjected to tandem MS analysis (Table 1), identifying them all as casein fragments; eleven cleavage fragments from αs1-casein, fourteen from αs2-casein, seven from β-casein, and one from κ-casein. αs1-Casein cleavage fragments were positioned under the mature αs1-casein, predominantly in two spot chains, indicating fragments with variable posttranslational modifications, whereas fragments of αs2 and β-casein were identified at positions relatively close to the region of intact κ-casein variants before cleavage by chymosin, as seen by comparing Fig. 2a with Fig. 2b–c (clarification of changes at L308–9 Ed.). After treatment with chymosin, κ-casein was only identified in one spot, spot 18, and furthermore a distinct β-casein fragment was identified in spot 26 (Fig. 2a) visible in all casein fragmentation methods. Nine spots unique to isoelectric precipitated casein and ultracentrifuged casein (spots 27–33, 35 and 36) were excised and identified as κ-casein, using the acid casein gel as a template, while one spot was identified as β-casein (spot 34; Table 1).
Table 1. Protein spots in the casein and whey fractions identified by tandem mass spectrometry

a Corresponds to spots marked on the 2-DGE gels (Figs. 2 and 3) identified using either MALDI-TOF (‡) or QTOF MS/MS analysis (†)
b Primary accession key in either the SWISS-PROT (P numbers) or NCBInr (gi numbers) database
c Theoretical isoelectric point (pI) and molecular mass (M w) (kDa) of mature protein as according to the amino acid sequence without signal peptide and without consideration and/or degradation modifications. Calculated using www.expasy.org
e The minimum coverage (%) of the matched peptides in relation to the mature protein sequence without signal peptide
f The number of unique matched peptides in the database search
g Amino acid residues comprising the matched peptides (partially or totally) in the database search, numbered according to the mature amino acid sequence
In ultracentrifuged whey, unique spots (spots 37–43) were excised and subjected to tandem MS analysis (Table 1), identifying them as casein remnants (αs1-, αs2-, β-, and κ-casein) in the whey after ultracentrifugation.
Discussion
Comparison of staining methods
In the present study, the fluorescent staining approach for 2-DGE gel analysis of acid casein showed sensitivity comparable to silver staining, while colloidal Coomassie Blue G-250 was less sensitive, as expected. Colloidal Coomassie Blue G-250 has been described as being less sensitive than silver staining, but with a higher dynamic range and MS compatible (Miller et al. Reference Miller, Crawford and Gianazza2006). Further, the fluorescent staining was considered superior to silver staining in terms of low background, high sensitivity, ease of use and not least, resulting in distinctive spots without overlap in their boundaries. Moreover, fluorescent staining was compatible with downstream characterisation techniques, that is, quantitative image analysis and MS analysis. Silver staining has a relatively poor dynamic range and non-linear response (Miller et al. Reference Miller, Crawford and Gianazza2006) and may give a false impression of the relative casein abundance and impair quantitative image analysis. In general, fluorescent staining of 2-DGE gels has been less widely used for characterisation of milk proteins than the other two classic methods, colloidal Coomassie Blue G-250 (Holland et al. Reference Holland, Deeth and Alewood2006; Chevalier et al. Reference Chevalier, Hirtz, Sommerer and Kelley2009; Larsen et al. Reference Larsen, Wedholm-Pallas, Lindmark-Mansson and Andrén2010) and silver staining (Shevchenko et al. Reference Shevchenko, Wilm, Vorm and Mann1996; Wedholm et al. Reference Wedholm, Møller, Steensballe, Lindmark-Månsson, Karlsson, Andersson, Andrén and Larsen2008). The evaluation and comparisons of 2-DGE staining methods are all based on data obtained from a few gels, thus, we can only comment on trends observed between the same proteins under different staining conditions. A more precise staining comparison could include more replicates and image analysis of the gels. The resolution of the obtained protein spots, however, demonstrates that overall, the 2-DGE gels of acid casein stained using either the fluorescent stain, colloidal Coomassie blue G-250 or silver stain, had the same appearance, but visual inspection of the gels advised us to prefer the fluorescent dye as staining reagent.
Comparison of fractionation methods
This investigation showed that characteristic 2-DGE fingerprints were obtained of both casein and whey fractions separated using different approaches, although the profiles also showed a high degree of similarity, as expected. This allowed the effective display and identification of proteins partitioned into casein and whey fractions. Many of the casein and whey proteins could be separated by the strategy employed, with a total of 81 casein and 67 whey spots annotated in the image analysis.
The most striking difference between the several types of casein preparations was related to the marked difference in the profile of rennet casein, where a large number of protein spots were identified as casein fragments (αs1-, αs2-, β-, κ-), most likely generated as a result of chymosin hydrolysis. Some of these protein spots in rennet casein have previously been identified using MS (Wedholm et al. Reference Wedholm, Møller, Steensballe, Lindmark-Månsson, Karlsson, Andersson, Andrén and Larsen2008; Larsen et al. Reference Larsen, Wedholm-Pallas, Lindmark-Mansson and Andrén2010). The focus of these earlier studies was identification of protein spots in the fractions that differed between treatments, i.e. between fractions prepared from raw vs. heat-treated defatted milk or spots of significance for cheese yield, not giving an elaborate characterisation of rennet-induced casein spots. Due to the addition of chymosin, the κ-casein was cleaved in the chymosin-precipitated casein fraction, and indeed κ-casein was identified in only one spot (spot 18) of this fraction, showing an extensive degradation in rennet casein into para-κ-casein and caseinomacropeptide. We consider spot 18 to contain intact κ-casein remnant that has escaped cleavage by chymosin, as the observed M w of the protein spot was approximately 22 kDa and not indicative of a cleaved form. As explained earlier (Larsen et al. Reference Larsen, Wedholm-Pallas, Lindmark-Mansson and Andrén2010), we did not expect to observe either para-κ-casein, or the whey-associated caseinomacropeptide by this 2-DGE analysis since these protein fragments have pI values outside the range of the applied IPG strips (para-κ-casein, pI 9·33; unmodified caseinomacropeptide, pI 4·04). It is noted that the theoretical pI of intact αs2-casein (pI 8·34) was higher than the observed. This is considered to be due to the many phosphorylations in αS2-casein, varying from 10 to 13, which was not included in the pI calculations.
It has previously been demonstrated that chymosin also has a proteolytic action on αs1- and αs2-casein (McSweeney et al. Reference McSweeney, Olson, Fox, Healy and Højrup1993, Reference McSweeney, Olson, Fox and Healy1994), as well as on β-casein (Guillou et al. Reference Guillou, Miranda and Pelissier1991). During this study we identified a considerable number of fragments of αs1-, αs2-, and β-casein with varying observed M w and pI values in the chymosin-precipitated casein fraction, stressing the various cleavage sites available for chymosin also in these proteins.
Contrary to rennet casein, acid casein and ultracentrifuged casein showed a rather similar proteomic signature, and using acid casein as MS template, these characteristically similar protein spots were identified to be mature κ-casein. This observation is in accordance with other 2-DGE studies of milk, reporting κ-casein in multiple isoforms varying in level of phosphorylation and glycosylation (Holland et al. Reference Holland, Deeth and Alewood2004, Reference Holland, Deeth and Alewood2006).
The profile of ultracentrifuged casein appeared to contain less protein compared with the other two casein gels. This could be due to a more intact micelle structure of the ultracentrifuged casein potentially affecting the passive absorption onto the IPG strip prior to isoelectric focusing. A potential solution to this could be further disruption by addition of a strong calcium sequestrate such as ethylene diamine tetraacetic acid (EDTA) (Griffin, Reference Griffin1988), urea (McGann & Fox, Reference McGann and Fox1974), ethanol (O'Connell et al. Reference O'Connell, Kelly, Fox and De Kruif2001) or by dialysis against a phosphate-free buffer (Holt et al. Reference Holt, Davies and Law1986). In the present study the lysis buffer contained 6 m urea. Further studies investigating the addition of higher concentrations of chemicals, such as urea or EDTA, could enhance the knowledge about the 2-DGE profile of ultracentrifuged casein, but this would, at least in the case of EDTA, require an additional dialysis step. In this study the primary aim was to investigate the gel profiles avoiding excessive preparation steps, thus permitting a more direct comparison of the fractionation methods. Furthermore, during ultracentrifugation the smallest casein micelles are most difficult to sediment, and casein remnants were identified in the ultracentrifuged whey fraction, consisting mainly of β- and κ-casein. Thereby the casein to whey protein ratio was higher in the ultracentrifuged whey, further contributing to a lower amount of casein in Fig. 2c.
The presence of the relative high amount of β-casein in ultracentrifuged whey (spots 38, 40, 41) is expected to be a consequence of the low temperature used during the ultracentrifugation step, as β-casein has been shown to migrate from the casein micelles to the serum phase upon cooling (Davies & Law, Reference Davies and Law1983). Apart from the casein remnants in ultracentrifuged whey, the different whey fractions had the same overall gel-appearance. It has been stated that most of the caseins (90–95%) in milk are sedimented by high speed centrifugation at 100 000 g for 1 h (Fox, Reference Fox, Fox and McSweeney2003), and in our experiment we used these conditions, whilst we still found a considerable amount of residual caseins present in the serum. However, by increasing the speed and length of ultracentrifugation we found that this amount of casein could be decreased (data not shown).
Prior to 2-DGE, generally some kind of fractionation or partitioning is required to remove or deplete dominant proteins and increase resolution of the minor proteins. Previous investigations include high-resolution separation techniques such as anion and cation exchange chromatography (Fong et al. Reference Fong, Norris and Palmano2008), immunoabsorption (Murakami et al. Reference Murakami, Lagarde and Yuki1998; Yamada et al. Reference Yamada, Murakami, Wallingford and Yuki2002; Palmer et al. Reference Palmer, Kelly, Smit, Kuy, Knight and Cooper2006), affinity tagging (Holland et al. Reference Holland, Deeth and Alewood2006) and isoelectric focusing (Zuo & Speicher, Reference Zuo and Speicher2002). In this paper, we describe the more coarse fractionations of milk into casein and whey coupled with gel-based proteomic analysis, which shows that this approach can used in the characterisation of the subtle variations in protein composition of milk fractions that occurs as a consequence of different milk fractionation strategies. Furthermore, the unique proteomic signature of chymosin-precipitated casein, representing the initial stage of cheese manufacture, could be further characterised in relation to cheese manufacture conditions in a matrix of production variables, and subsequently explored for use of characterisations of the initial stages in cheese ripening and thereby potential use in quality control of various cheese types or innovation.
The work was funded by Arla Foods amba, the Danish Cattle Federation, the Danish Strategic Research Council and Aarhus University.