Introduction
Iron deficiency chlorosis (IDC) is common among the crops grown in calcareous, alkaline, coarse-textured, eroded and low organic matter containing and cold region soils where Fe is mostly found in insoluble ferric (Fe3+) form but very less in available ferrous (Fe2+) form, hence, Fe is less available for uptake by the plants (Ye et al., Reference Ye, Li, Wang, Wang, Li, Du, Zhang and Shou2015). Groundnut has been reported to be sensitive to Fe deficiency in alkaline and calcareous soils (Singh, Reference Singh, Basu and Singh2004; Zuo and Zhang, Reference Zuo and Zhang2011; Sánchez-Alcalá et al., Reference Sánchez-Alcalá, delCampillo, Barrón and Torrent2014). On the world scale, it is estimated that Fe deficiency occurs in about 30–50% of cultivated soils (Cakmak, Reference Cakmak2002). More than one-third of the soils in India are calcareous and spread mostly in the low rainfall areas of the western and central parts of the country. Groundnut being a major crop in these areas, IDC causes a considerable reduction (16–32%) in pod yield (Singh et al., Reference Singh, Chaudhari, Koradia and Zala1995; Singh, Reference Singh2001). Similarly, IDC is a common problem in groundnut producing areas with calcareous soils in northern China (Gao and Shi, Reference Gao and Shi2007), and Pakistan (Imtiaz et al., Reference Imtiaz, Rashid, Khan, Memon and Aslam2010; Akhtar et al., Reference Akhtar, Shahzad and Arshad2013). Further, iron deficiency can also lead to the reduced content of Fe in plant products thereby causing anaemia in animals and humans (Guerinot and Yi, Reference Guerinot and Yi1994).
In groundnut, iron deficiency initially appears as chlorosis on young rapidly expanding leaves with characteristic interveinal chlorosis. Under severe iron deficiency, veins also become chlorotic, leaves become white and papery and later turn brown and necrotic, and plants show stunted growth resulting in reduced yield (Singh et al., Reference Singh, Basu and Singh2004), seed Fe content (Boodi et al., Reference Boodi, Pattanashetti and Biradar2015a), and fodder (Prasad et al., Reference Prasad, Satyanarayana, Potdar and Craufurd2000). The acute iron deficiency would lead to plant death and complete crop failure. Application of Fe fertilizer in the form of inorganic, chelated and organic formulations has been suggested to overcome the Fe deficiency in plants (Laurie et al., Reference Laurie, Tancock, Mcgrath and Sanders1991), but these practices are either inefficient (Hüve et al., Reference Hüve, Remus, Lüttschwager and Merbach2003) or economically not feasible in the semi-arid tropics where groundnut is mainly grown as a rainfed subsistence crop. Hence, development of IDC tolerant groundnut cultivars for iron deficient calcareous soils would serve as a sustainable solution. The reduced subsets of germplasm such as core (Frankel, Reference Frankel, Arber, Limensee, Peacock and Stralinger1984) or mini core (Upadhyaya and Ortiz, Reference Upadhyaya and Ortiz2001) collections that represent geographical diversity would act as a cost-effective means of identifying diverse accessions having resistance or tolerance to biotic and abiotic stress, agronomic and nutritional quality traits. The mini-core collection (184 accessions) of groundnut that represents geographical diversity was constituted earlier at ICRISAT (Upadhyaya et al., Reference Upadhyaya, Bramel, Ortiz and Singh2002) and has been extensively used to identify agronomically desirable, abiotic and biotic stress resistant or tolerant and nutritionally dense groundnut germplasm (Upadhyaya et al., Reference Upadhyaya, Dwivedi, Vadez, Hamidou, Singh, Varshney and Liao2014). In the present study, the groundnut mini-core collection was evaluated to identify diverse sources of IDC tolerance for further utilization in groundnut breeding programme.
Materials and methods
Experimental material and design
The experimental material used in this investigation was groundnut mini-core collection that comprises 184 accessions belonging to two subspecies (fastigiata and hypogaea) and six botanical varieties (hypogaea bunch/runner 85 accessions; vulgaris 58 accessions; fastigiata 37 accessions; peruviana two accessions; aequatoriana and hirsuta one accession each) (Upadhyaya et al., Reference Upadhyaya, Bramel, Ortiz and Singh2002). In addition, four controls [ICG 156 hypogaea runner; ICG 13942 hypogaea bunch; ICG 13941 vulgaris; ICG 2738 fastigiata] and eight checks with varying levels of IDC response [tolerant – ICGV-06146, ICGV-86031, A30b; moderately susceptible – GPBD-5, DSG-1; susceptible – R-9227, TMV-2, GPBD-4] were used. A total of 196 genotypes were evaluated in unbalanced alpha design in the iron-deficient calcareous soils (DTPA extractable Fe <4 mg/kg) (online Supplementary Table S1) at College of Agriculture, Vijayapur (16°49′N, 75°43′E, 593 m above mean sea level) under University of Agricultural Sciences, Dharwad, India during two consecutive rainy seasons (June–October) of 2014 and 2015. The plot size for each genotype was one row of 3 m length with two replicates, wherein vulgaris, fastigiata, peruviana, aequatoriana and hypogaea bunch (erect types) were sown at an inter- and intra-row spacing of 30 and 10 cm, while hypogaea runner and hirsuta (runner types) at 60 and 10 cm, respectively. The recommended cultivation practices were followed to raise a good crop and protective irrigation was provided under severe moisture stress. All the major nutrients (N, P, K) were supplied in the form of urea, diammonium phosphate and muriate of potash fertilizers as per recommended dose. Micronutrients like Zn, Mn and Mg were applied in the form of ZnSO4, MnSO4 and MgSO4 at recommended level to avoid the complexity of overlapping deficiency symptoms with Fe. But, iron-containing fertilizers were not applied to maintain the iron deficiency status of the calcareous soils.
IDC response and yield-related traits
The IDC response was assessed based on two related traits such as a visual chlorotic rating (VCR) and SPAD chlorophyll meter reading (SCMR). For VCR, the 1–5 scale proposed by Singh and Chaudhari (Reference Singh and Chaudhari1993) based on severity and coverage of interveinal chlorosis in entire plant was followed [1 – normal green leaves with no chlorosis, 2 – green leaves with slight chlorosis on some leaves, 3 – moderate chlorosis on several leaves, 4 – moderate chlorosis on most of the leaves, 5 – severe chlorosis on all the leaves] (online Supplementary Fig. S1). The scoring was done based on overall expression of plants on plot basis at five different stages i.e. 20, 40, 60, 80 and 100 days after sowing (d). The minute differences in the deficiency symptoms of different relevant micronutrients were kept in mind while scoring. The chlorophyll meter SPAD 502 (Soil-plant analysis development meter, Konica Minolta) measures the absorbance of the leaf in the red and near-infrared region. Using these two transmittances, it calculates a numerical SPAD value which is proportional to the chlorophyll present in the leaf and is negatively related to chlorosis of the plants (Samdur et al., Reference Samdur, Singh, Mathur, Manivel, Chikani, Gor and Khan2000). The SCMR values were recorded in the interveinal area of the standard leaf (third fully opened leaf from the top) of the five plants in a plot using SPAD 502 and mean was computed at five different stages i.e. 20, 40, 60, 80, and 100 d. The mean performance of genotypes for traits such as plant height (cm), number of primary branches per plant and number of mature pods per plant were recorded on five random plants at the time of harvest and mean was computed, while pod yield (g/plant), shelling out turn (%) and hundred seed weight (g) were recorded after thorough air drying of pods for all the genotypes.
Chlorophyll and ferrous content
At the severe stage of IDC incidence (60 d) during the 2014 rainy season, 16 genotypes were selected including checks which belong to different botanical varieties with varying IDC response from tolerant to susceptible. The biochemical constituents such as chlorophyll content (a, b and total) and ferrous content were estimated among these genotypes to establish their correlation with IDC response traits such as VCR and SCMR at 60 d. The standard leaves (third fully expanded leaf from the tip of the main stem) of the five plants per genotype were used for the estimation of chlorophyll and ferrous content.
Chlorophyll estimation
The chlorophyll content was estimated using the method of Shoaf and Lium (Reference Shoaf and Lium1976). Hundred mg of fresh leaf tissue was cut into small pieces and incubated in 7 ml of Dimethyl sulfoxide at 65°C for 30 min. At the end of incubation period, the supernatant was decanted and leaf tissue was discarded. The supernatant volume was made up to 10 ml and absorbance was recorded at 645, 652 and 663 nm in UV-Vis spectrophotometer (ELICO make). The chlorophyll a, chlorophyll b and total chlorophyll content were calculated using the following formulae given by Arnon (Reference Arnon1949) and expressed as mg/g fresh weight of leaf.
Chlorophyll ‘a’ = [(12.7 × A663) – (2.69 × A645)] × V/1000 × W × a
Chlorophyll ‘b’ = [(22.9 × A645) – (4.68 × A663)] × V/1000 × W × a
Total Chlorophyll = Chlorophyll ‘a’ + Chlorophyll ‘b’
where A = absorbance at specific wave length (645, 663 nm), V = final volume of the chlorophyll extract (ml), W = fresh weight of the leaf sample (g), a = path length of light (1 cm)
Ferrous estimation
The active iron (Ferrous, Fe2+) estimation was done as per the procedure of Katyal and Sharma (Reference Katyal and Sharma1980).
(i) Preparation of leaf sample – The samples were collected from the standard leaf of plants. The leaves were washed once with tap water followed by 0.1N HCl and then rinsed with double distilled water. Further, the fresh leaves were chopped with a stainless steel knife and used for estimation of active iron content.
(ii) Preparation of o-phenanthroline extracting solution – To prepare 1 litre of o-phenanthroline extractant, 15 g of o-phenanthroline was added to about 850 ml of distilled water. To this continuously stirring solution, approximately 1N HCl was added dropwise. When the last traces of the salt were soluble, the pH was determined and it was found to be about 5.5. The volume of the solution was made up to 1 litre.
(iii) Ferrous estimation – Two grams of chopped sample was transferred to 100 ml capacity glass bottles. Twenty ml of o-phenanthroline solution was added and the contents of the bottles were stirred gently in order to embathe the plant sample with the extractant. The bottles were incubated for about 16 h at room temperature. The contents were filtered through Whatman No. 1 filter paper. The active iron was estimated directly in the filtrate by measuring the transmittance at 510 nm in UV-Vis spectrophotometer.
Statistical analyses
All the statistical analyses were performed using the GenStat 14.1 software (VSN International, 2011). The data of 2 years (2014, 2015) for all the traits were subjected to pooled analysis by restricted maximum likelihood (REML) analysis (Patterson and Thompson, Reference Patterson and Thompson1971) with years (environment) as fixed and genotypes as random variables. The genotype (σ2g), genotype × environment (σ2ge) variances and residuals were calculated for the pooled data. The significance of the environments was tested using Wald (Reference Wald1943) statistic. Best linear unbiased predictors (BLUPs) were calculated for the genotypes and used for comparison by the least significant difference (P = 0.05). Mini core accessions belonging to the six botanical varieties were categorized based on their growth habit into four groups: group 1 (vulgaris) (58 accessions, control ICG 13941), group 2 (fastigiata + peruviana + aequatoriana) (40 accessions, control ICG 2738), group 3 (hypogaea bunch) (51 accessions, control ICG 13942) and group 4 (hypogaea runner + hirsuta) (35 accessions, control ICG 156). Mean comparison between these groups for VCR and SCMR across five stages and yield-related traits were made using Student–Newman–Keuls (SNK) method at P = 0.05 (Newman, Reference Newman1939; Keuls, Reference Keuls1952). Pearson correlation coefficients (r) were estimated to know the correlations between the IDC tolerance associated traits (VCR and SCMR) across five stages, yield and its related traits for the pooled data over 2 years, and significance was tested using table ‘r’ value (P = 0.05). Genetic components of variability such as genotypic coefficient of variation (GCV), phenotypic coefficient of variation (PCV) (Burton and Devane, Reference Burton and Devane1953), broad sense heritability (H bs) (Hanson et al., Reference Hanson, Robinson and Comstock1956) and genetic advance as percent of mean (GAM) (Johnson et al., Reference Johnson, Robinson and Comstock1955) were estimated. The GCV and PCV were categorized as low (0–10%), moderate (10–20%) and high (>20%) as suggested by Sivasubramanian and Menon (Reference Sivasubramanian and Menon1973). The H bs were classified as low (0–30%), moderate (30–60%) and high (>60%) as suggested by Robinson et al. (Reference Robinson, Comstock and Harrey1949). The GAM were categorized as low (0–10%), moderate (10–20%) and high (>20%) as suggested by Johnson et al. (Reference Johnson, Robinson and Comstock1955). The principal component analysis (PCA) was performed using BLUPs of all traits. The hierarchical cluster analysis was performed by Ward's (Reference Ward1963) method using the Euclidian distances generated from five major principal components (PCs).
Results
Variance components
The REML analysis of pooled data over 2 years indicated significant genotype (σ2g) and genotype × environment (σ2ge) variances for VCR and SCMR across five stages (20, 40, 60, 80 and 100 d), except genotypic variance (σ2g) for SCMR at 40 d. Significant σ2g and σ2ge variances were also observed for pod yield and its related traits such as plant height, number of primary branches per plant, number of mature pods per plant, shelling out turn and hundred seed weight (online Supplementary Table S2). The Wald's statistic indicated significant differences between environments (years) for VCR (at 60, 80, 100 d) and SCMR (60, 100 d) at later stages of crop growth when IDC incidence was more severe. Significant differences between environments were also observed for pod yield, shelling out-turn, plant height and number of primary branches, but non-significant for number of pods per plant and hundred seed weight.
Genetic variability
Enormous genotypic differences for IDC response in the groundnut mini-core collection were evident with wide variation observed for VCR and SCMR across five stages (20, 40, 60, 80 and 100 d) in iron-deficient calcareous soils (Table 1). The intensity of IDC increased from early to later stages (20–100 d) of the crop growth as evident from the grand mean of mini core accessions that showed an increase in VCR (1.42–2.83), while a decrease in SCMR (33.5–19.7). Enormous differences were also observed for pod yield (1.2–6.3g/plant) and its related traits such as plant height (9.6–23.7 cm), number of primary branches per plant (3.8–6.3), number of mature pods per plant (2.2–12.7), shelling out turn (49.3–65.3%), and hundred seed weight (17.2–37.8) indicating the genotypic differences in mini core under iron deficiency stress. For VCR, the GCV values were moderate across all five stages, but PCV values were higher during initial stages (20, 40 d) but moderate during later stages (60, 80, 100 d). For SCMR, GCV values were low during initial stages (20, 40 d) and moderate to high during later stages (60, 80, 100 d), but PCV values were moderate during initial stages (20, 40, 60 d) and higher during later stages (80, 100 d). The GCV values were high for pod yield, moderate for number of pods and plant height, and low for hundred seed weight, number of primary branches, and shelling out-turn. The PCV values were high for pod yield and number of pods, moderate for plant height, hundred seed weight, and number of primary branches, but low for shelling out-turn. The broad sense heritability (H bs) values for VCR and SCMR were moderate at early stages (20, 40, 60 d) when IDC symptoms were moderate, while higher at later stages (80, 100 d) when IDC symptoms were severe. The H bs values were moderate for pod yield, number of pods, plant height, shelling out turn and number of primary branches, but high for hundred seed weight. The GAM values for VCR and SCMR across five stages were moderate to high. The GAM values were higher for pod yield and number of pods, moderate for plant height and hundred seed weight, but low for number of primary branches and shelling out-turn.
Table 1. Genetic variability for IDC tolerance and yield-related traits for pooled data across 2 years in groundnut mini core
VCR, visual chlorotic rating; SCMR, SPAD chlorophyll meter reading; d, days after sowing; GCV, genotypic coefficient of variation; PCV, phenotypic coefficient of variation; H bs, heritability broad sense; GAM, genetic advance as per cent of mean.
Ferrous and chlorophyll content
At the severe stage of IDC incidence (60 d) during the 2014 Rainy season, 14 accessions of the mini core belonging to different botanical varieties with varying IDC response ranging from tolerant to susceptible were selected along with two checks (ICGV 86031 and R 9227) (Online Supplementary Table S3). The chlorophyll (‘a’, ‘b’ and total) and ferrous (Fe2+) content in the standard leaf was estimated among these 16 genotypes to understand their relation with VCR and SCMR. The selected mini core accessions showed wide variation for chlorophyll ‘a’ (0.149–1.846 mg/g), chlorophyll ‘b’ (0.026–0.394 mg/g), total chlorophyll (0.175–2.240 mg/g), and ferrous content (3.73–9.16 mg/kg) depending on the intensity of IDC. The mini core accessions with lower VCR and higher SCMR had high ferrous and chlorophyll (‘a’, ‘b’ and total) content than those accessions with higher VCR and lower SCMR irrespective of the botanical variety they belonged to. Ferrous and chlorophyll (‘a’, ‘b’ and total) contents were higher in IDC tolerant check ICGV 86031 (8.94 mg/kg; 1.462, 0.184 and 1.646 mg/g) compared with susceptible check R 9227 (5.33 mg/kg; 0.377, 0.067 and 0.444 mg/g), respectively. Accessions with high IDC tolerance belonging to different botanical varieties such as hypogaea bunch (ICG 5051) (9.164 mg/kg; 1.846, 0.394 and 2.240 mg/g), vulgaris (ICG 11651) (9 mg/kg; 1.107, 0.194 and 1.300 mg/g) and hypogaea runner (ICG 4156) (6.213 mg/kg; 0.561, 0.091, 0.652 mg/g) had higher ferrous and chlorophyll (a, b and total) content, respectively. The highly significant negative correlation was observed between VCR and SCMR at 60 d (−0.947). VCR showed highly significant negative correlation with ferrous (−0.707) and chlorophyll content (a, b, and total) (−0.783, −0.721, −0.779), while SCMR showed highly significant positive correlation with ferrous (0.645) and chlorophyll content (a, b and total) (0.725, 0.671, 0.721). Ferrous (Fe2+) content showed significant positive correlation with chlorophyll ‘a’ (0.885), chlorophyll ‘b’ (0.795) and total chlorophyll (0.877) content.
Mean comparison among botanical groups
The group means and range for four different groups comprising mini core accessions belonging to six botanical varieties were estimated for IDC-related traits such as VCR and SCMR across five stages and also for yield-related traits (Table 2). During the severe stages of IDC incidence i.e. from 60 to 100 d, group 3 (hypogaea bunch) was consistently tolerant to IDC followed by group 4 (hypogaea runner + hirsuta) and group 1 (vulgaris) as evident from significantly lesser VCR and higher SCMR group means. The group 2 (fastigiata + peruviana + aequatoriana) was distinctly susceptible to IDC as evident from significantly higher VCR and lesser SCMR group means. Among yield-related traits, group 3 (hypogaea bunch) was found superior for plant height and number of primary branches per plant, group 4 (hypogaea runner + hirsuta) for pod yield per plant and hundred seed weight and group 1 (vulgaris) for number of pods per plant and shelling out-turn as evident from higher group means. Under iron deficiency stress, group 3 (hypogaea bunch) showed IDC tolerance and also better performance for yield-related traits.
Table 2. Range and mean comparison among four groups comprising six botanical varieties of groundnut mini core for VCR, SCMR and yield-related traits

VCR, visual chlorotic rating; SCMR, SPAD chlorophyll meter reading; d, days after sowing; PHT, plant height (cm); NPB, number of primary branches per plant; NP, number of pods per plant; PYP, pod yield (g/plant); SHO, shelling out-turn (%); HSW, hundred seed weight (g).
a Mean comparison for each trait among different groups is depicted row-wise using Student–Newman–Keul's test at P = 0.05; alphabets (a, b, c, d) followed by the group means in a row indicate the relative superiority of the respective group for the trait in that order (a–superior, d–inferior); groups with same alphabets are similar in their response for the trait.
Promising IDC tolerant sources
Evaluation of 184 accessions of the mini core along with controls (4) and checks (8) with varying degree of IDC response has led to the identification of IDC tolerant sources with significantly lesser VCR and higher SCMR values (Table 3). The most promising IDC tolerant accessions were ICG 5051 (1.51, 34.9) and ICG 6766 (1.54, 34.0) which recorded lowest mean VCR and highest mean SCMR values across five stages in comparison with the best IDC tolerant check ICGV 06146 (1.62, 32.5), respectively. At the most severe stage of IDC incidence, i.e.100 d, the IDC tolerant accessions ICG 5051 (1.79, 33.8) and ICG 6766 (1.83, 32.7) recorded lower or on par VCR and SCMR values in comparison with the best IDC tolerant check ICGV 06146 (1.81, 30.5), respectively. Majority of the IDC tolerant accessions identified were from hypogaea bunch type viz. ICG # 5051, 6766, 5286, 6667, 4538, 14008, 5663, 9842 and 11855 that recorded lower or on par VCR, while higher or on par SCMR with IDC tolerant checks. However, few genotypes with IDC tolerance were also identified from hypogaea runner (ICG 10479), fastigiata (ICG 10890), and vulgaris (ICG 11651, ICG 118) that recorded lower or on par VCR, while higher or on par SCMR.
Table 3. Promising IDC tolerant accessions identified in groundnut mini core belonging to four botanical varieties

CAR, Central African Republic; ICRISAT, International Crops Research Institute for the Semi-Arid Tropics; UASD, University of Agricultural Sciences Dharwad; TNAU, Tamil Nadu Agricultural University; d, days after sowing.
a IDC tolerant checks – ICGV06146, ICGV 86031 (vulgaris), A30b (hypogaea bunch); IDC susceptible checks – R 9227, TMV 2 (vulgaris).
Correlations
The VCR and SCMR across five stages (20, 40, 60, 80 and 100 d) showed significant negative correlations between them (Online Supplementary Table S4). At most severe stages of IDC incidence (60, 80, 100 d), VCR showed significant negative correlation with pod yield and its related traits such as the number of pods per plant, hundred seed weight, number of primary branches and plant height, while SCMR showed significant positive correlation with them. Pod yield under iron deficiency stress showed significant positive correlation with related traits such as number of pods, shelling out-turn, hundred seed weight, number of primary branches and plant height.
Principal component analysis
The PCA based on 16 characters i.e. VCR and SCMR across five stages, pod yield and its related traits revealed five major principal components (PC1, PC2, PC3, PC4 and PC5) that explained 80% of the total variation (online Supplementary Table S5). The PC1 explained 46.9% of the variation and was mainly contributed by VCR and SCMR across five stages. The PC2 which explained 11.4% of the variation was mainly contributed by shelling out-turn, number of pods and pod yield. The PC3 that explained 9.2% of the variation was contributed by plant height, hundred seed weight, pod yield, number of primary branches and also VCR and SCMR at 20 and 40 d. The PC4 which explained 6.8% of the variation was contributed by hundred seed weight, number of primary branches, VCR and SCMR at 20, 40, 80 and 100 d. The PC5 that explained 5.6% of the variation was contributed by hundred seed weight, number of primary branches, plant height, VCR at 20 and 60 d and SCMR at 60 d. The biplot generated using PC1 and PC2 explained 58.38% of the total variation (Fig. 1). The distribution of genotypes was based on their IDC response wherein, tolerant genotypes were distinctly separated from susceptible ones. The VCR and SCMR at later stages showed higher variation than early stages indicating better differentiation of genotypes. The VCR and SCMR across all five stages were distinctly negatively related as they are positioned in opposite direction in the biplot. The traits such as shelling out-turn, number of pods and pod yield showed the highest variation as they were farthest from the centre.
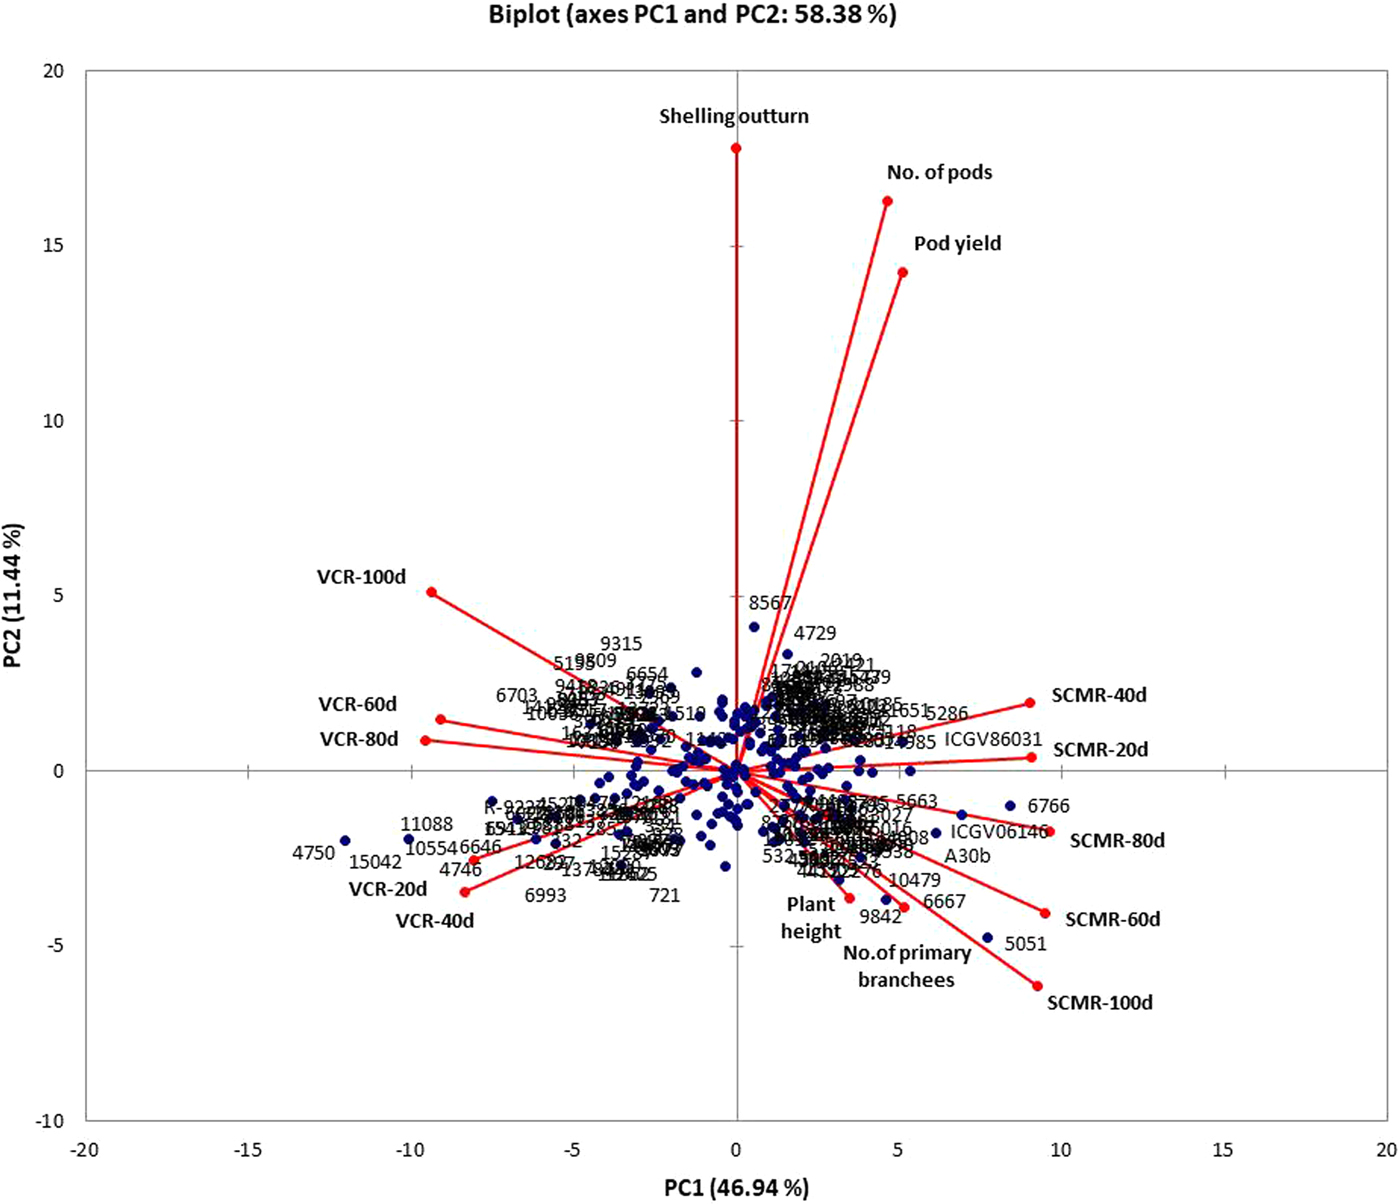
Fig. 1. Biplot depicting distribution of genotypes and IDC tolerance and yield-related traits.
Hierarchical clustering
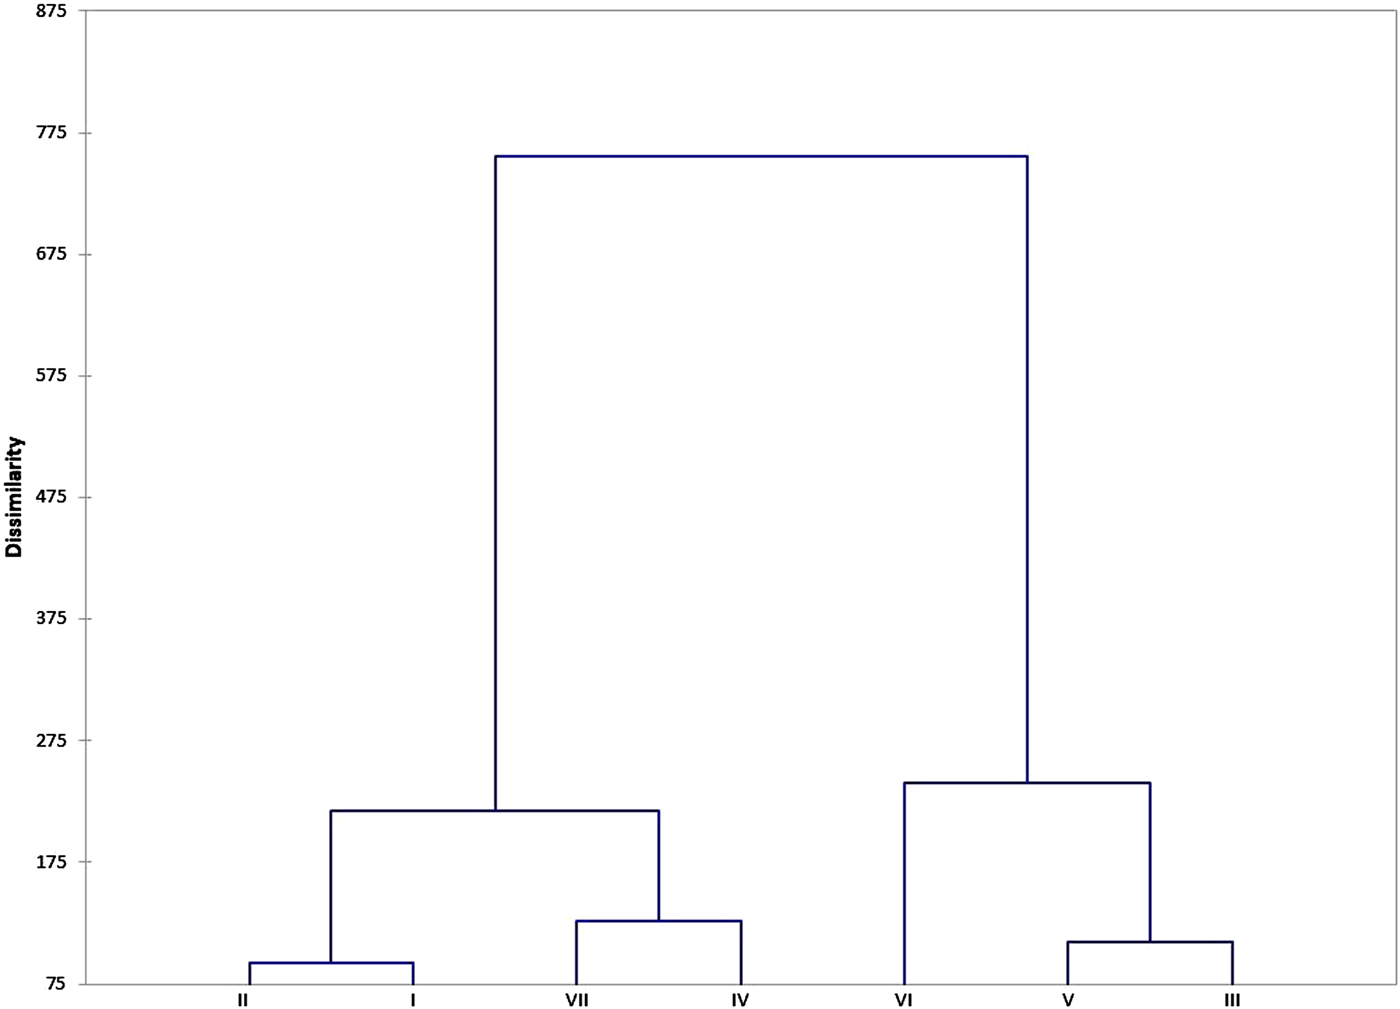
The hierarchical clustering using Euclidian distances of five major principal components revealed seven major clusters (I–VII) (Fig. 2) with each cluster having accessions from one to six different botanical varieties (Table 4). The clustering was mainly based on the IDC response of accessions as measured by VCR and SCMR across five stages. The cluster VII had IDC tolerant mini core accessions (ICG 5051, 6766) and checks (A30b, ICGV06146) with very low VCR (1.58) and very high SCMR (33.4) cluster mean values across five stages. The clusters IV (2.04, 27.5) and II (2.07, 26.9) had mini core accessions (38, 26 accessions) and checks/controls (ICGV 86031, DSG 1, GPBD 5, ICG 13941, ICG 13942) that were moderately tolerant to IDC as evident from lower VCR and higher SCMR cluster mean values, respectively. The clusters I (2.21, 25.5), III (2.30, 24.7), and V (2.53, 22.6) had mini core accessions (41, 40, 30 accessions, respectively) and checks/controls (GPBD 4, TMV 2, R 9227, ICG 156, ICG 2738) that were moderately susceptible to IDC as evident from moderately higher VCR and lower SCMR cluster mean values, respectively. The cluster VI had eight mini core accessions that were susceptible to IDC as evident from higher VCR (2.92) and lower SCMR (19.4) cluster mean values. The intracluster variance was highest for cluster VI (14.266) followed by clusters VII (6.616), IV (5.47), II (5.2), V (4.846), III (4.187) and I (4.183) (Table 4). The intercluster distance between clusters VI and VII was highest (14.684) followed by between clusters V and VII (10.876) (online Supplementary Table S6). The clusters VI and VII were farthest from the remaining clusters (I–V).

Fig. 2. Dendrogram depicting seven clusters based on dissimilarity.
Table 4. Hierarchical clustering of mini core accessions, controls, and checks belonging to six botanical varieties
Discussion
Groundnut grown under calcareous and alkaline soils displays IDC that causes significant reduction in pod yield in countries such as India (Singh et al., Reference Singh, Chaudhari, Koradia and Zala1995; Singh, Reference Singh2001), China (Gao and Shi, Reference Gao and Shi2007) and Pakistan (Imtiaz et al., Reference Imtiaz, Rashid, Khan, Memon and Aslam2010; Akhtar et al., Reference Akhtar, Shahzad and Arshad2013). Under extreme cases, IDC may also lead to complete crop failure. The most economical and sustainable solution to combat IDC is to develop groundnut cultivars with a high level of tolerance to IDC as they perform well under Fe-deficient conditions (Samdur et al., Reference Samdur, Mathur, Manivel, Singh, Bandyopadhyay and Chikani1999; Prasad et al., Reference Prasad, Satyanarayana, Potdar and Craufurd2000; Gao and Shi, Reference Gao and Shi2007). Groundnut improvement for IDC tolerance requires the availability of highly tolerant and diverse sources. Since the global collections of groundnut germplasm have a very large number of accessions, they are not ideal for evaluation. The mini-core collection of groundnut comprising 184 accessions representing the diversity of the entire collection (Upadhyaya et al., Reference Upadhyaya, Bramel, Ortiz and Singh2002) provides an opportunity for evaluation and identification of diverse sources of IDC tolerance. The mini-core collection that was evaluated for IDC response in iron-deficient calcareous soils displayed enormous genotypic differences among the accessions for IDC related traits such as VCR and SCMR across five stages (20, 40, 60, 80 and 100 days) as evident from wide range of variation (online Supplementary Table S2, Table 1). The genetic components of variability such as GCV and PCV showed moderate to high genotypic differences for VCR, SCMR, pod yield, number of pods per plant, plant height and hundred seed weight among mini core accessions (Table 1). Moderate to high heritability and GAM values for VCR and SCMR at a severe stage of IDC and also for pod yield, number of pods, plant height and hundred seed weight among mini core accessions suggest that we can make improvement for IDC tolerance and also pod yield by performing selection under iron deficiency stress. Earlier, genotypic differences for IDC response as measured by VCR and SPAD values have been noted among groundnut germplasm (Samdur et al., Reference Samdur, Mathur, Manivel, Singh, Bandyopadhyay and Chikani1999, Reference Samdur, Singh, Mathur, Manivel, Chikani, Gor and Khan2000; Gao and Shi, Reference Gao and Shi2007; Akhtar et al., Reference Akhtar, Shahzad and Arshad2013; Su et al., Reference Su, Zhang, Su, Liu, Liu and Shi2015). The traits such as VCR and SCMR have been established as extremely useful for preliminary and large-scale screening of germplasm or breeding material for IDC response due to their simplicity and robustness (Gao and Shi, Reference Gao and Shi2007; Boodi et al., Reference Boodi, Pattanashetti and Biradar2015a, Reference Boodi, Pattanashetti, Biradar, Naidu, Chimmad, Kanatti, Kumar and Debnathb).
In groundnut, earlier reports suggest the beginning of iron deficiency at 10–15 days after emergence, while attaining of maximum intensity at 30–70 days (Singh and Chaudhari, Reference Singh and Chaudhari1993) or 50–65 days after emergence (Li et al., Reference Li, YanXi and JianMin2009a). In this study also the severity of IDC was found increasing from the initial (20 d) to later (40, 60 d) stages as evident from the increase in VCR scores and decrease in SCMR values. Further increase in IDC severity at much later stages (80, 100 d) in this study was due to the occurrence of rain or protective irrigation provided during these stages.
Enormous differences were also observed among the mini core accessions for pod yield and its related traits such plant height, number of primary branches, number of mature pods per plant, shelling out turn and hundred seed weight indicating the genotypic differences for these traits in mini core under iron deficiency stress (online Supplementary Table S2, Table 1). As noted in this study, moderate to severe yield reductions among IDC susceptible genotypes were reported earlier in groundnut (Singh et al., Reference Singh, Chaudhari, Koradia and Zala1995; Singh, Reference Singh2001). IDC tolerant genotypes have been found to show higher pod yield and its related traits compared with susceptible genotypes as noted earlier in groundnut (Akhtar et al., Reference Akhtar, Shahzad and Arshad2013). Reduction in pod yield among selected IDC tolerant genotypes under Fe-applied and Fe-stress conditions need to be critically assessed to unravel the yield contributing traits under IDC stress.
Iron deficiency leads to interveinal chlorosis which results in reduced chlorophyll content that may or may not get noticed through visual scoring for chlorosis. The reduction of chlorophyll content in leaves is at least in part due to the role of Fe in the formation of precursors of the chlorophyll molecule i.e., δ-aminolevulinic acid and protochlorophyllide (Marschner, Reference Marschner1986). Chlorotic plants have been earlier found to show lesser active Fe (Fe2+) content in leaves (Singh, Reference Singh, Singh and Purohit1994). To establish the associations between IDC, chlorophyll (a, b and total), and active Fe (Ferrous, Fe2+) content, they were estimated among 16 representative accessions of mini core with varying IDC response (tolerant to susceptible) along with checks at most severe stage of IDC response (60 d) during rainy season of 2014 (online Supplementary Table S3). Tolerant genotypes had higher chlorophyll and active Fe content compared with susceptible genotypes irrespective of the botanical variety they belonged to. The leaves of chlorotic plants have been earlier found to have lesser chlorophyll (Samdur et al., Reference Samdur, Singh, Mathur, Manivel, Chikani, Gor and Khan2000) and active Fe content (Singh, Reference Singh, Singh and Purohit1994) in groundnut. The significant positive correlation was observed between active Fe and chlorophyll (a, b and total) content with SCMR, while the significant negative correlation with VCR. Active Fe content showed significant positive correlation with chlorophyll (a, b and total) as noted earlier in groundnut (Akhtar et al., Reference Akhtar, Shahzad and Arshad2013). These results of chlorophyll and active Fe content along with VCR and SCMR values at the most severe stage of IDC incidence confirm the genotypic differences for IDC response at a biochemical level among the mini core accessions.
The significant negative correlations were observed between VCR and SCMR across five growth stages (online Supplementary Table S4) as noted earlier in groundnut (Boodi et al., Reference Boodi, Pattanashetti, Biradar, Naidu, Chimmad, Kanatti, Kumar and Debnath2015b). During the severe stages of IDC incidence (60, 80, 100 d), VCR showed significant negative correlation, while SCMR showed significant positive correlation with pod yield and its related traits such as number of pods, hundred seed weight, number of primary branches and plant height as noted earlier in groundnut (Boodi et al., Reference Boodi, Pattanashetti, Biradar, Naidu, Chimmad, Kanatti, Kumar and Debnath2015b). Under iron deficiency stress, pod yield showed significant positive correlation with related traits such as number of pods, shelling out-turn, hundred seed weight, number of primary branches and plant height indicating that these traits contribute for pod yield under IDC. Further, SPAD is an indirect indicator of chlorophyll content as significant correlations have been established earlier in groundnut (Samdur et al., Reference Samdur, Singh, Mathur, Manivel, Chikani, Gor and Khan2000; Boodi et al., Reference Boodi, Pattanashetti, Biradar, Naidu, Chimmad, Kanatti, Kumar and Debnath2015b). The SCMR values are more robust and suitable than the estimation of chlorophyll content for large-scale screening of groundnut genotypes for IDC response. The active Fe content has been shown as an important indicator of IDC tolerance among groundnut genotypes (Reddy et al., Reference Reddy, Ashalatha and Venkaiah1993; Singh, Reference Singh, Singh and Purohit1994; Gao and Shi, Reference Gao and Shi2007; Li et al., Reference Li, YanXi and JianMin2009b). For confirmation of identified sources of IDC tolerance, estimations such as chlorophyll and active Fe content will be done across several growth stages of groundnut.
Evaluation of groundnut mini core has led to the identification of 13 IDC tolerant sources belonging to different botanical varieties which displayed lesser VCR and higher SCMR values in comparison to IDC tolerant checks (Table 3). The most promising IDC tolerant accessions were ICG 5051 and ICG 6766 belonging to hypogaea bunch type. Majority of the IDC tolerant accessions identified were from hypogaea bunch type with few accessions from hypogaea runner, fastigiata and vulgaris. The IDC tolerance sources identified were irrespective of the country of their origin. This is the first report which indicates a higher degree of IDC tolerance among hypogaea bunch type of groundnut. Grouping of the mini core accessions by PCA and hierarchical clustering was mainly based on their IDC response. There was distinct clustering of mini core accessions/controls/checks that were tolerant, moderately tolerant, moderately susceptible, or susceptible to IDC (Fig. 1, Table 4, Fig. 2). The IDC tolerant accessions (ICG 5051, ICG 6766) and checks (A30b, ICGV06146) formed a distinct cluster VII (Fig. 2). These results are in collinearity with lower VCR and higher SCMR values recorded by these accessions (Table 3). The identified IDC tolerant sources need to be studied in detail including biochemical investigations for confirmation of IDC tolerance. The confirmed sources of IDC tolerance can be crossed with high yielding and adapted groundnut cultivars to develop high yielding and IDC tolerant groundnut varieties for cultivation in iron-deficient calcareous and alkaline soils.
Supplementary material
The supplementary material for this article can be found at https://doi.org/10.1017/S1479262117000326.
Acknowledgements
Authors are grateful to Dr H. D. Upadhyaya, Head – Genebank, ICRISAT, Patancheru (India) for providing seeds of mini-core collection of groundnut for evaluation and staff of Department of Genetics and Plant Breeding, College of Agriculture, Vijayapur for their support in conducting the field trial. Authors also declare that there is no conflict of interest with regard to the research undertaken.